Getting Started with OpenObserve
Explore latest insights and updates
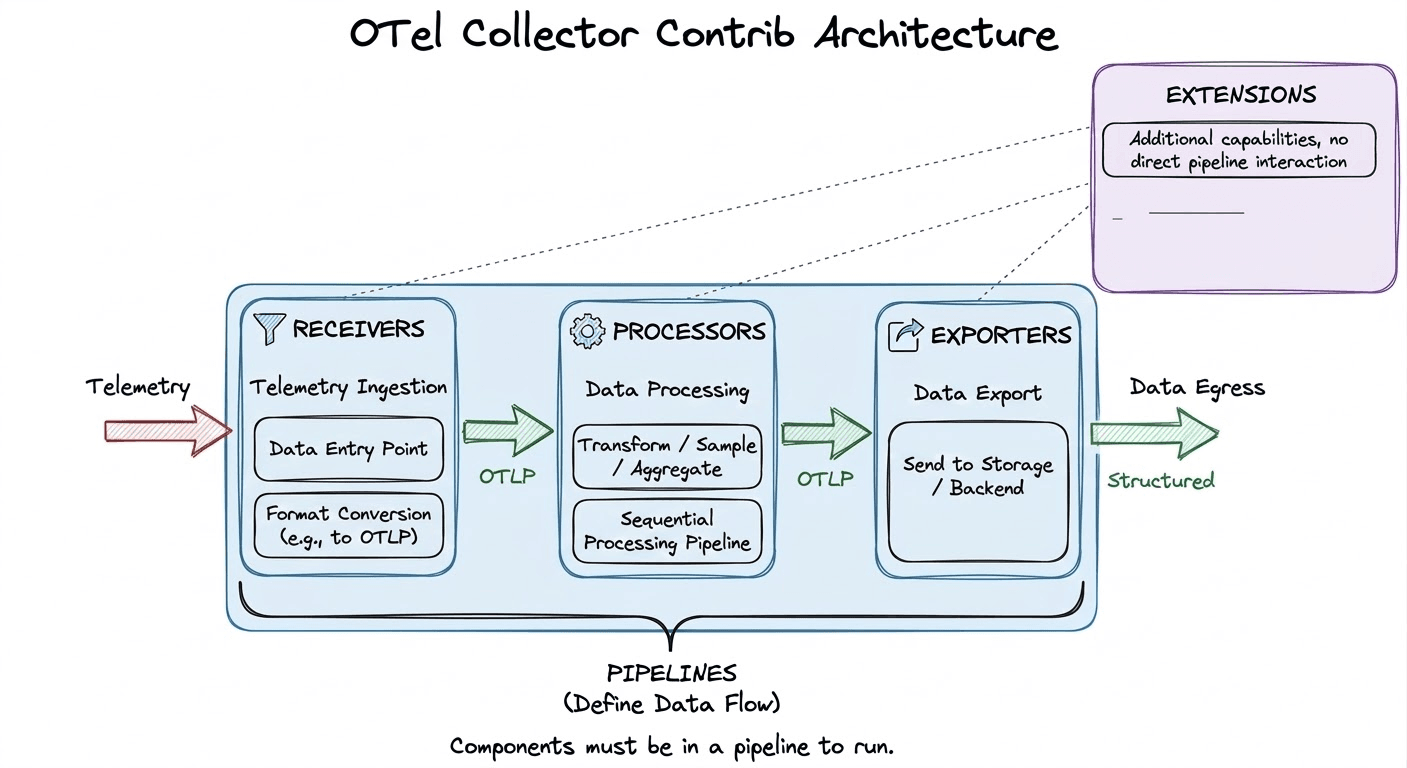
Learn how to use the OpenTelemetry Collector Contrib distribution to collect, process, and export telemetry data. This guide covers architecture, key components, configuration examples, and practical deployment tips.
A complete guide to full stack observability - covering frontend, backend, infrastructure, traces, logs, metrics, and OpenTelemetry for DevOps and SRE teams.
Looking for a DataDog alternative for Real User Monitoring? Compare OpenObserve vs DataDog for RUM capabilities: session replay with privacy masking, Core Web Vitals tracking (LCP, INP, CLS), error detection, and SQL-based user analytics.
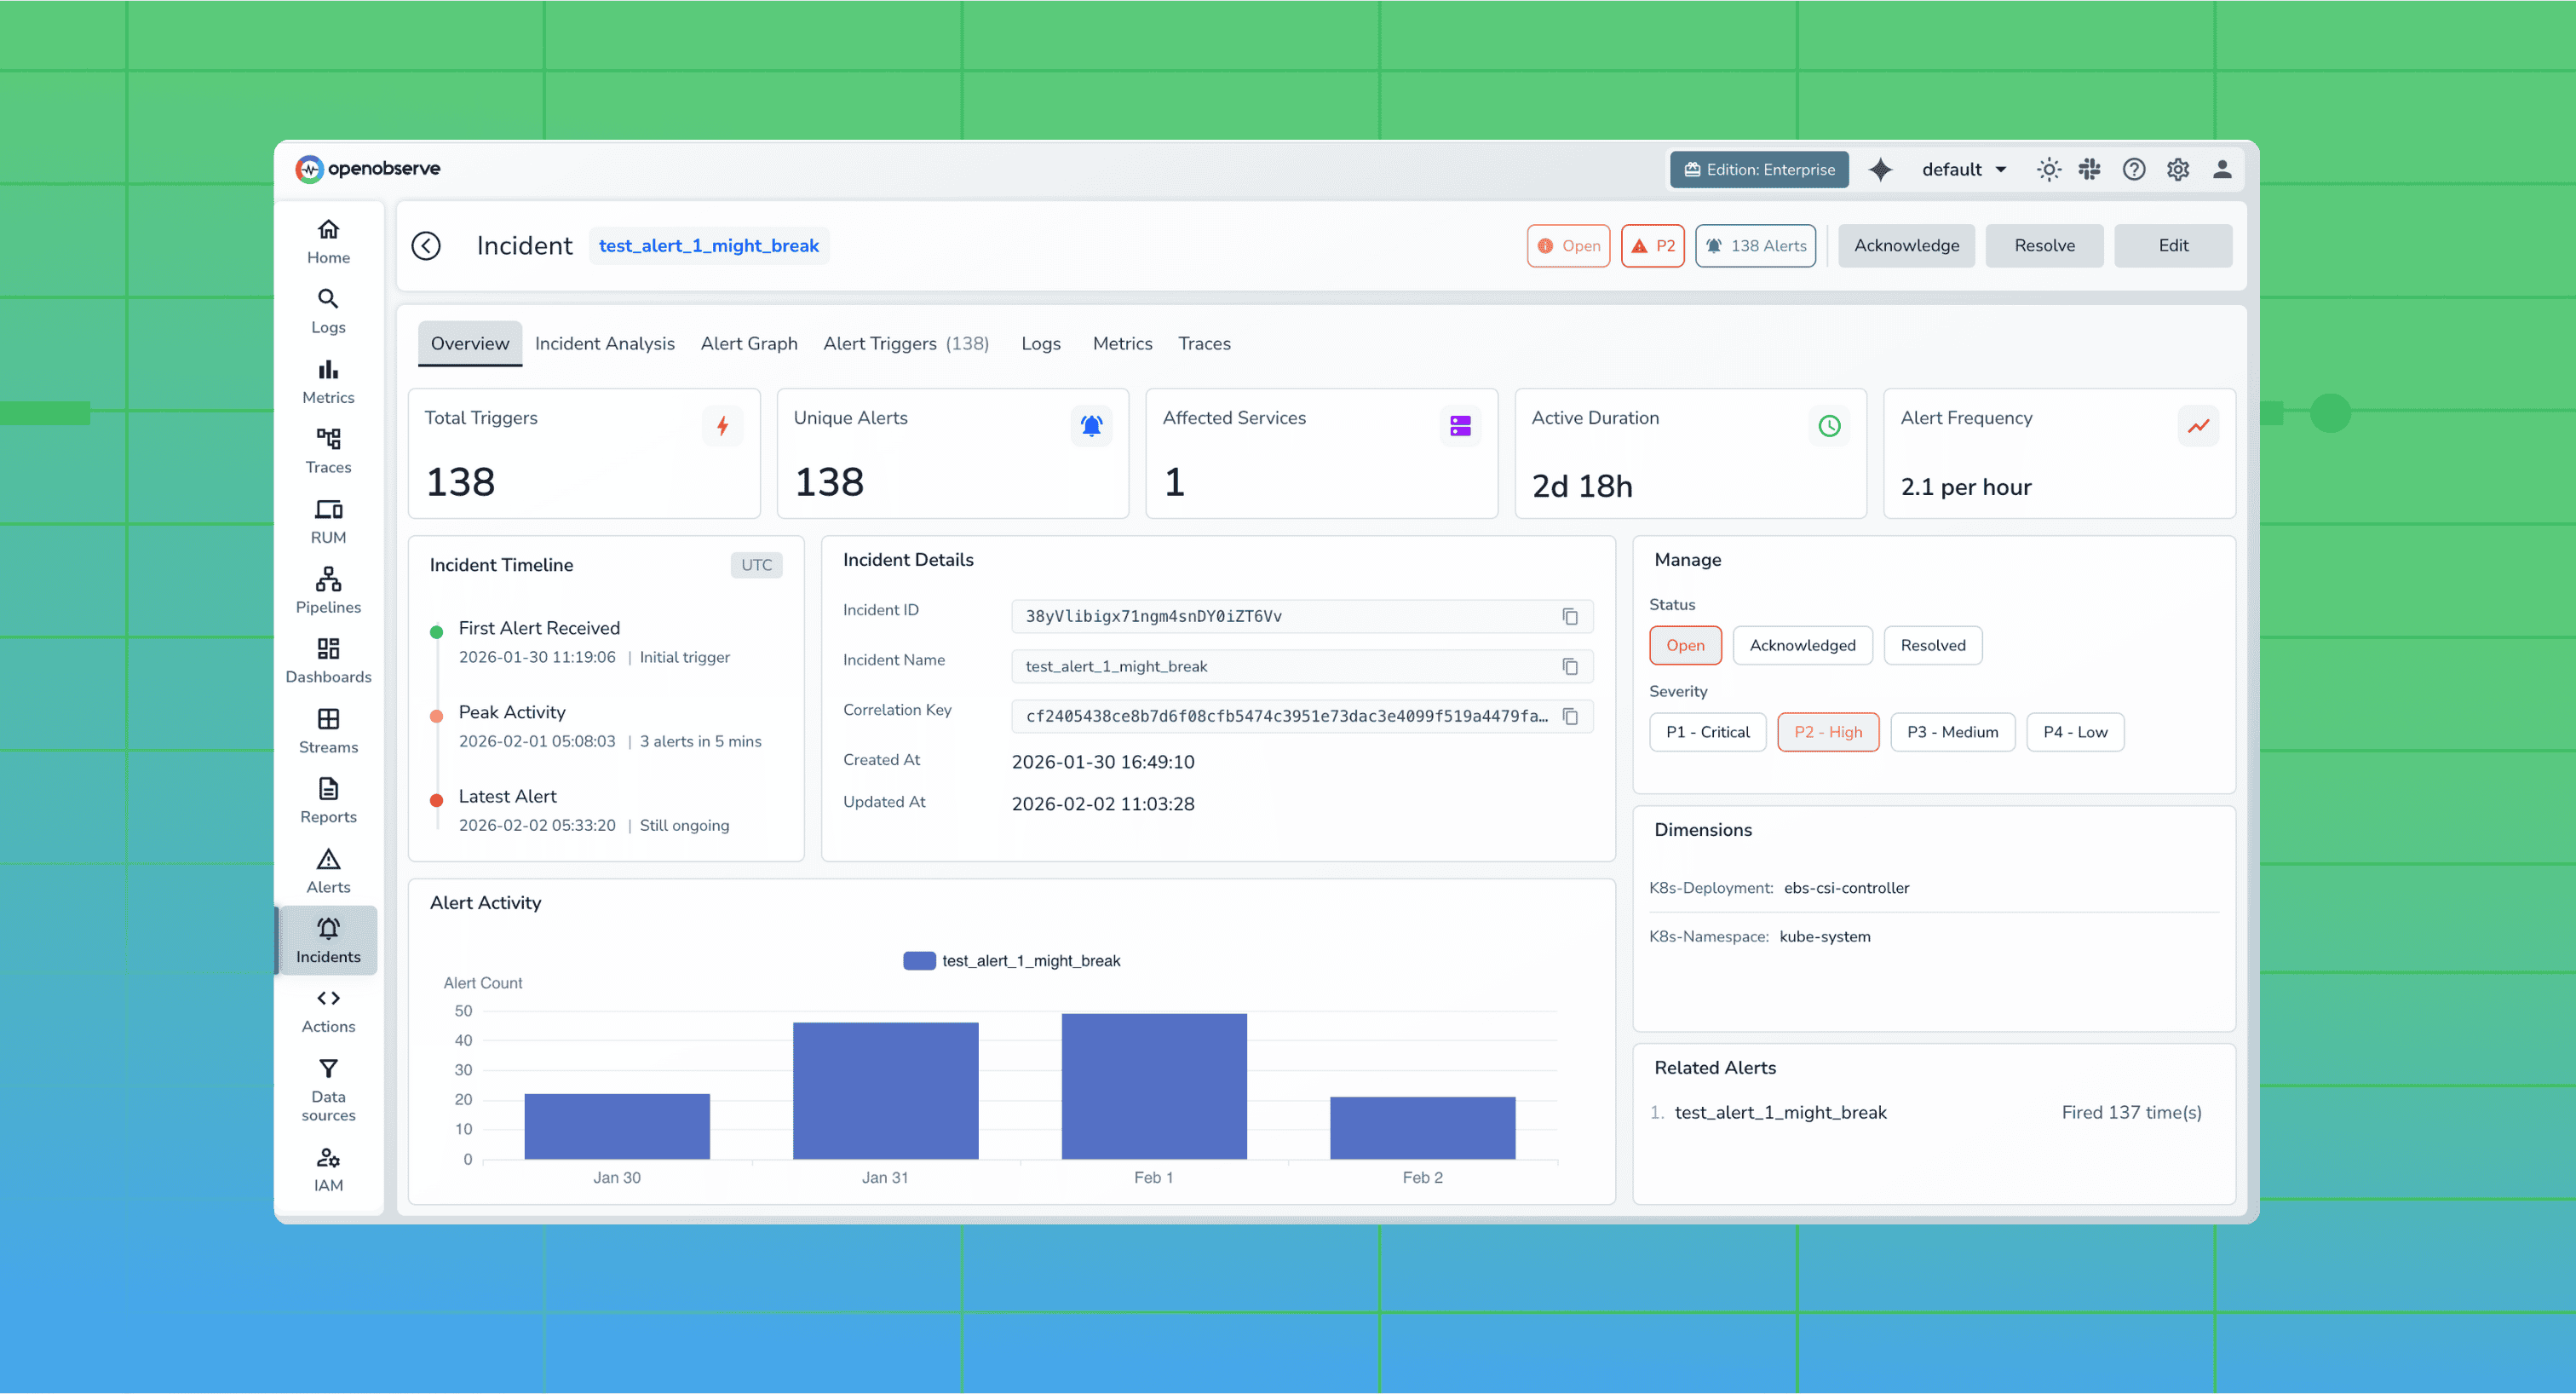
Learn how incident correlation transforms observability by connecting logs, metrics, traces, and alerts into actionable insights. Discover why modern engineering teams rely on correlated telemetry to reduce MTTR and eliminate blind spots in distributed systems.
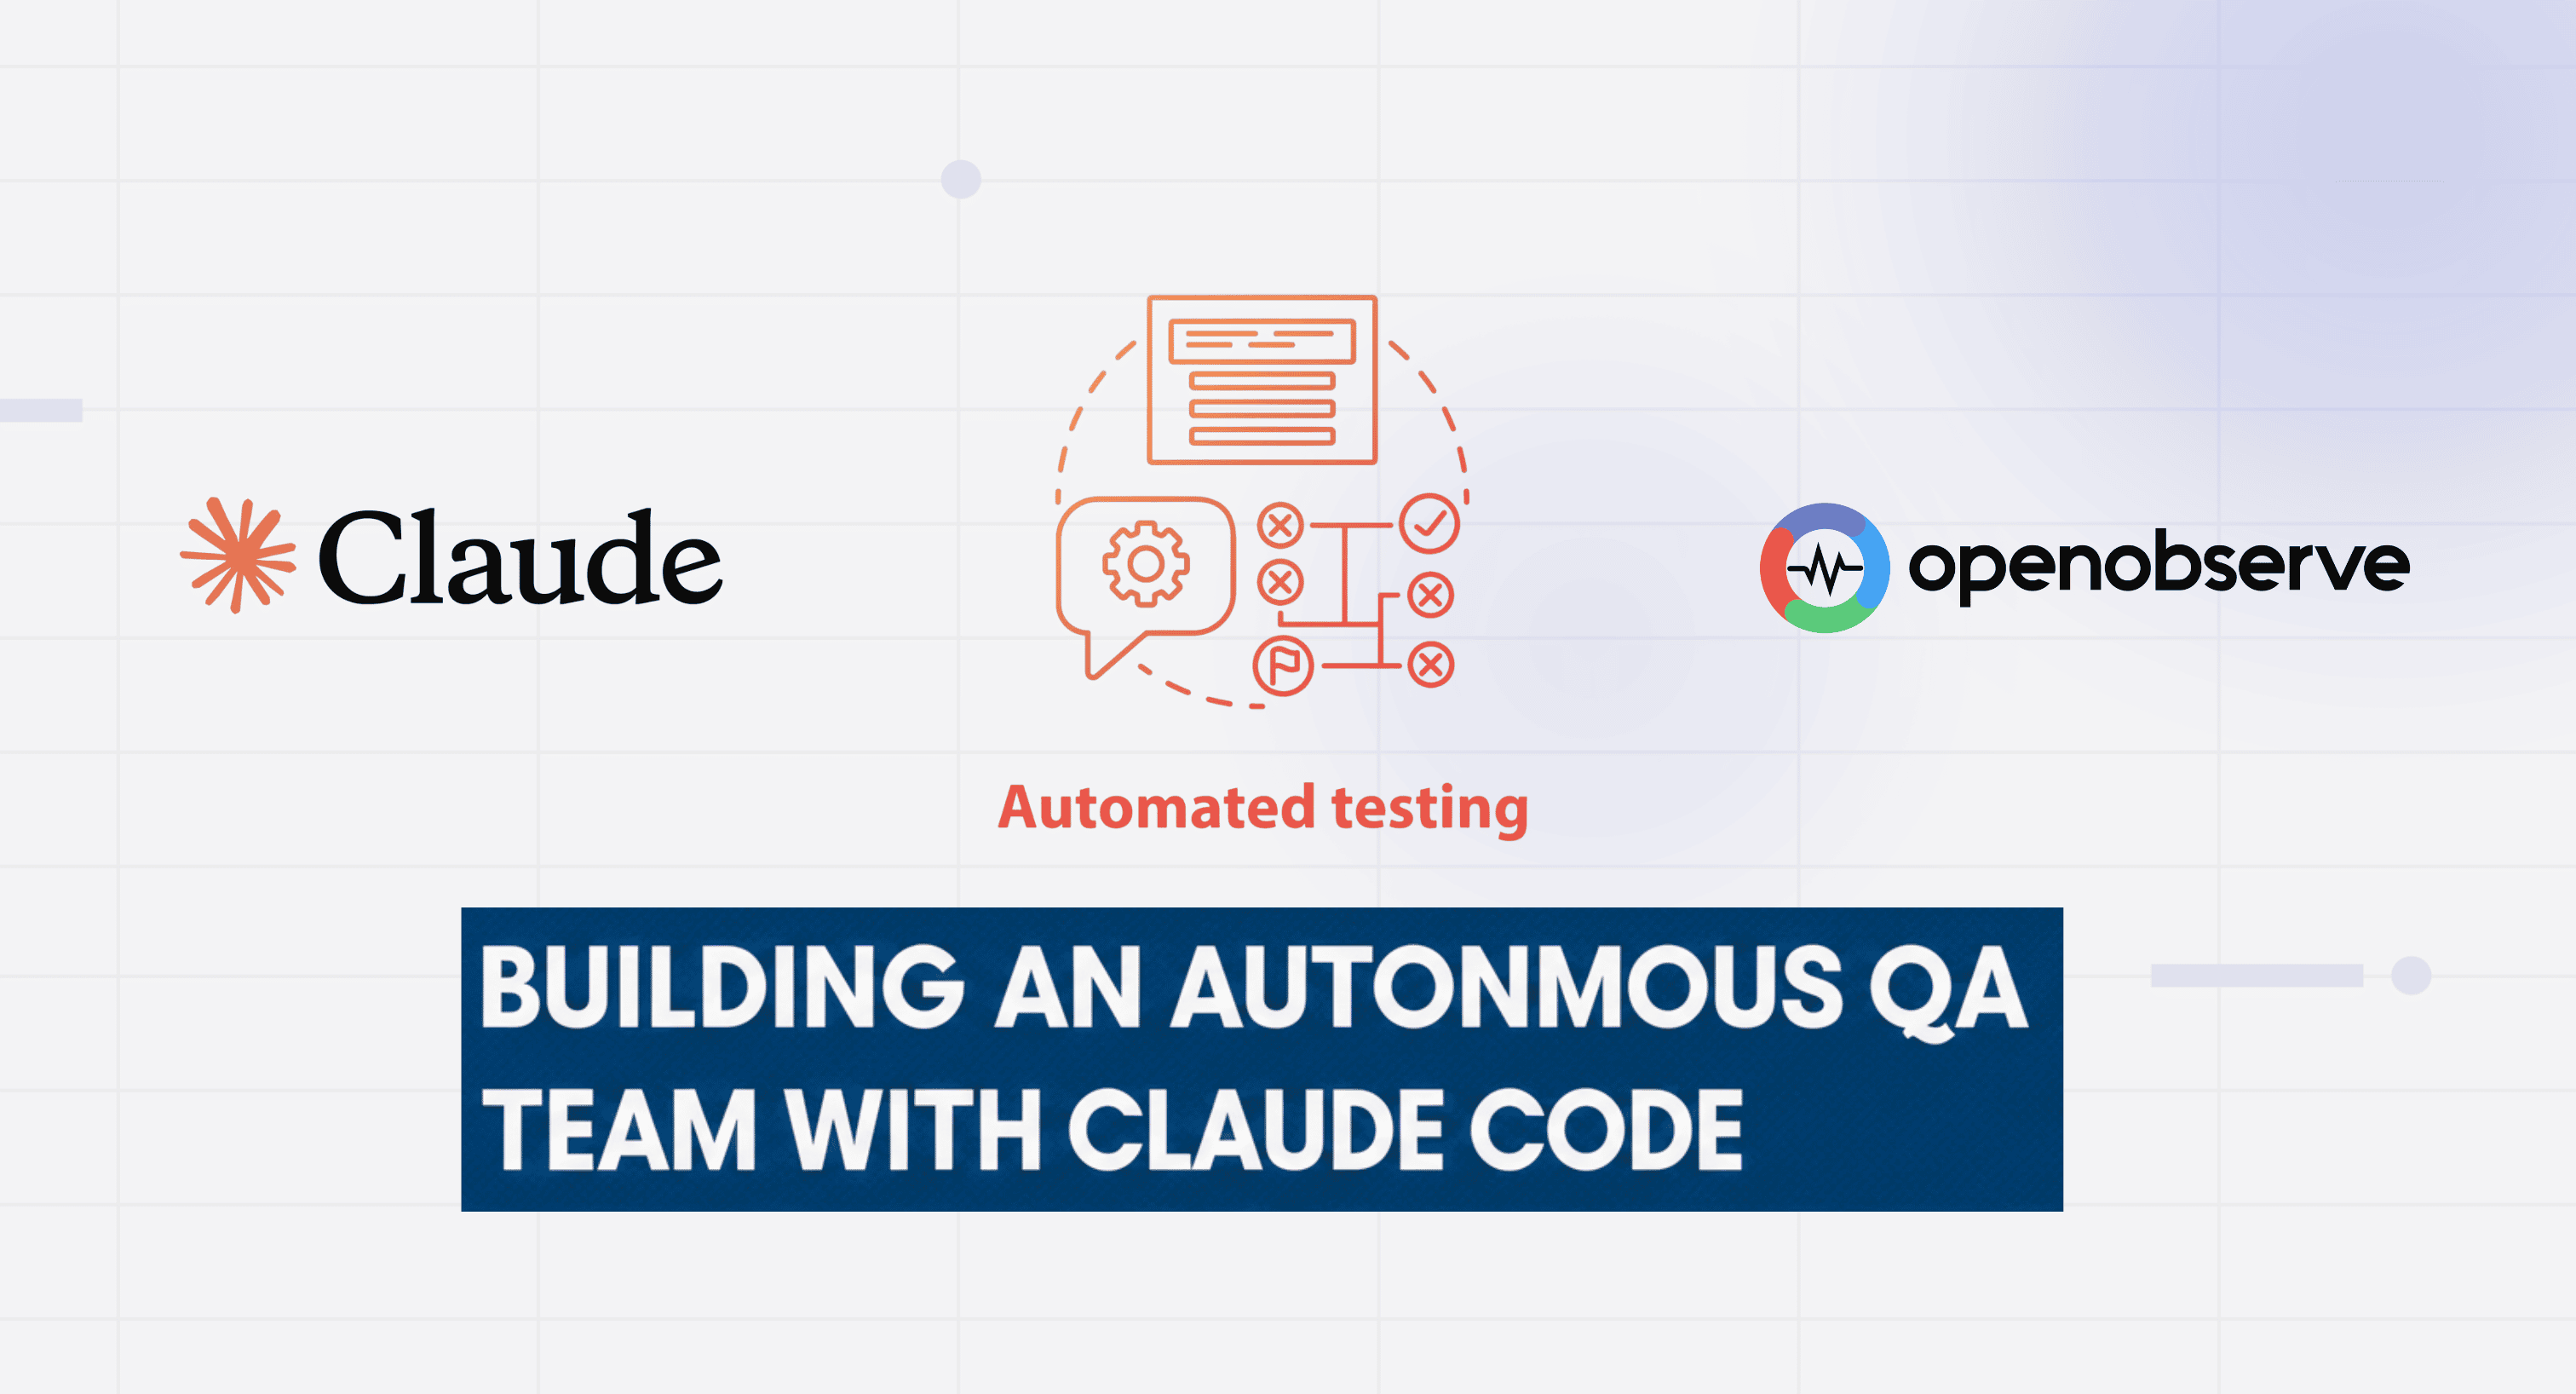
Discover how OpenObserve built the "Council of Sub Agents" - eight specialized AI agents powered by Claude Code that automate end-to-end testing. Learn how we reduced feature analysis time from 60 minutes to 5 minutes, eliminated 85% of flaky tests, grew test coverage from 380 to 700+ tests, and caught a production bug before customers reported it. This deep dive reveals the architecture, real-world impact, and lessons learned from building an autonomous QA team that doesn't just automate testing - it amplifies quality.
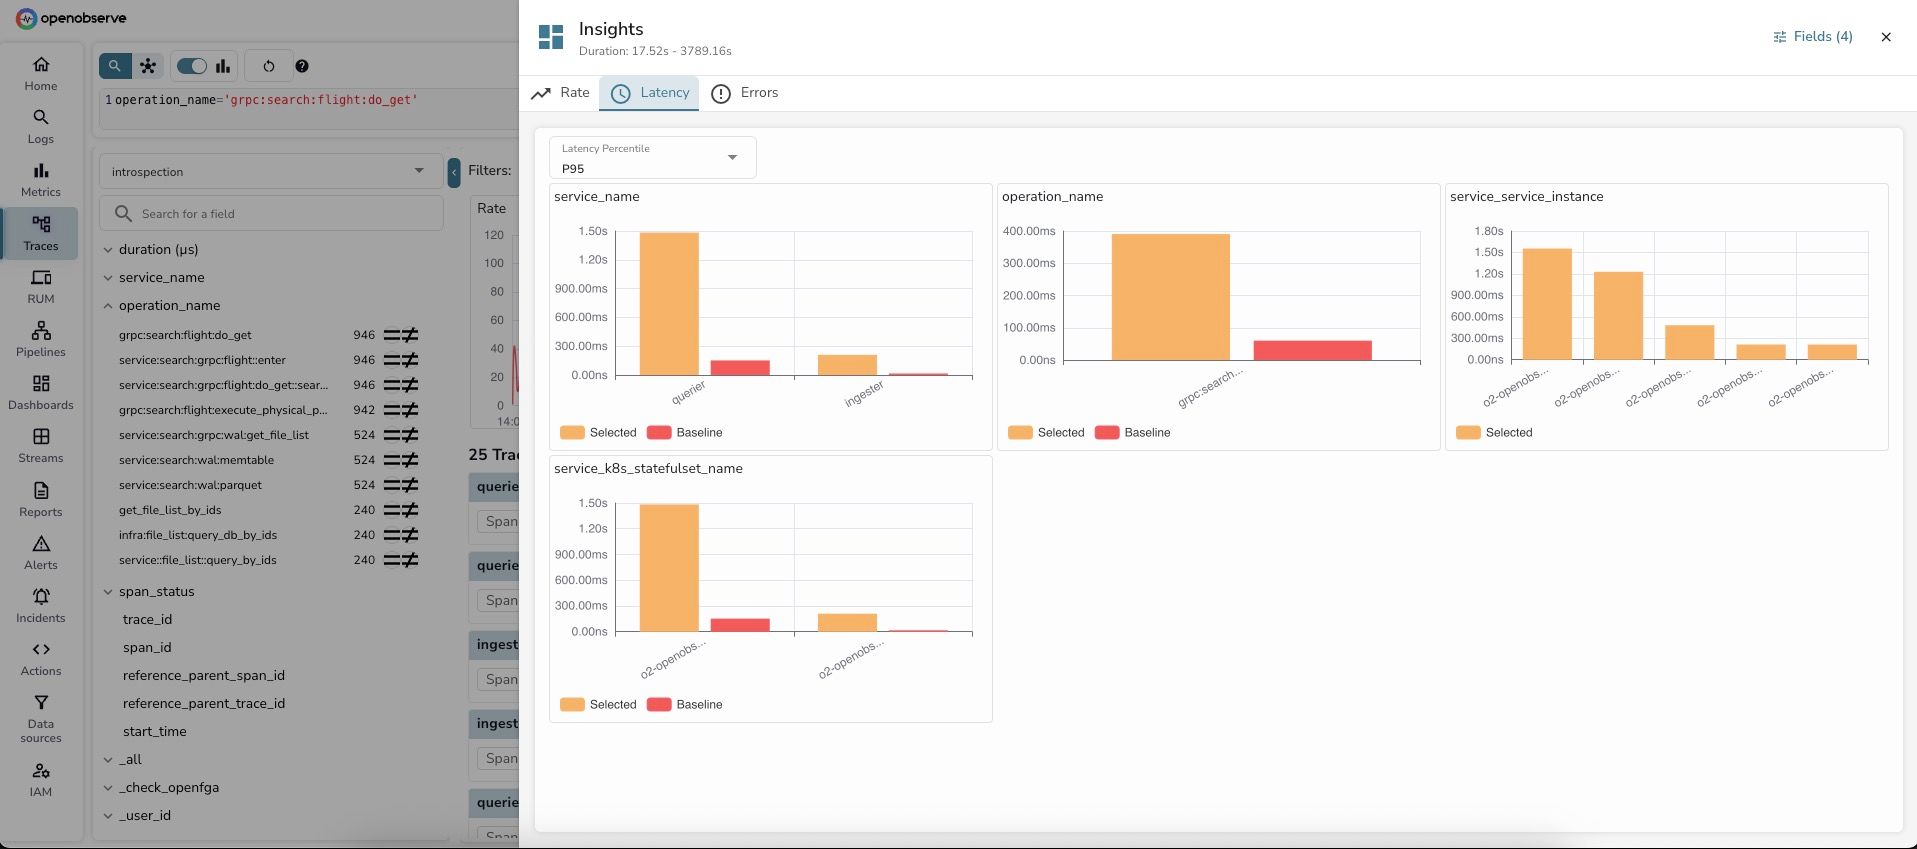
Learn how to use OpenObserve Insights for interactive log and trace analysis. Identify root causes in 60 seconds with dimension analysis. Real examples, step-by-step guides, and troubleshooting tips.
Cloud native was promised to be simple, yet observability has become a massive tax on both budgets and engineering time. Our new CRO, Shani Shoham, shares why he’s joining OpenObserve to break the cycle of expensive complexity and operational toil.
Hands-on comparison of DataDog vs OpenObserve pipelines. Explore real-time vs scheduled processing, VRL-based transformations, multi-destination routing, and cost-efficient, unified observability pipelines without extra infrastructure.
Does cheaper observability mean worse capabilities? We tested this assumption by sending identical telemetry from a 16-service OpenTelemetry demo to both DataDog and OpenObserve simultaneously. The results: DataDog costs $174/day vs OpenObserve's $3/day—98% cost savings without sacrificing visibility. Evereve achieved similar results: 90% cost reduction, platform consolidation, and unlimited instrumentation after migrating from DataDog.
Open source DataDog alternative IAM: SSO, RBAC, multi-tenancy included. Action-based permissions across 28+ modules. Compare $0.30/GB vs per-host pricing.
Hands-on comparison of DataDog and OpenObserve for alerting and monitoring. DataDog's proprietary monitor syntax and per-custom-metric charges vs OpenObserve's SQL-based unified alerts, composite conditions with joins, and Jinja2-templated notifications. Real test data shows custom metric pricing impact on alert coverage versus flat-rate pricing with comprehensive alerting capabilities.
Hands-on comparison of DataDog and OpenObserve for dashboard visualizations. DataDog's proprietary query syntax and premium tiers vs OpenObserve's SQL/PromQL queries, ECharts custom charts, and community dashboard library. Real test data shows 98% cost savings ($174/day vs $3/day) with identical dashboard capabilities and OpenTelemetry-native architecture.
OpenObserve Kubernetes Operator brings observability as code to platform teams. Manage alerts, pipelines, and functions as Kubernetes resources with GitOps workflows.
OpenObserve v0.40.0 comes just in time for the new year, a milestone release that brings major architectural improvements, powerful new alerting capabilities, enhanced observability features, and significant UI/UX refinements. This release represents months of work focused on making OpenObserve more powerful, reliable, and user-friendly.
Automatically extract patterns from millions of logs in seconds. Learn how OpenObserve's log pattern analysis helps SREs reduce incident investigation time from 30 minutes to under 5 minutes.
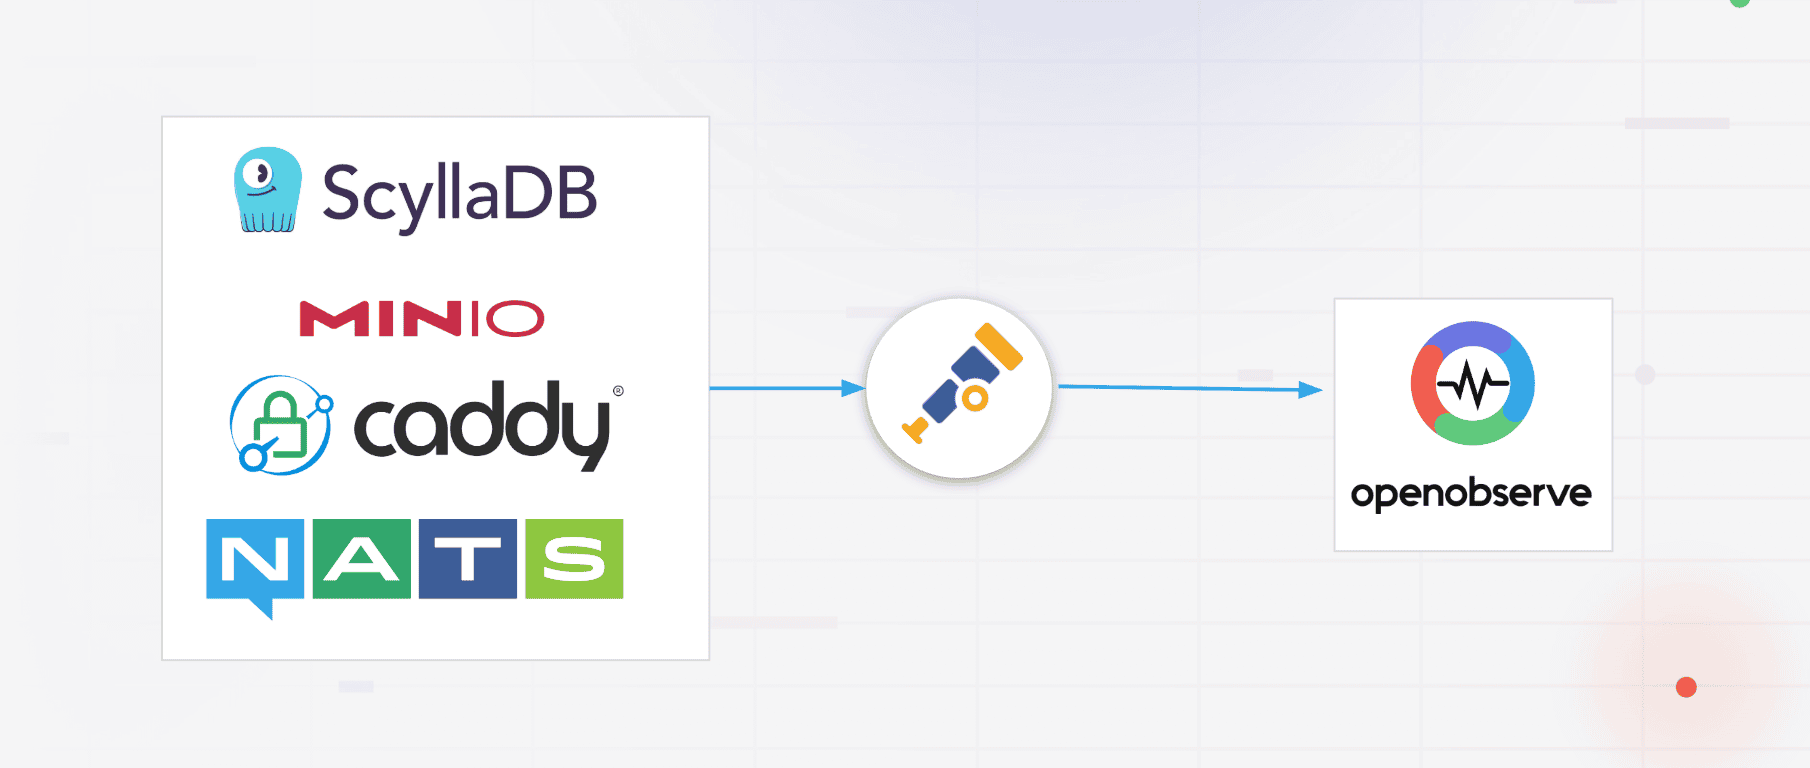
A walkthrough of dashboard JSON structure, query patterns, and integration architecture for Caddy, MinIO, NATS, and ScyllaDB.
DataDog vs OpenObserve APM comparison: $120/day LLM charge, SQL trace dashboards, OTel native, service dependency mapping, and 60-90% cost savings with real data.
DataDog vs OpenObserve metrics comparison: PromQL support, high-cardinality handling, custom metrics auto-generation, and 60-90% cost savings with real data.
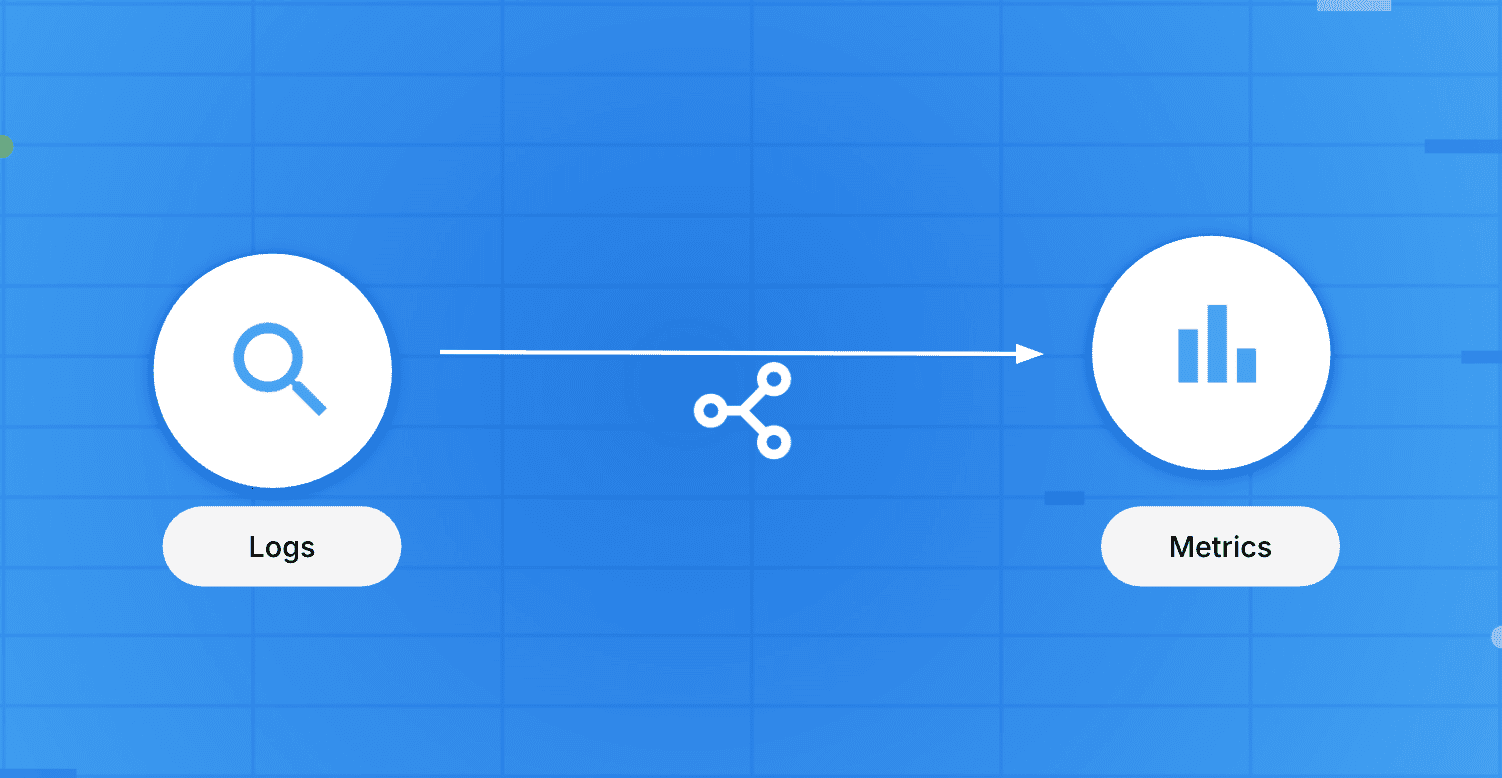
Learn how to convert raw logs into metrics using OpenObserve pipelines. Step-by-step guide to extract time-series metrics for faster dashboards and reliable alerts.
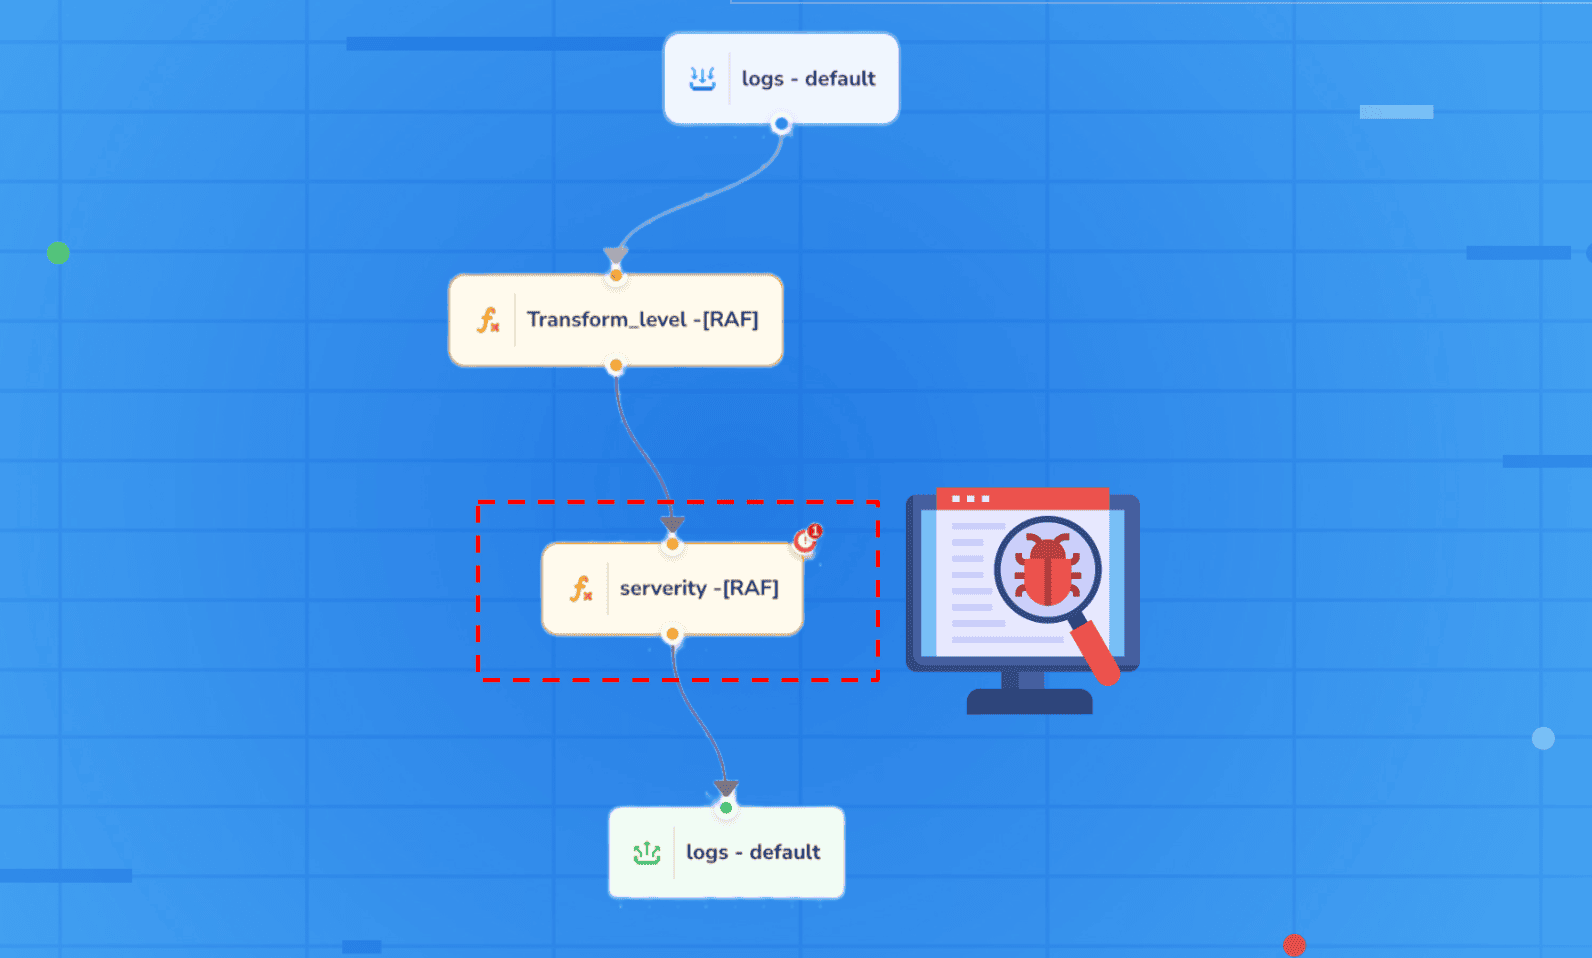
A step-by-step guide to debugging real-time observability pipelines in OpenObserve, covering log ingestion, pipeline errors, and troubleshooting.
Real-world comparison of DataDog and OpenObserve for log management. SQL queries, automatic field discovery, and 90% cost savings. Tested with OpenTelemetry.