DataDog vs OpenObserve Part 1: Logs Comparison




Ready to get started?
Try OpenObserve Cloud today for more efficient and performant observability.
DataDog vs OpenObserve: Part 1 - Logs - Automatic Field Discovery, SQL Queries, and 90% Cost Savings
This blog is first in the part of a series of blogs comparing the functionality of Datadog with that of OpenObserve for observability. Security use cases are outside the scope of comparison.
- Full comparison
- Part 1: Logs - Automatic Field Discovery, SQL Queries, and 90% Cost Savings
- Part 2: Metrics - Drag & Drop, SQL, PromQL, High Cardinality
- Part 3: Traces/APM - OTel Native, No Hidden Tiers
- Part 4: Dashboards- Prebuilt, Drag & Drop, Custom
- Part 5: Alerts, Monitors, Destinations
- Part 6: Real User Monitoring
- Part 7: Pipelines
- Part 8: IAM (SSO, RBAC)
- Part 9: Cost
Introduction
DataDog charges for indexed logs, per host, per retention tier. OpenObserve flips this model: predictable costs, SQL instead of proprietary syntax, automatic indexing instead of manual facets. Advance log management capabilities and upto 90% lower costs.
Beyond pricing, operational friction matters. Query languages, field indexing, transformation pipelines, and retention controls directly impact how quickly teams can diagnose production issues.
This hands-on comparison tests DataDog and OpenObserve as log management platforms, sending identical production-like logs data to both platforms simultaneously. The results show how these platforms handle log search, query languages, transformation pipelines, and cost structure with the same production-like data.
Evereve, a fashion retail company, achieved 90% cost savings migrating from DataDog to OpenObserve. They didn't sacrifice visibility but instead eliminated pricing complexity. Full instrumentation, longer retention, and accurate cost forecasting became possible.
TL;DR - Key Findings
- Cost Reality: Teams are reducing their total cost of observability by 60-90% moving from DataDog to OpenObserve without sacrificing visibility
- Query Language: DataDog uses proprietary syntax. OpenObserve uses SQL, which means your team already knows how to write queries.
- Log Patterns: Both platforms auto-group similar logs. Feature parity here.
- Pipelines: DataDog requires configuration files with a 20-processor limit. OpenObserve offers a visual pipeline editor with 100+ built-in VRL functions plus query-time transforms.
- Query Recommendations: OpenObserve analyzes your log queries and suggests which fields to index for faster performance. DataDog only offers this for database queries, not logs.
- Sensitive Data Redaction: Both platforms protect PII. DataDog has 90+ out-of-the-box rules. OpenObserve provides 140+ built-in patterns with ingestion-time and query-time redaction.
- Retention: DataDog's default 15-day log retention is locked and requires customer success approval for changes. OpenObserve gives you per-stream control with object storage for long-term retention.
- Migration: Straightforward with OpenTelemetry instrumentation
What We Tested
We created a realistic observability test using the OpenTelemetry Demo application, a realistic microservices application with 16 services spanning seven programming languages (Go, C++, .NET, Java, JavaScript, Python, PHP, Rust). To make it production-realistic, we extended it with: Kafka message queues, PostgreSQL database, Valkey cache, and an LLM service for AI-powered features.
Our dataset (published at github.com/openobserve/opentelemetry-demo-dataset):
All services were instrumented with OpenTelemetry SDKs sending logs, metrics, and traces to the OTel Collector, which then exported to both DataDog and OpenObserve simultaneously. Same data, same timestamps, same volumes. The only variable was the platform processing and storing the logs.
Log Search and Field Discovery
When investigating an issue, you need to find relevant logs quickly. Field discovery, query flexibility, and retention control shape how fast you troubleshoot.
DataDog displayed logs immediately, but only showed preset facets for filtering like service, status, and host.
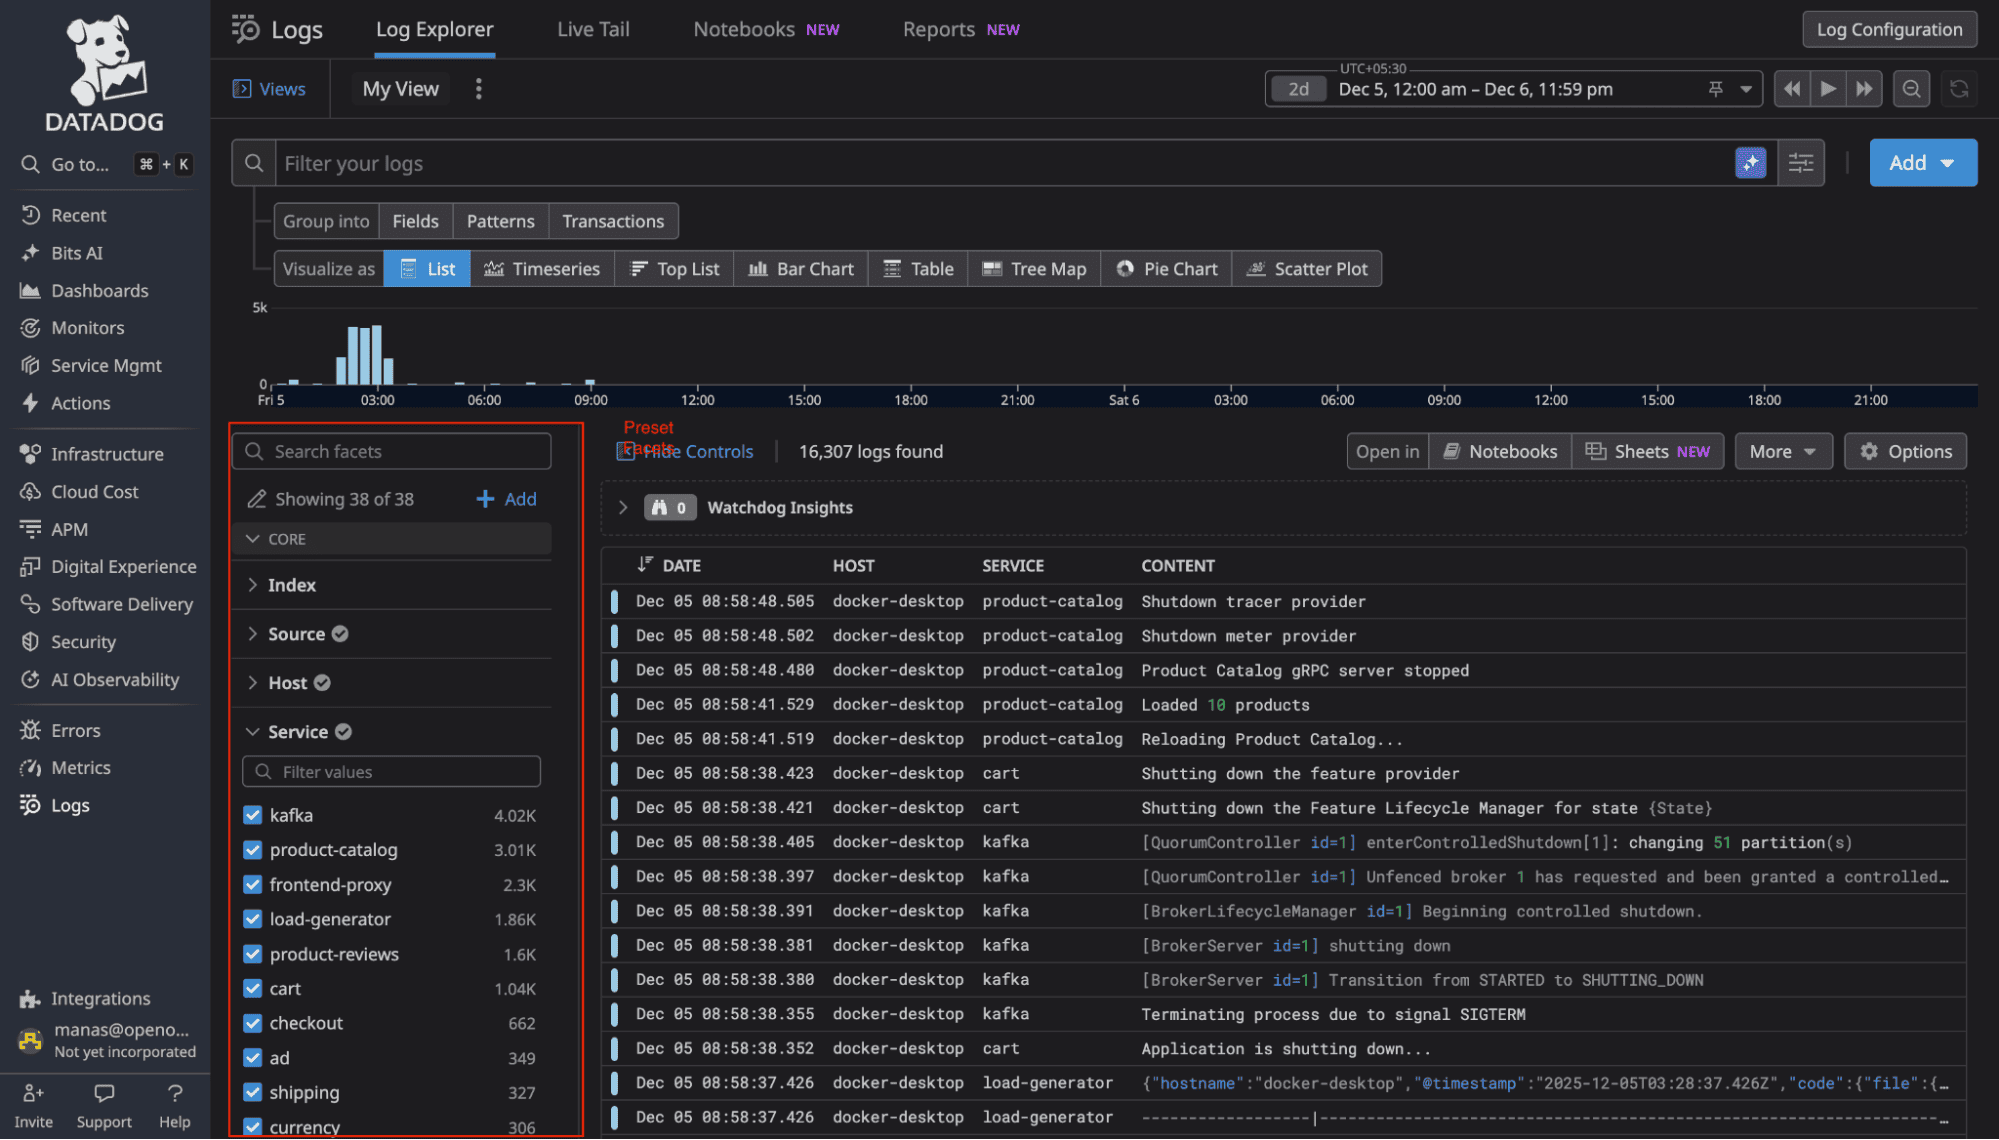
Our logs contained 114 fields. To filter byproduct_id or user_id, we first had to create facets manually through configuration. Every new field in your logs requires manual UI work before you can have it as a facet in the sidebar.
Source: DataDog's facet documentation at https://docs.datadoghq.com/logs/explorer/facets_groups/
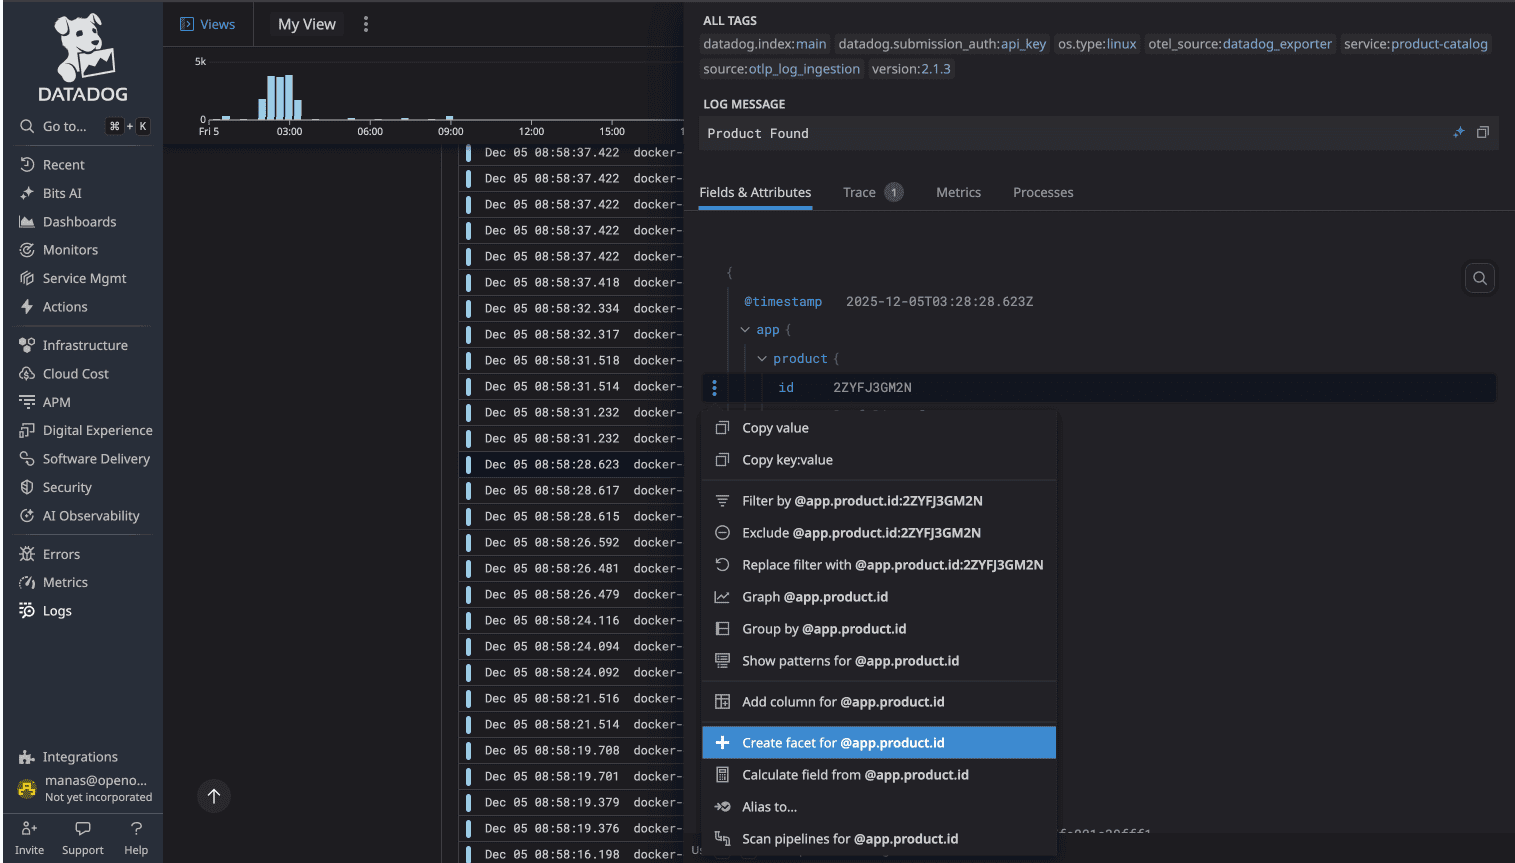
OpenObserve automatically indexes all fields. The moment logs hit OpenObserve, every JSON field is parsed, indexed, and searchable. No manual configuration. No facet creation. You can immediately filter on any field, aggregate by any dimension, or build queries using any log attribute.
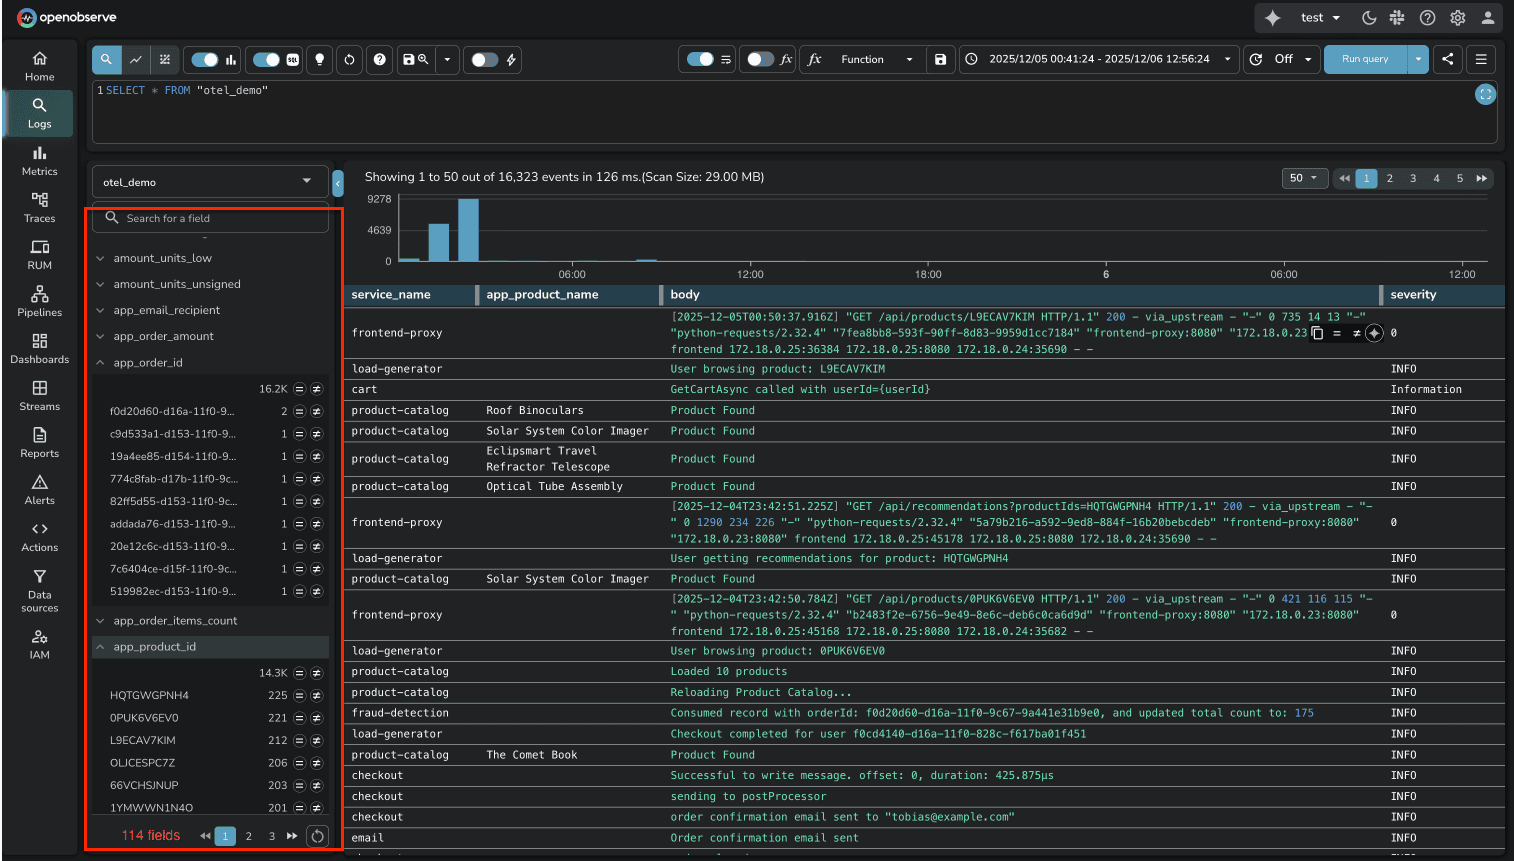
For platform teams managing hundreds of microservices, this difference is substantial. DataDog's manual facet approach creates operational friction every time you deploy a new service or add new log fields. OpenObserve removes that friction entirely.
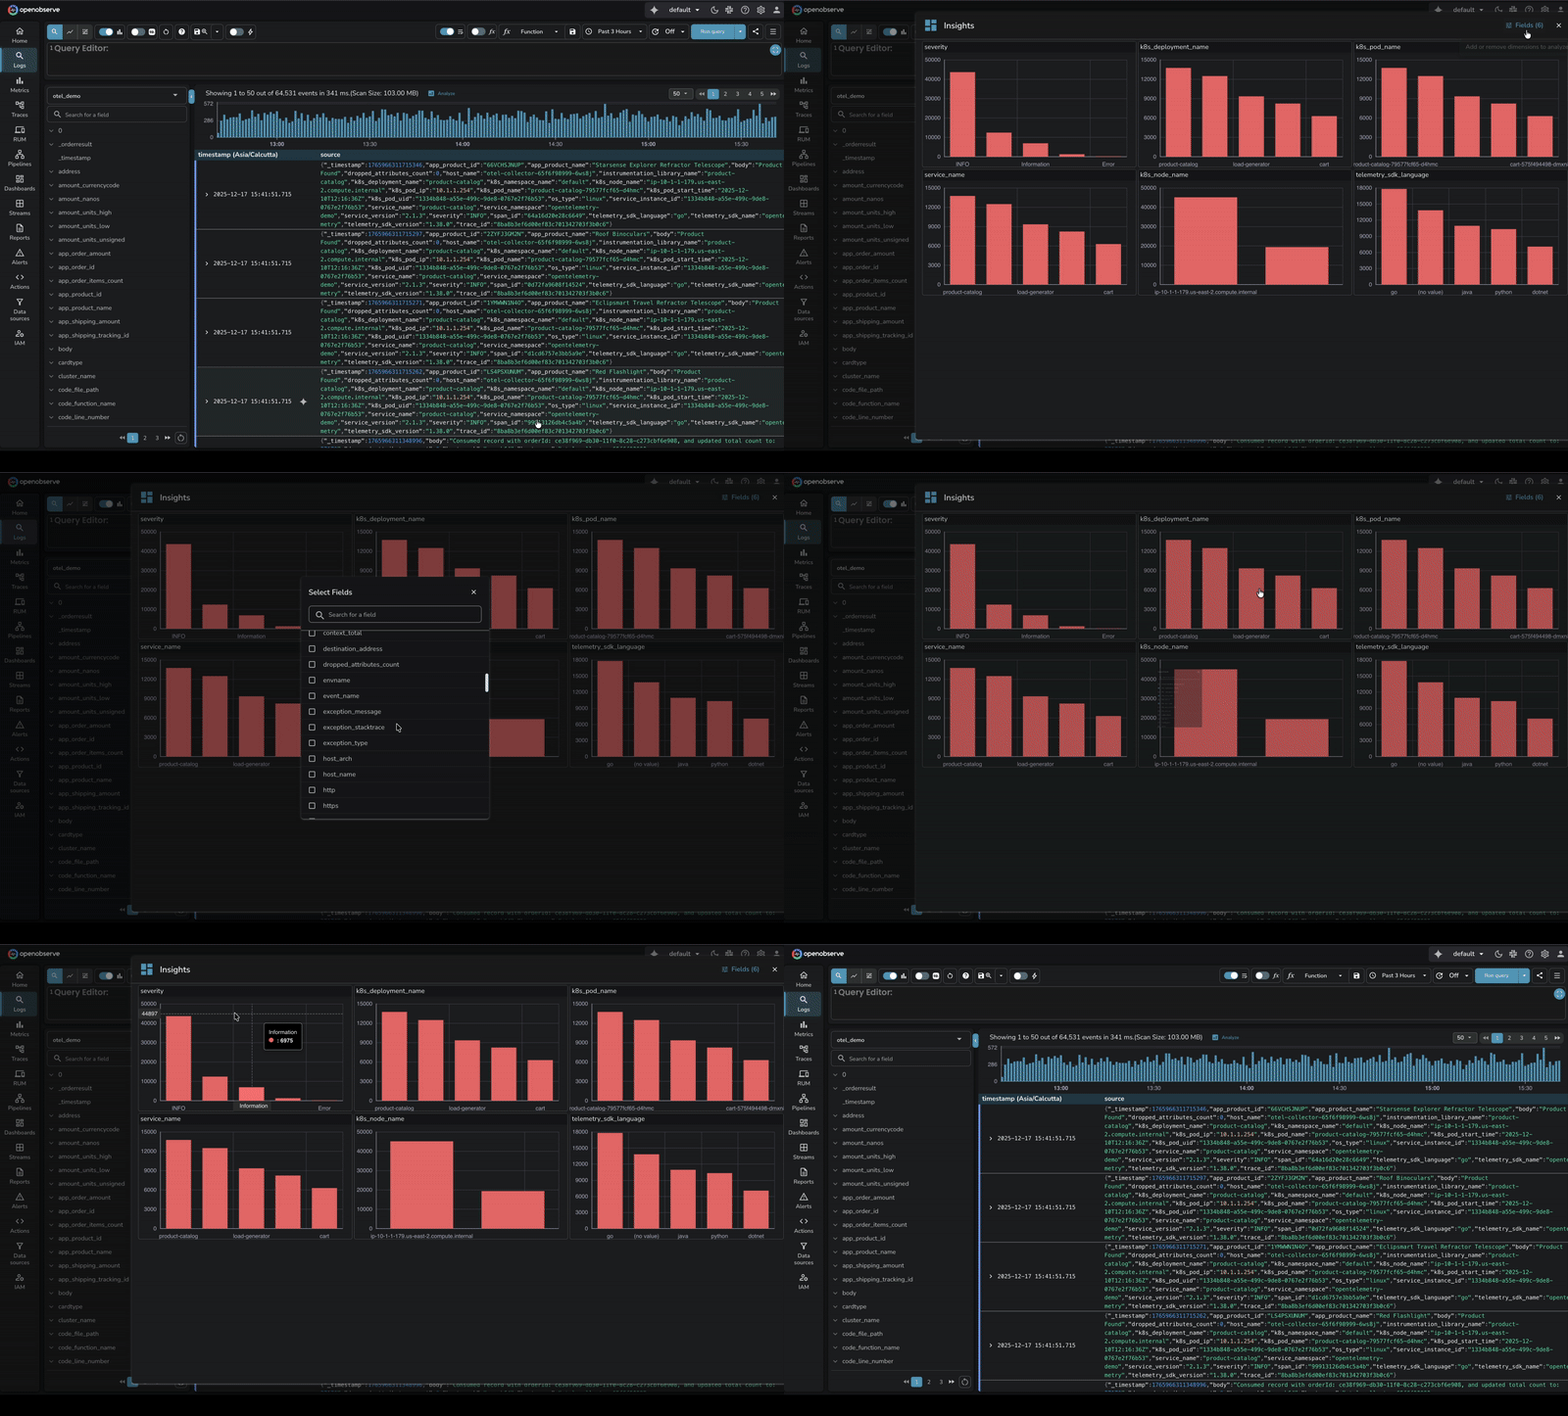
Volume Analysis in OpenObserve takes this a step further. Beyond making fields searchable, OpenObserve provides a dedicated Analyze feature that shows how log volume is distributed across dimensions (service names, regions, clusters, log levels, etc.).
When managing dozens of microservices and applications, this interactive analysis answers critical questions: Which service is generating the most logs? Has traffic shifted from one region to another? Are certain log levels spiking unexpectedly?
The feature displays top values per dimension with comparison capabilities across time periods, helping teams quickly understand data distribution patterns without writing complex aggregation queries.
Query Languages: Proprietary vs SQL
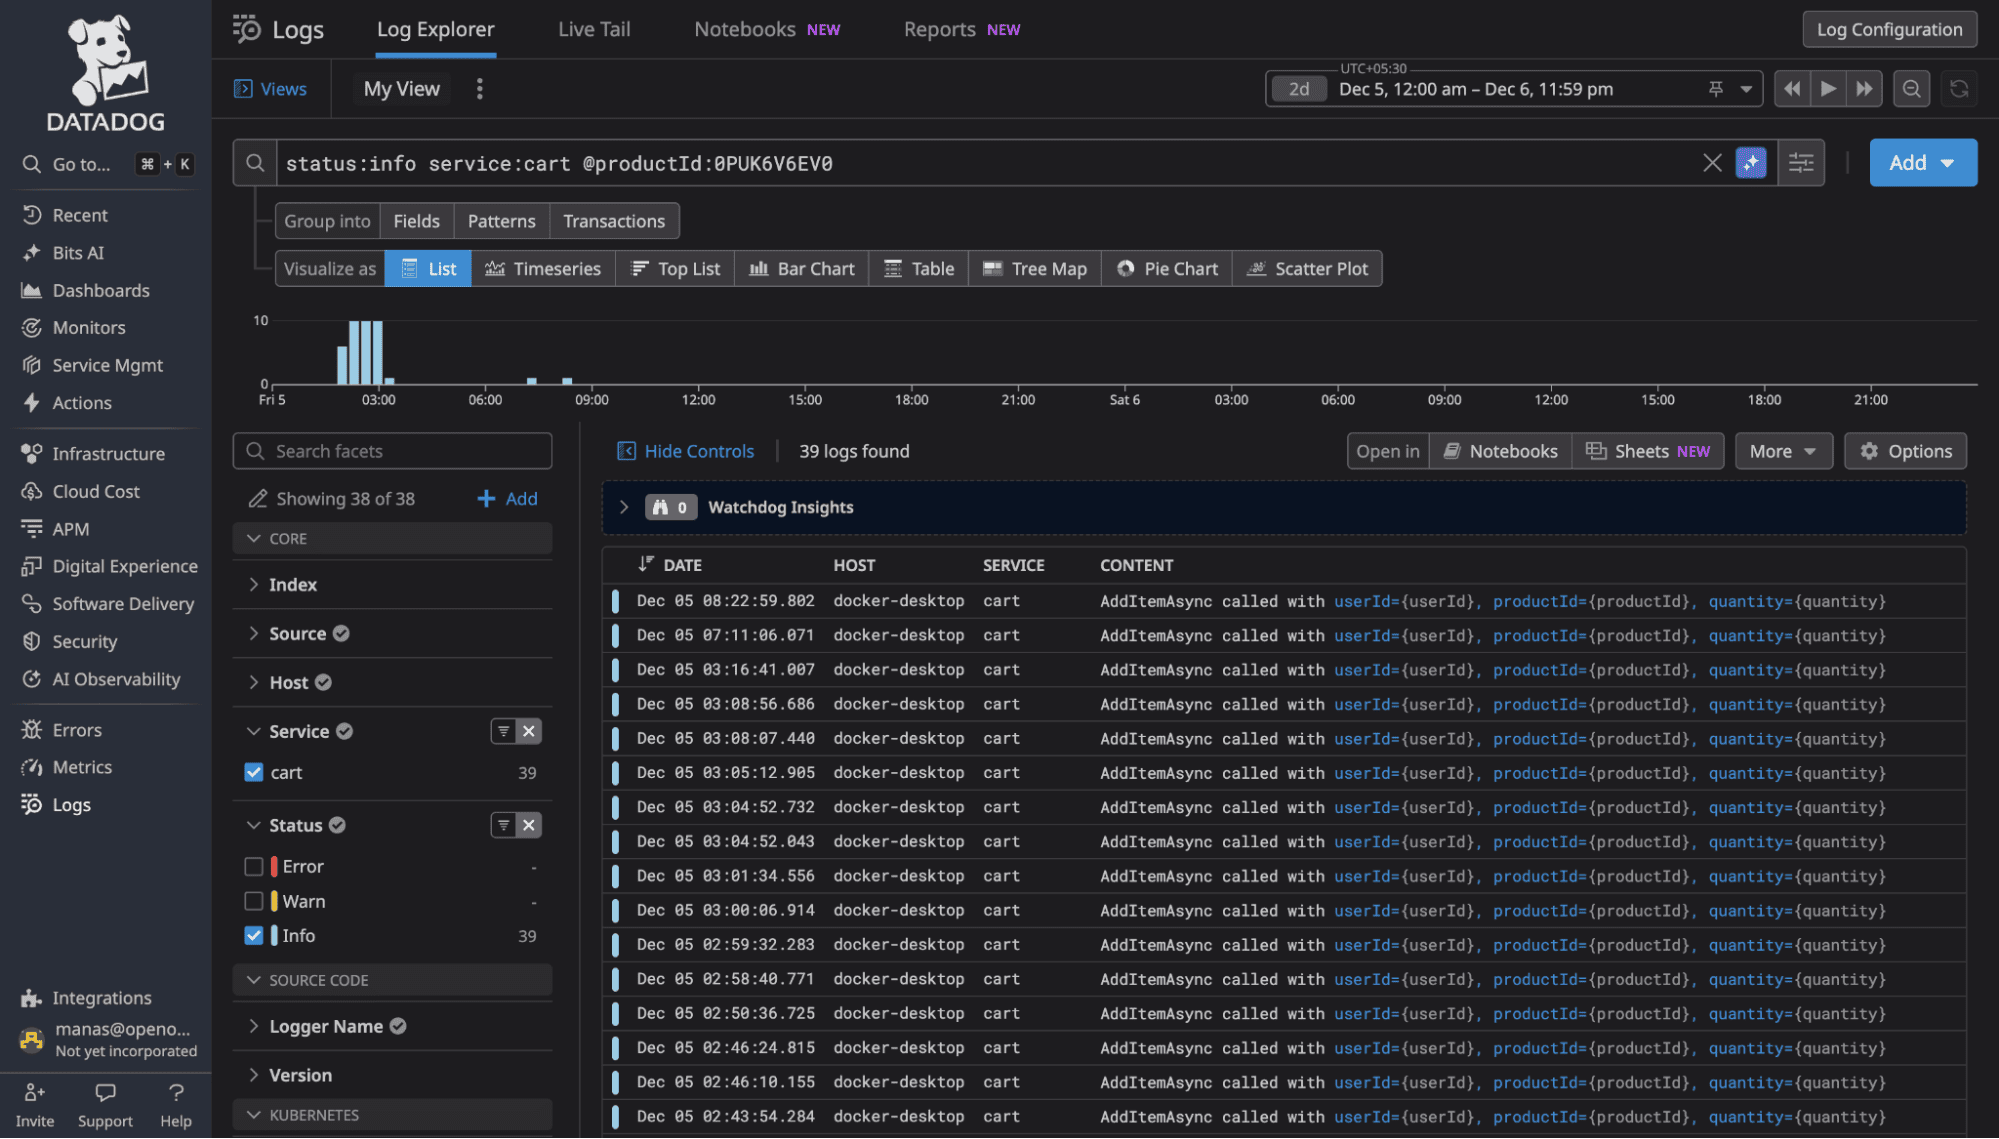
DataDog uses proprietary query syntax. To search logs, you learn DataDog's specific query language with its own operators, wildcards, and syntax rules. It's not terrible, but it's unique to DataDog. Your SQL knowledge doesn't transfer. Your team's existing query skills don't apply.
Source: DataDog Log Search Syntax at https://docs.datadoghq.com/logs/explorer/search_syntax/
OpenObserve uses SQL. The same query in OpenObserve:
SELECT * FROM logs WHERE status='warn' AND service='cart' AND product_id='0PUK6V6EV0'
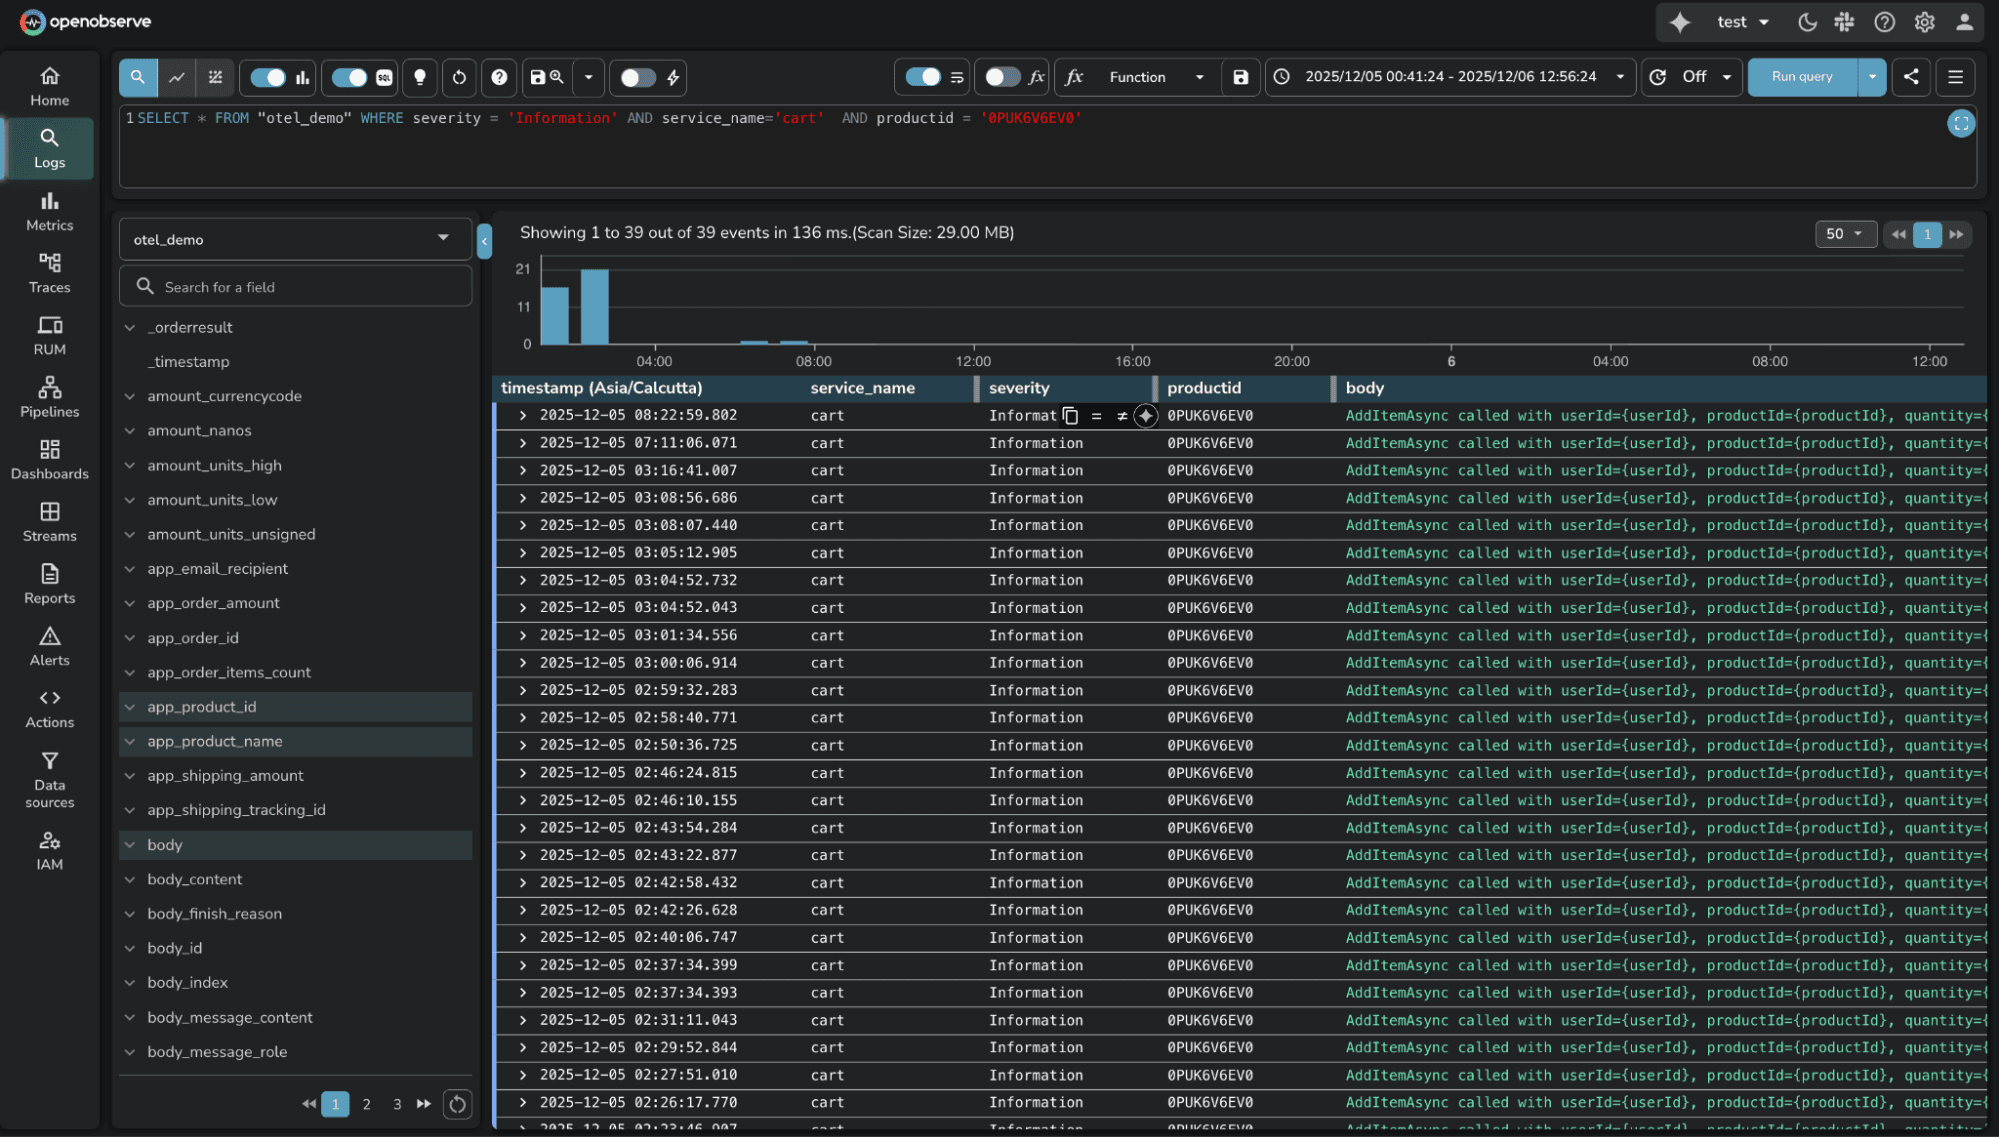
The SQL approach has three advantages:
- No Learning Curve: Your team already knows SQL. No proprietary syntax to memorize.
- Complex Queries: SQL's full power for joins, subqueries, window functions, CTEs when needed.
- Transferable Skills: Query knowledge works across your entire data infrastructure, not just logs.
For one-off log searches, the proprietary syntax is manageable. For building complex log analytics, aggregations, or correlation queries, SQL's familiarity and expressiveness matter.
Log Patterns: Feature Parity
Both platforms automatically group similar logs into patterns, which is useful for identifying recurring issues without manually sifting through thousands of individual log lines.
DataDog Log Patterns cluster logs with similar structure, replacing variable parts with wildcards. You see how frequently each pattern occurs and can click into specific instances.
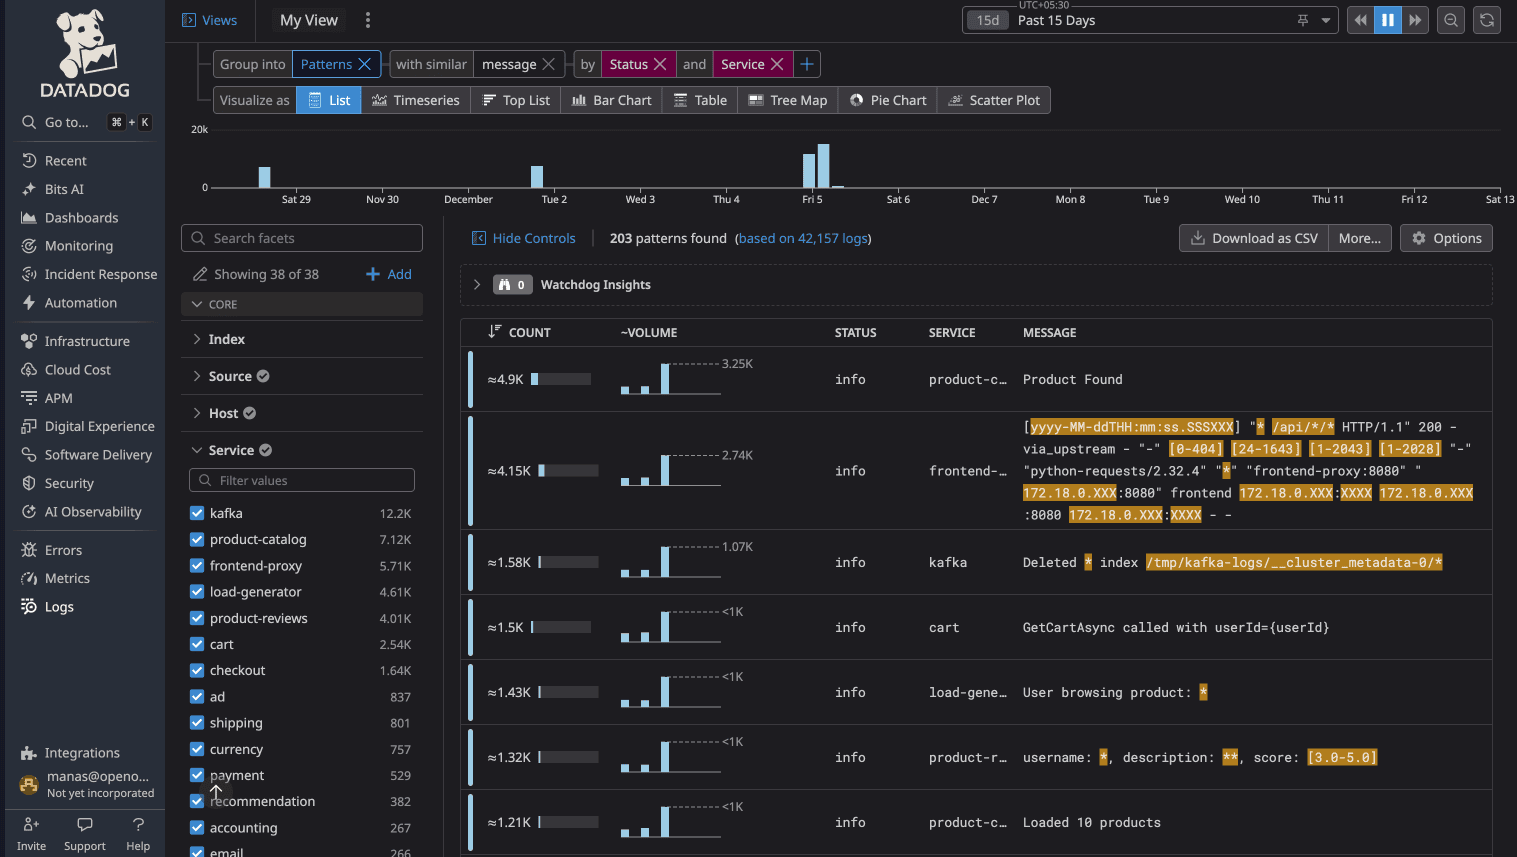
OpenObserve Log Patterns work the same way, auto-detecting recurring log structures and grouping them. The implementation is comparable. Both platforms deliver value here.
Available in Enterprise Edition and OpenObserve Cloud.
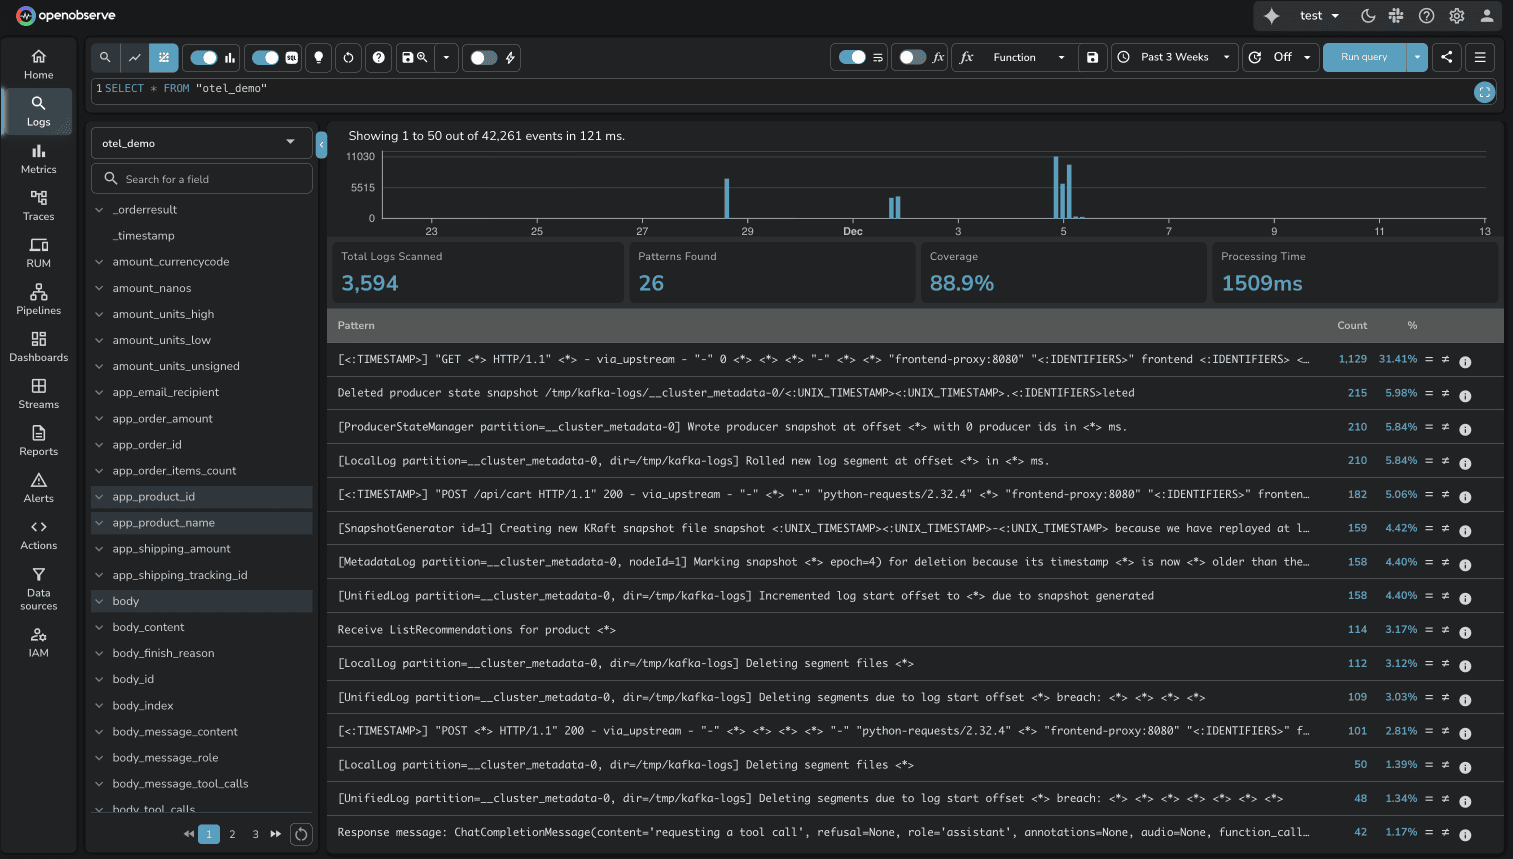
This is one area where neither platform has a clear advantage. Both solve the "noisy logs" problem effectively.
Sharing Log Views
Available in OSS and Enterprise Edition.
DataDog requires creating a "Saved View" before sharing a log query. The saved view creates a short-link that encodes your query parameters.
Source: DataDog Saved Views Documentation
OpenObserve has an instant share button. Whatever query you're viewing, click share and it works immediately.

During an incident, removing friction matters.
Pipelines: Visual Workflows vs Configuration
Log pipelines transform raw log data into structured, enriched information. Both platforms support pipelines, but the approach and power differ significantly.
DataDog Pipelines: Configuration-Based
DataDog pipelines are configured through UI forms where you define processors like Grok Parser, Date Remapper, and Status Remapper. You navigate to Pipelines, click "Add Processor," and configure transformation rules. The configuration exists as a list of processors, but there's no visual representation of the data flow.
Source: DataDog Pipelines, DataDog Processors
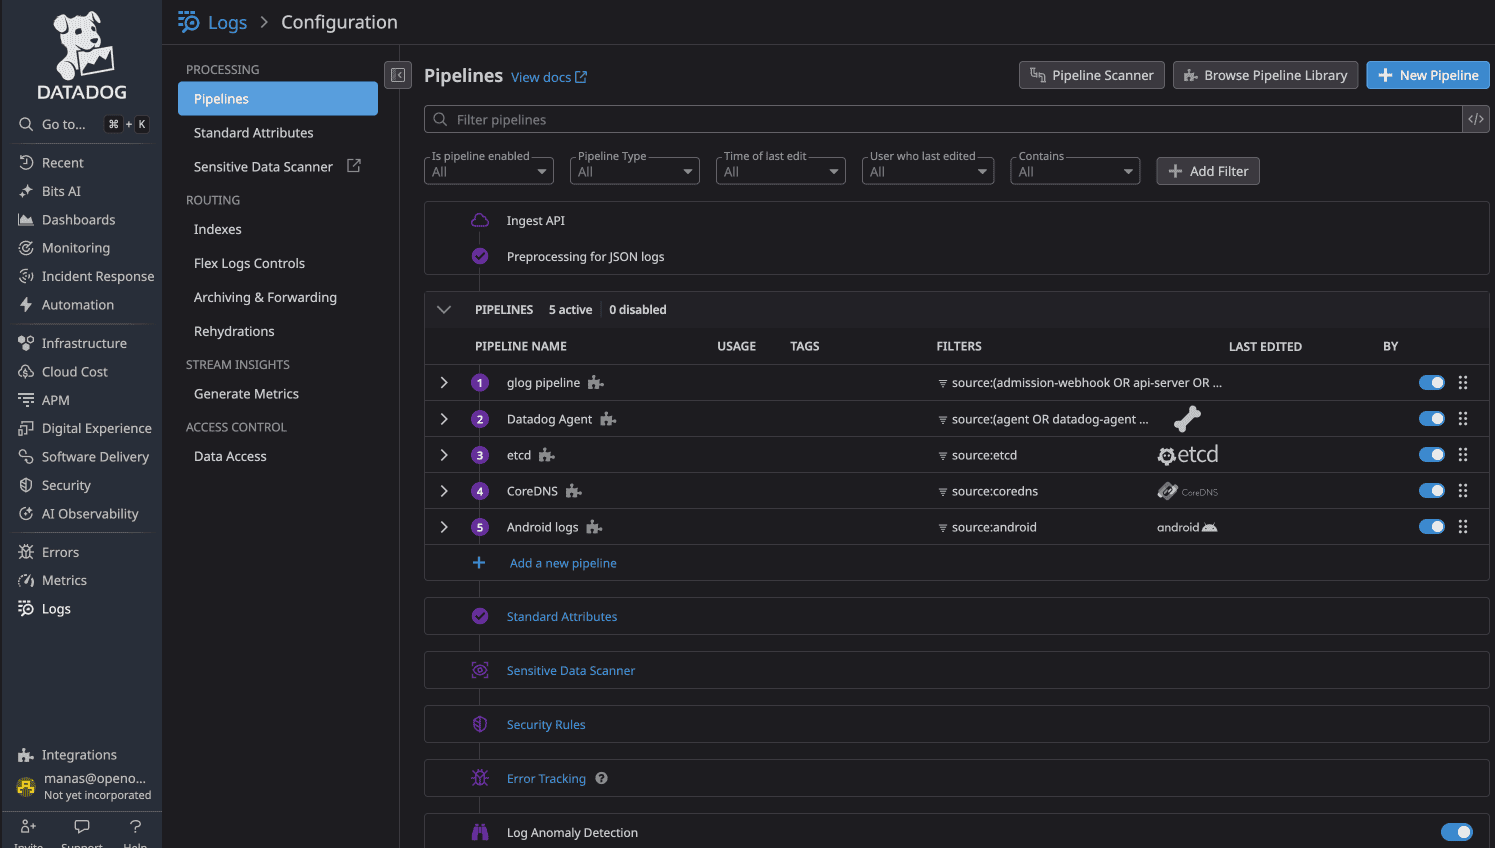
DataDog recommends using at most 20 processors per pipeline. Each processor requires manual configuration, and understanding the full pipeline flow means reading through processor definitions.
OpenObserve Pipelines: Visual + Powerful
Available in OSS and Enterprise Edition.
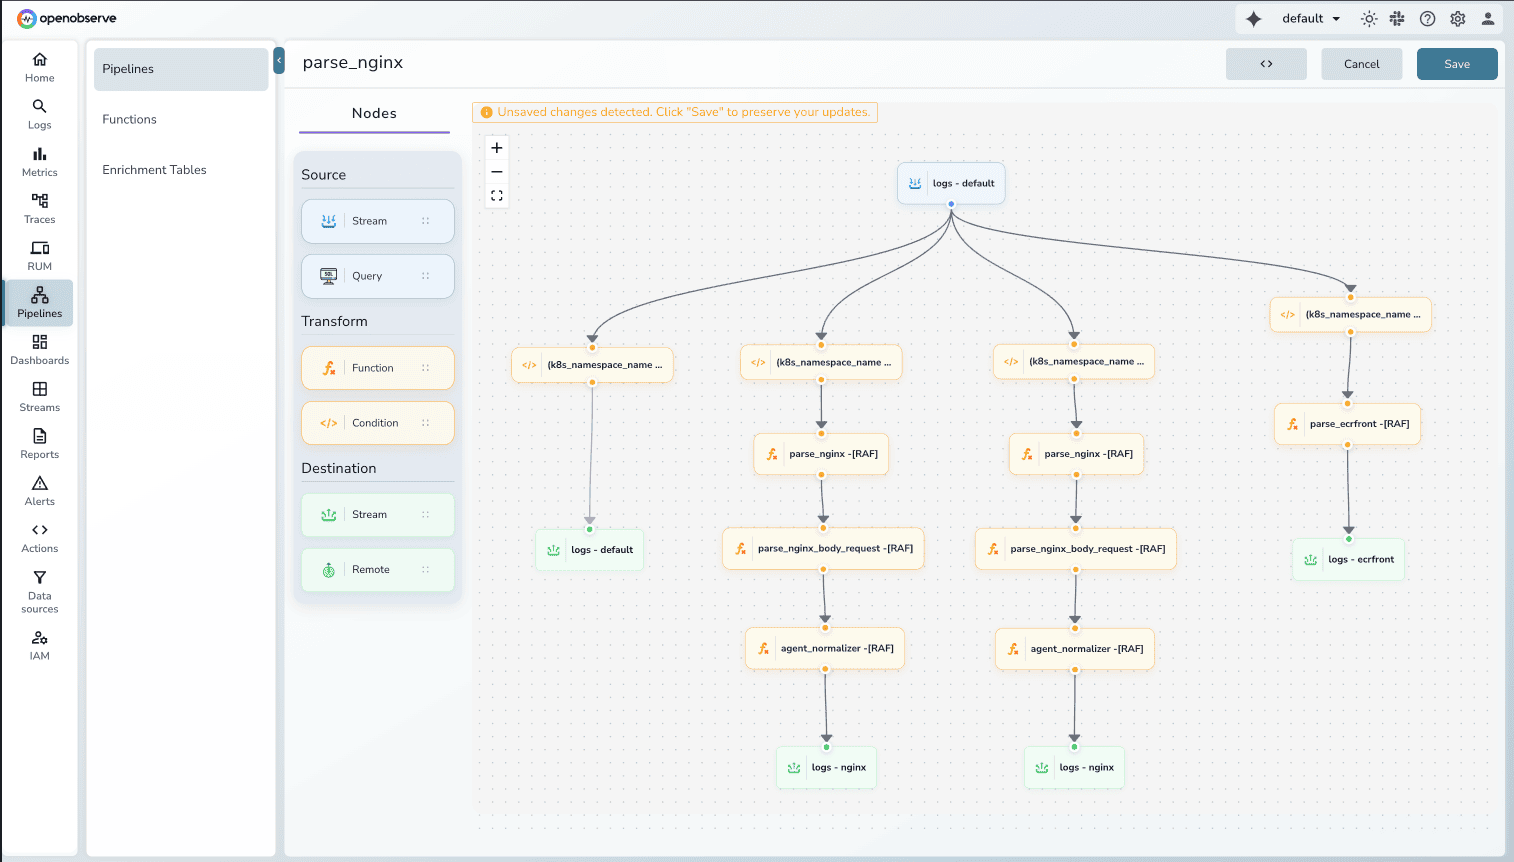
OpenObserve pipelines provide a visual canvas where you see the actual data flow: source nodes, transformation nodes, and destination nodes connected with lines showing routing logic.
Key advantages:
Visual Pipeline Editor: See your entire data flow at a glance. Drag-and-drop nodes to build complex routing logic. Understand transformations visually instead of parsing configuration files.
Ready-to-Use VRL Functions: OpenObserve uses Vector Remap Language (VRL) with built-in functions for common scenarios:
parse_nginx_log()for NGINX access logsparse_syslog()for syslog formatsparse_json(),parse_csv(),parse_regex()for structured data- Plus 100+ functions for string manipulation, IP parsing, encoding, and more
Source: VRL Functions Reference
Multiple Destinations: Route transformed data to multiple destinations within OpenObserve (different streams) or external systems (S3, Kafka, other observability platforms).
Conditional Routing: Apply conditions on existing log fields to route data dynamically. Send errors to one stream, warnings to another, debug logs to short-term storage.
Both platforms handle log transformations, but OpenObserve's visual pipeline editor makes complex workflows easier to build, understand, and maintain.
Plus, OpenObserve supports query-time transforms. You can transform logs during queries without modifying the ingestion pipeline, which is useful for ad-hoc analysis or testing transformation logic before applying it permanently.
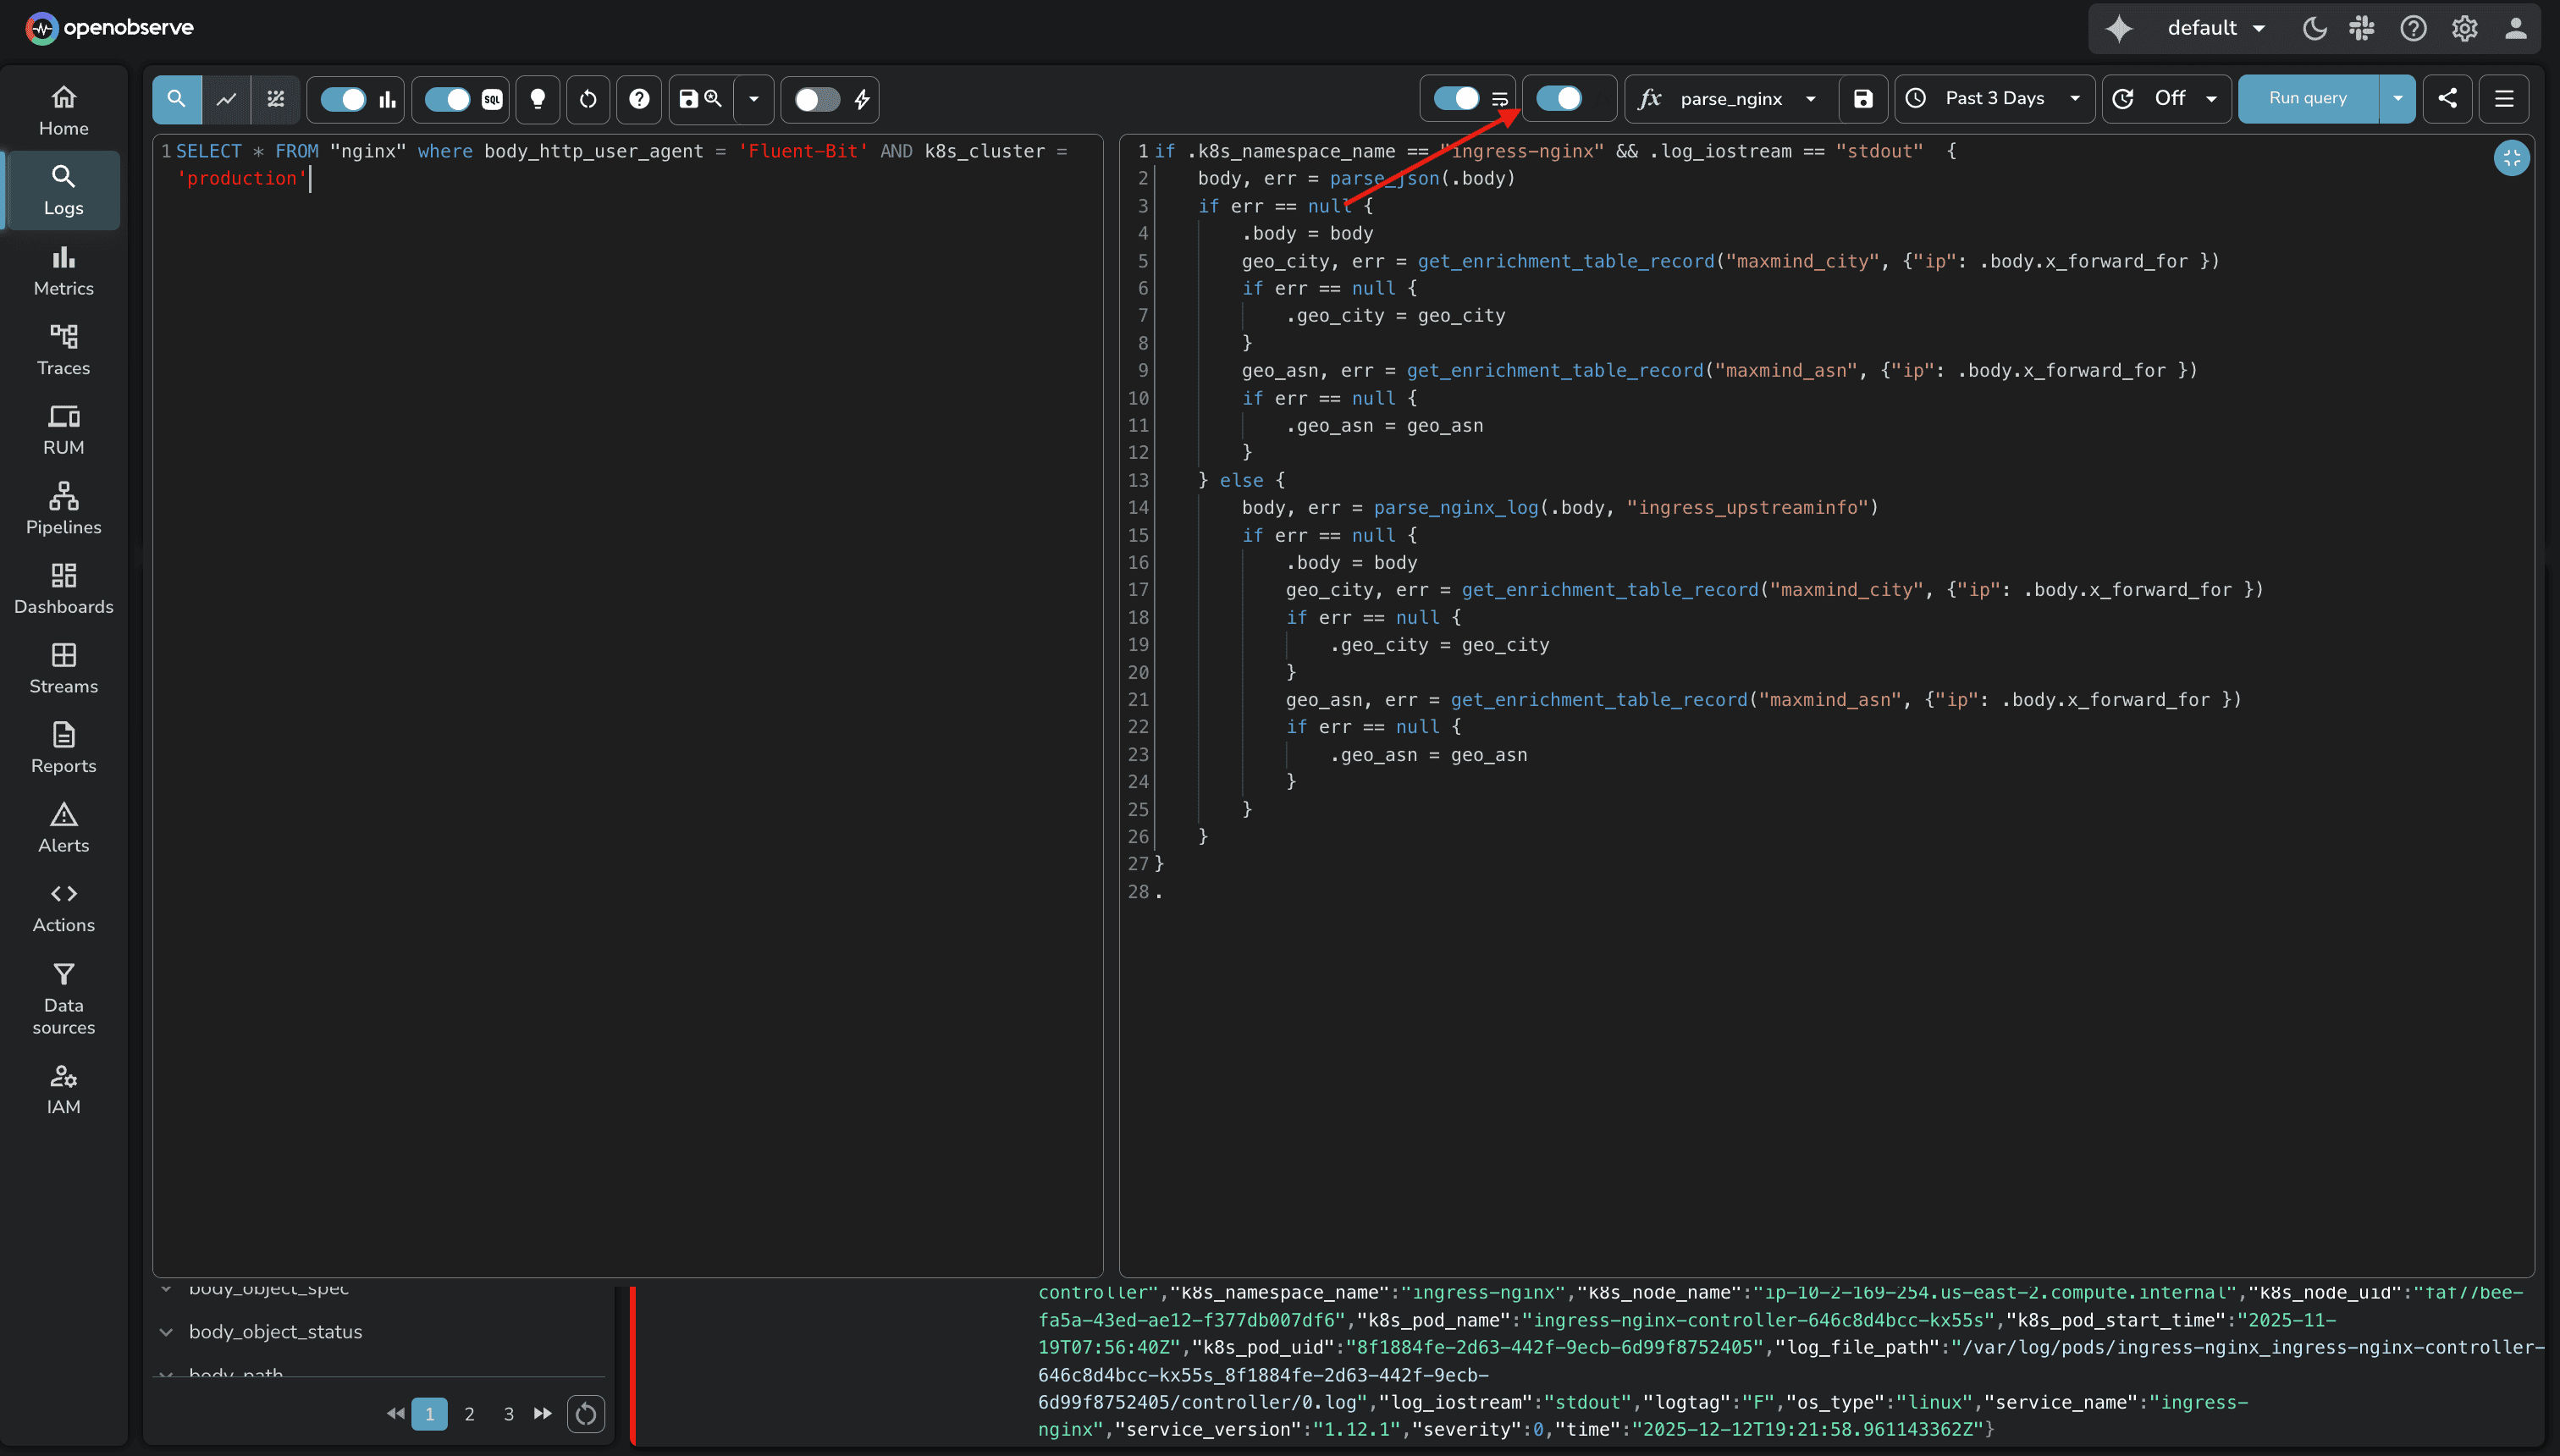
The visual approach reduces the cognitive load of managing transformation logic, especially as your pipeline grows.
Sensitive Data Redaction: Protecting PII
Protecting sensitive data in observability pipelines isn't optional. Both platforms provide capabilities, but the scope and deployment options differ.
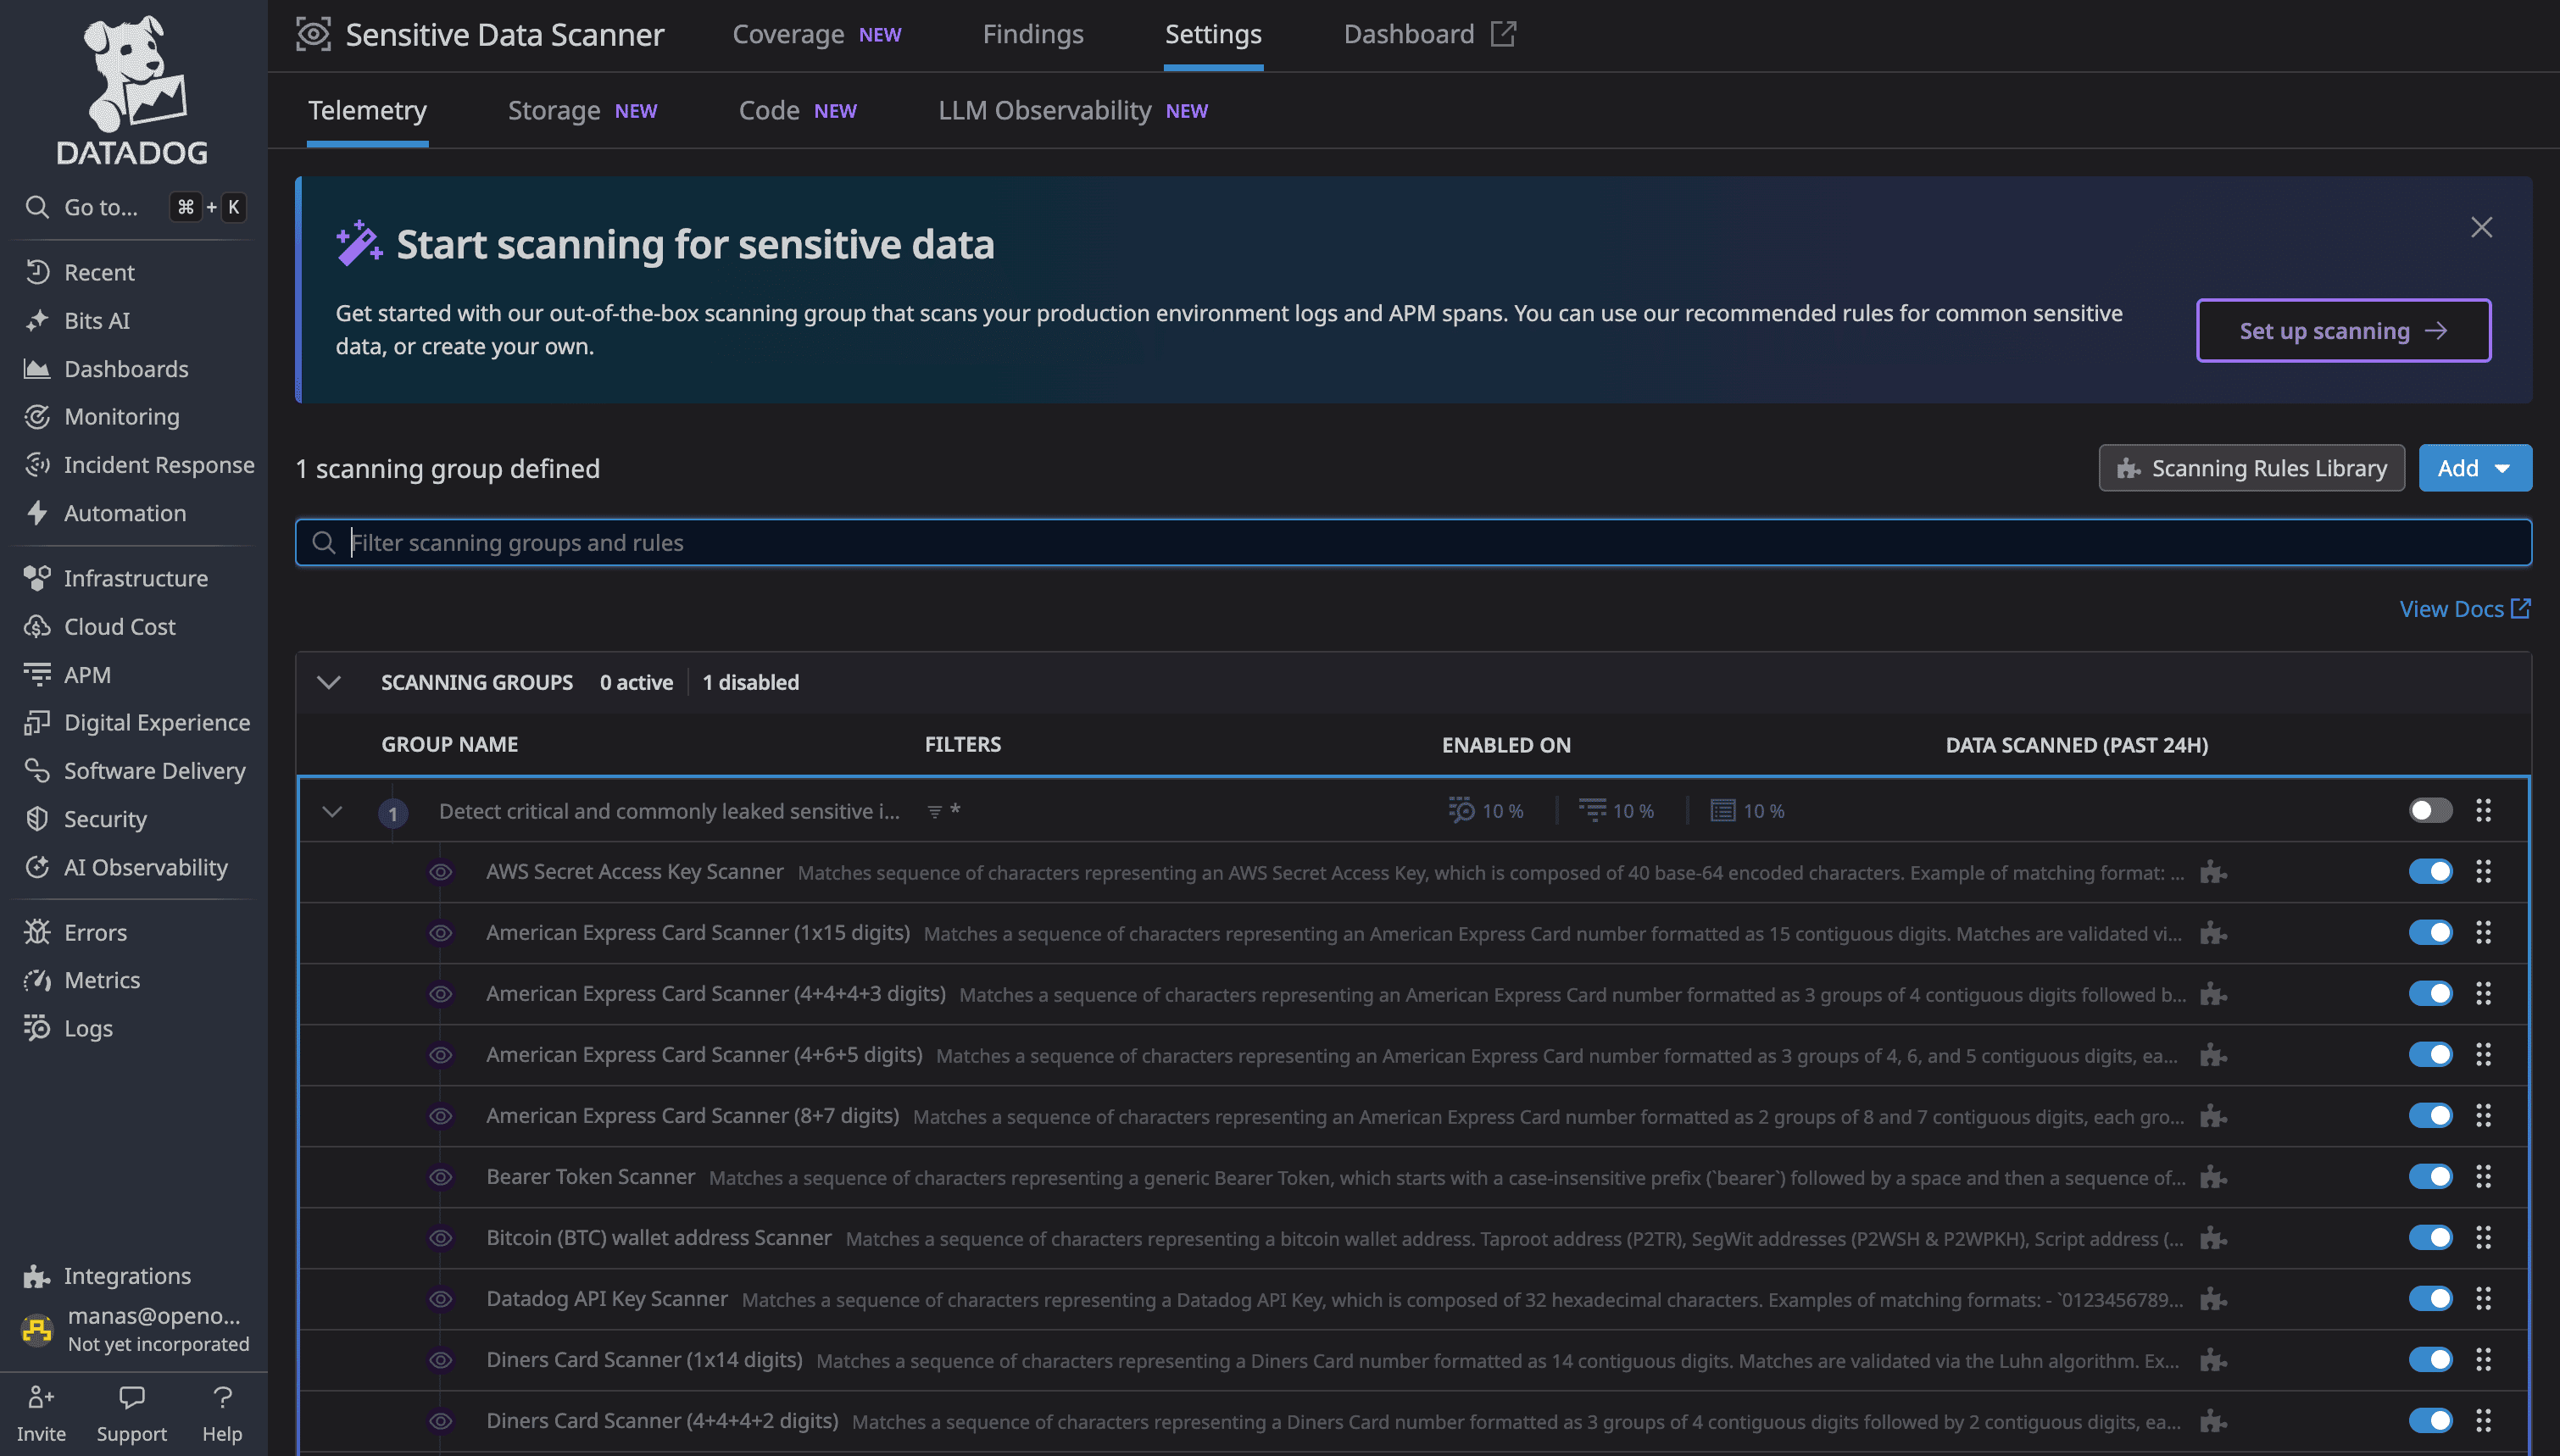
DataDog's Sensitive Data Scanner provides 90+ out-of-the-box scanning rules for common PII patterns (credit cards, SSNs, API keys, etc.). You can create custom regex patterns and choose from four actions: redact (mask with *), hash, partially redact, or tag without redacting. Scanning runs at ingestion time.
OpenObserve Sensitive Data Redaction
This feature is available in Enterprise Edition and OpenObserve Cloud.
OpenObserve's Sensitive Data Redaction (SDR) is a native feature that identifies and protects sensitive data automatically at ingestion or query time.
How it works:
Pattern Matching: SDR inspects data for patterns matching defined regular expressions (regex)
Flexible Actions: Once matched, apply user-defined actions:
- Redact: Replace with placeholder token
- Hash: Convert to non-reversible identifier
- Drop: Completely remove the field or log
Built-in Pattern Library: 140+ built-in patterns for popular PII formats like credit cards, SSNs, email addresses, phone numbers, API keys, and more.
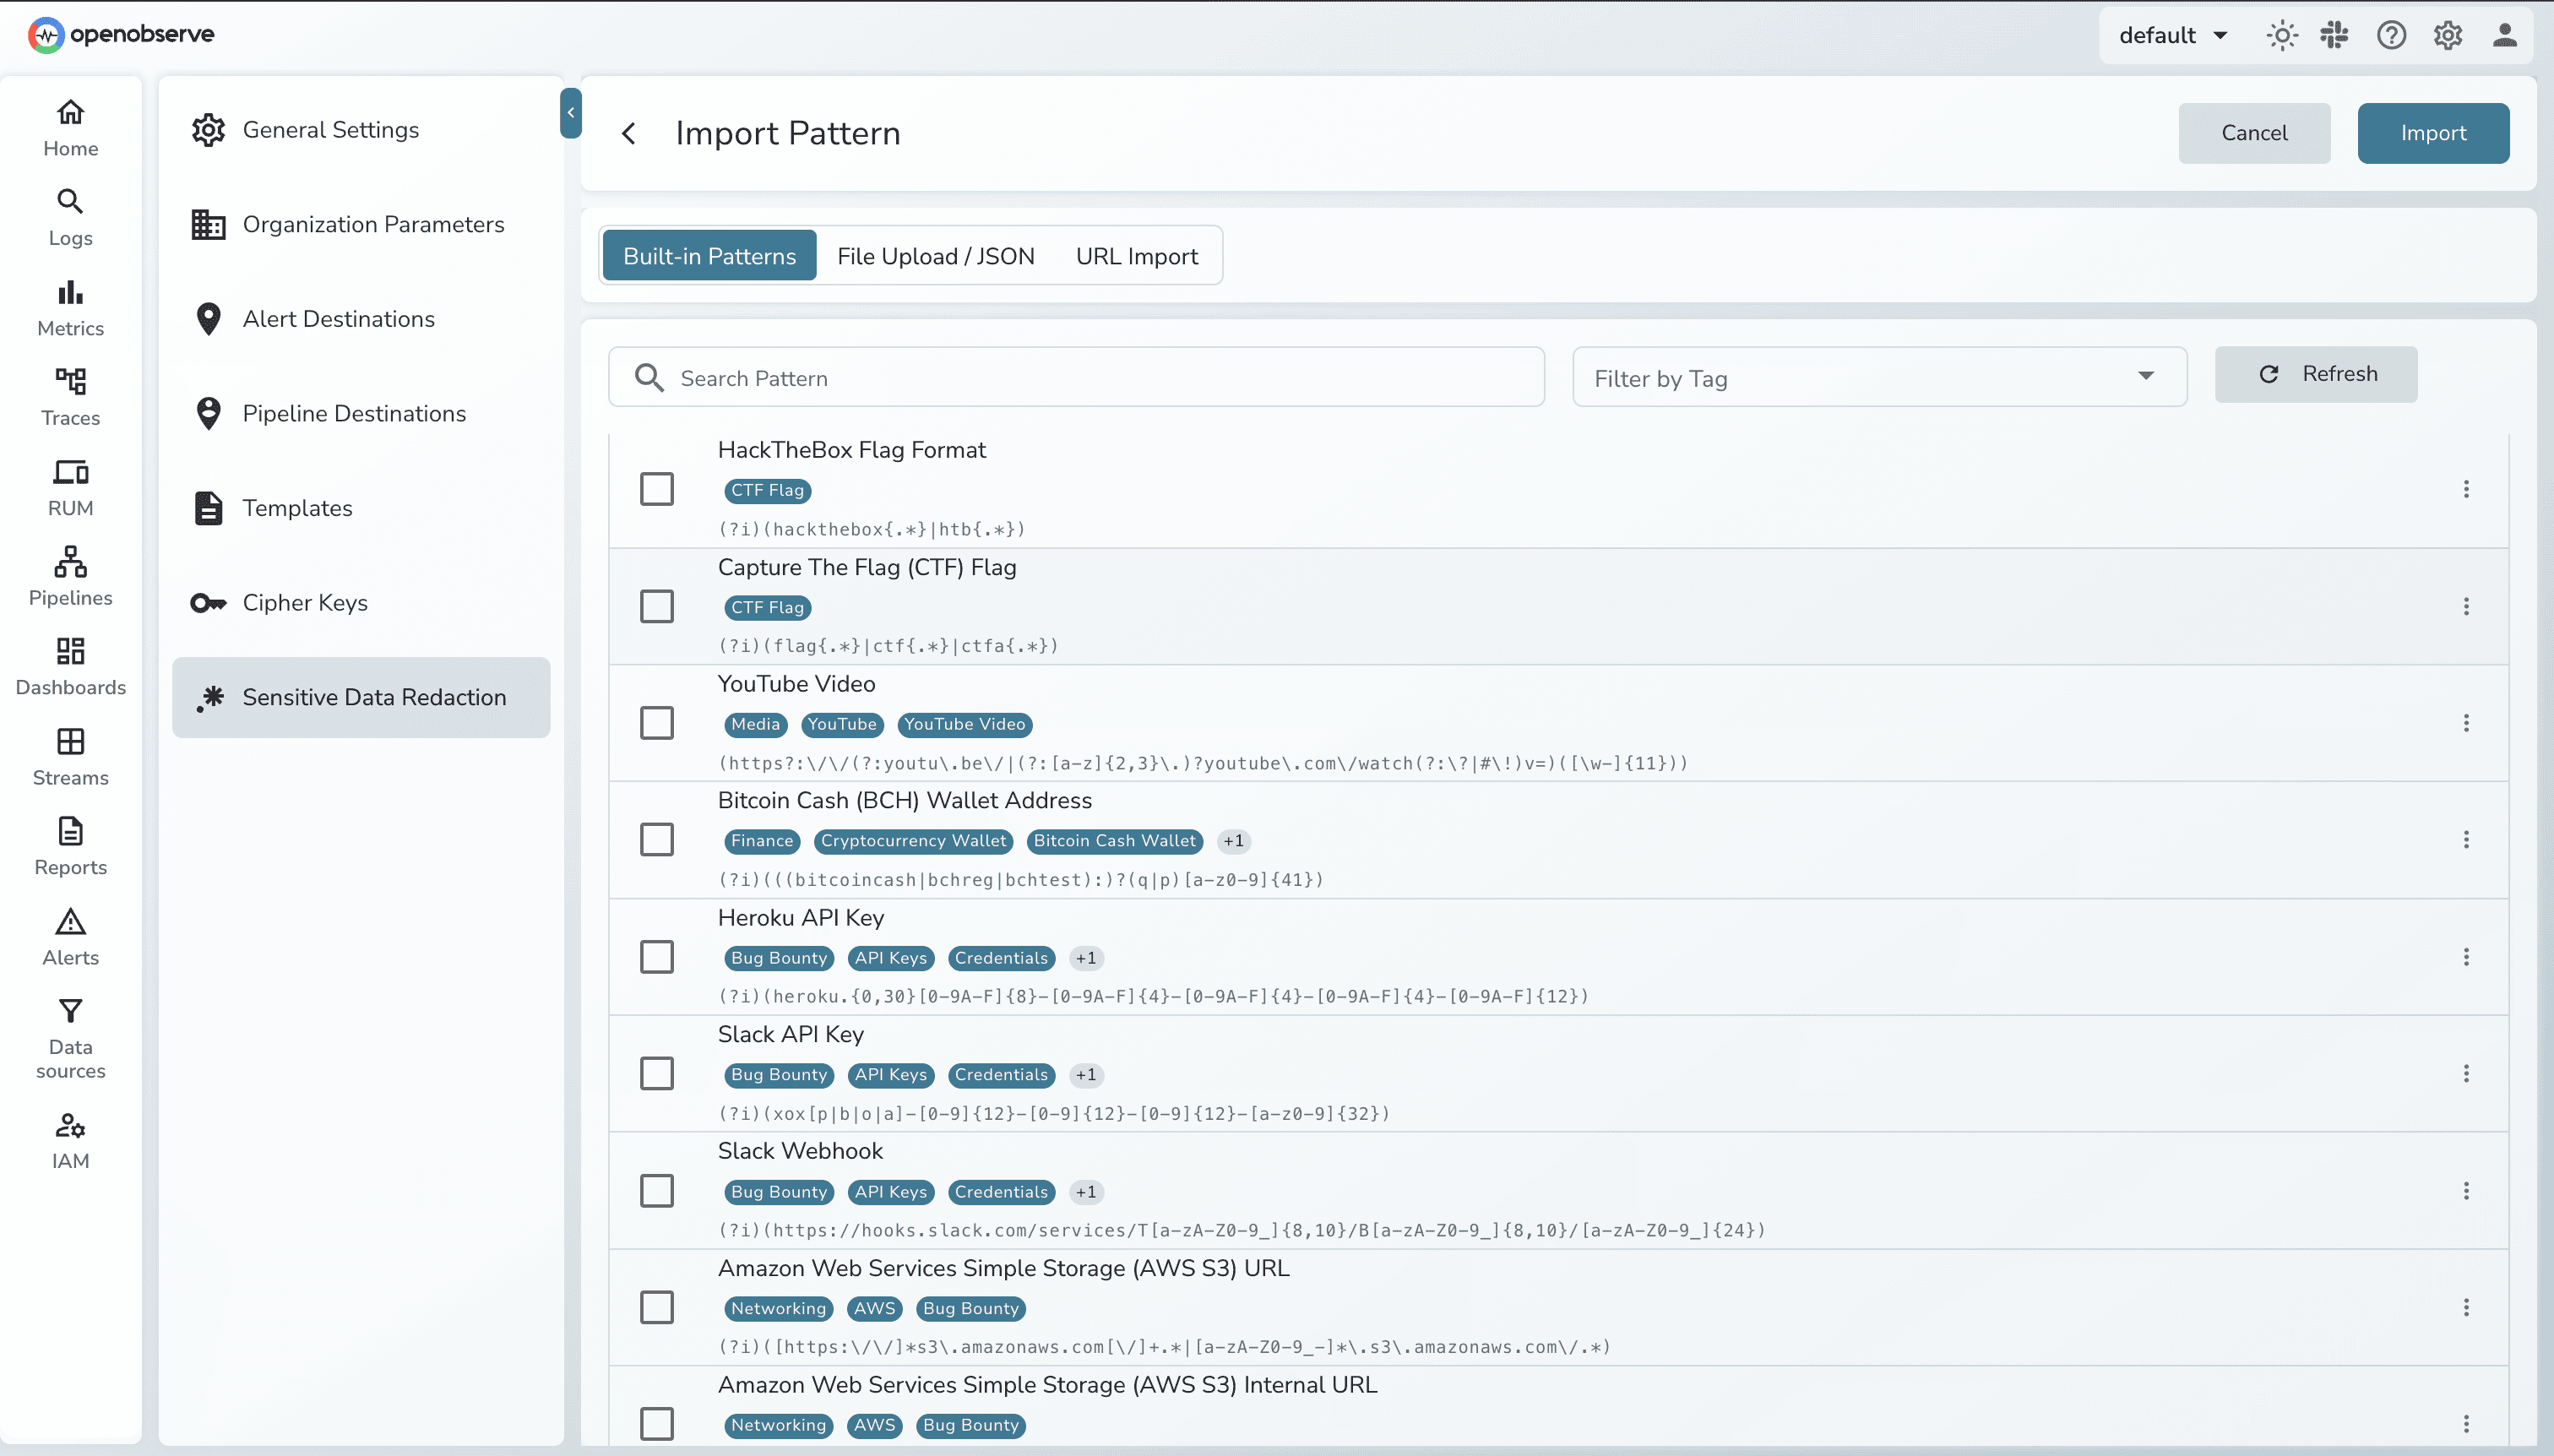
Key advantage: SDR works at ingestion time (data never stored unredacted) or query time (data stored but redacted on display). You choose the security model that fits your compliance requirements.
Both platforms handle sensitive data protection effectively. DataDog offers more deployment options (cloud vs on-prem), while OpenObserve provides native integration with flexible timing (ingestion vs query).
Query Recommendations: OpenObserve's Advantage
This feature is available in Enterprise Edition.
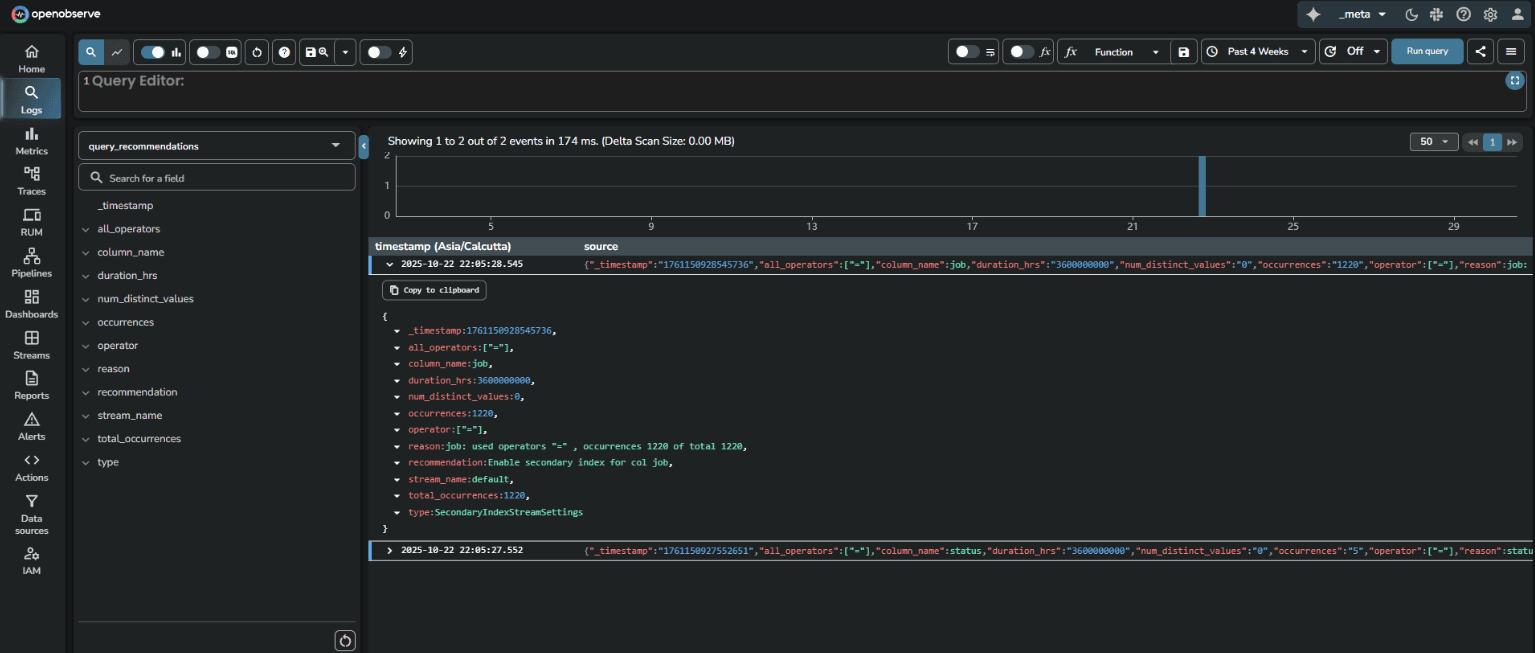
OpenObserve automatically analyzes your log query patterns and generates optimization recommendations stored in a dedicated query_recommendations stream. The system tracks which fields are queried, which operators are used (=, >, <), how frequently patterns occur, and the number of distinct values observed. Based on this analysis, OpenObserve suggests specific optimizations: enable secondary indexing for frequently queried fields, use full-text search for text fields, or switch to more efficient query functions like str_match or match_all.
Enterprise Edition includes a generous free tier with 50GB/day ingestion limit at no cost.
Learn more: OpenObserve Query Recommendations Documentation
DataDog does not offer query-driven index recommendations for logs, teams must analyze log patterns themselves and decide which fields to index without automated guidance based on actual query behavior
For high-cardinality log fields where selective indexing matters (to control costs and improve query speed), OpenObserve's query-driven recommendations are a practical advantage.
Retention Flexibility
DataDog's default log retention is 15 days, locked. Standard indexes allow 3, 7, 15, 30, 45, and 60 days, but shorter retention options require contacting DataDog Customer Success to enable them in your account.
Source: DataDog Data Retention Periods
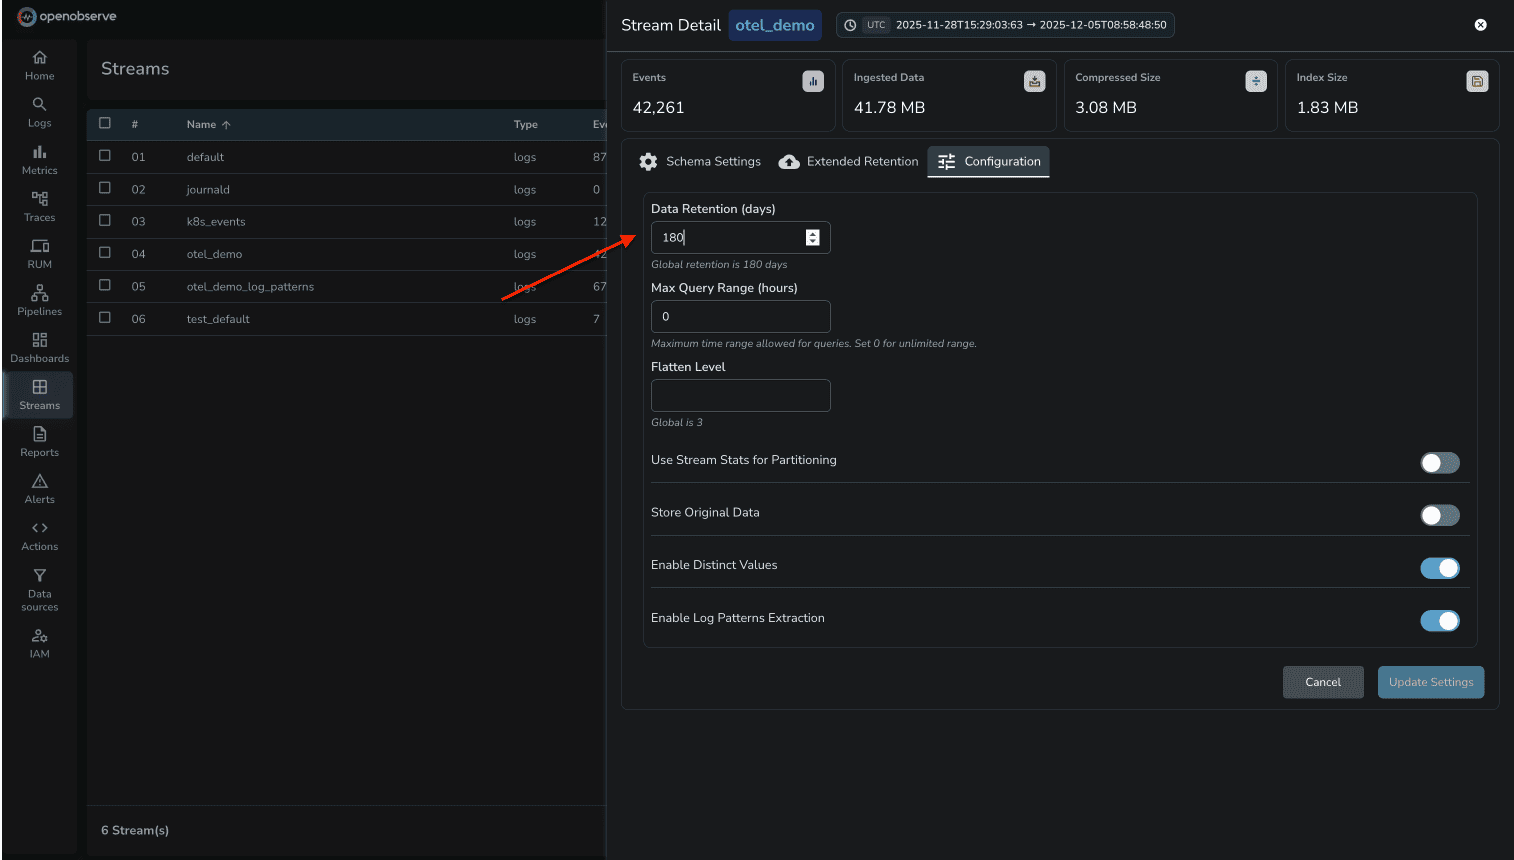
OpenObserve lets you configure retention per stream. Debug logs can be 3 days, production errors 30 days, audit logs 90 days. You control it based on operational needs, not vendor approval.
DataDog's index architecture is designed around pricing tiers. Teams carefully structure log indexes not for operational efficiency, but to minimize billing. With OpenObserve's $0.50/GB flat pricing, you design for observability needs.
Quick Comparison
| Capability | DataDog | OpenObserve | Winner |
|---|---|---|---|
| Field Discovery | Manual facets required | Automatic, all fields visible | OpenObserve |
| Deep Analysis | Not available for logs | Interactive dimension analysis | OpenObserve |
| Query Language | Proprietary | SQL (standard) | OpenObserve |
| Log Patterns | Auto-grouping supported | Auto-grouping supported | Tie |
| Pipelines | Configuration-based, 20 processor limit | Visual editor + query-time VRL transforms | OpenObserve |
| Query Recommendations | Not Available for logs | Analyzes log queries, suggests indexes | OpenObserve |
| Retention | 15-day default, CS approval for custom | Per-stream control, object storage | OpenObserve |
| Pricing Model | Complex multi-dimensional pricing | Predictable flat-rate pricing, significant cost savings | OpenObserve |
Cost Breakdown: DataDog vs OpenObserve for Logs
The cost difference between DataDog and OpenObserve for log management is substantial. DataDog's multi-dimensional pricing model creates unpredictability, while OpenObserve's flat-rate pricing provides complete transparency.
DataDog's Multi-Dimensional Log Pricing
DataDog charges for logs across three dimensions that compound to create the final bill:
1. Indexed Log Volume DataDog charges based on how many logs are indexed (made searchable). In the test environment, logs generated from the 16-service application triggered indexing charges based on the volume of logs retained and searchable in DataDog's platform.
2. Host-Based Charges DataDog counts the number of hosts (containers, VMs, or nodes) sending logs. Each host generating logs contributes to the infrastructure monitoring tier charges. In the test, the OTel Collector and the 16 microservices each counted as separate hosts, multiplying the base infrastructure cost.
3. Retention Tier Pricing Longer retention periods increase costs. DataDog's default 15-day retention is locked, and extending retention requires customer success approval with additional charges per retention tier.
These three pricing dimensions compound. A single log stream doesn't just cost for the data indexed-it also triggers host charges and retention multipliers. As infrastructure scales, predicting monthly costs becomes increasingly difficult.
OpenObserve's Flat-Rate Pricing
OpenObserve charges $0.50 per GB ingested. No host charges. No indexed log charges. No retention tier multipliers. All logs go to object storage (S3, GCS, Azure Blob), and long-term retention doesn't increase the per-GB rate.
Real Cost Comparison
In the test environment running the 16-service OpenTelemetry demo application with Kafka, PostgreSQL, Valkey, and LLM services:
DataDog usage dashboard showed:
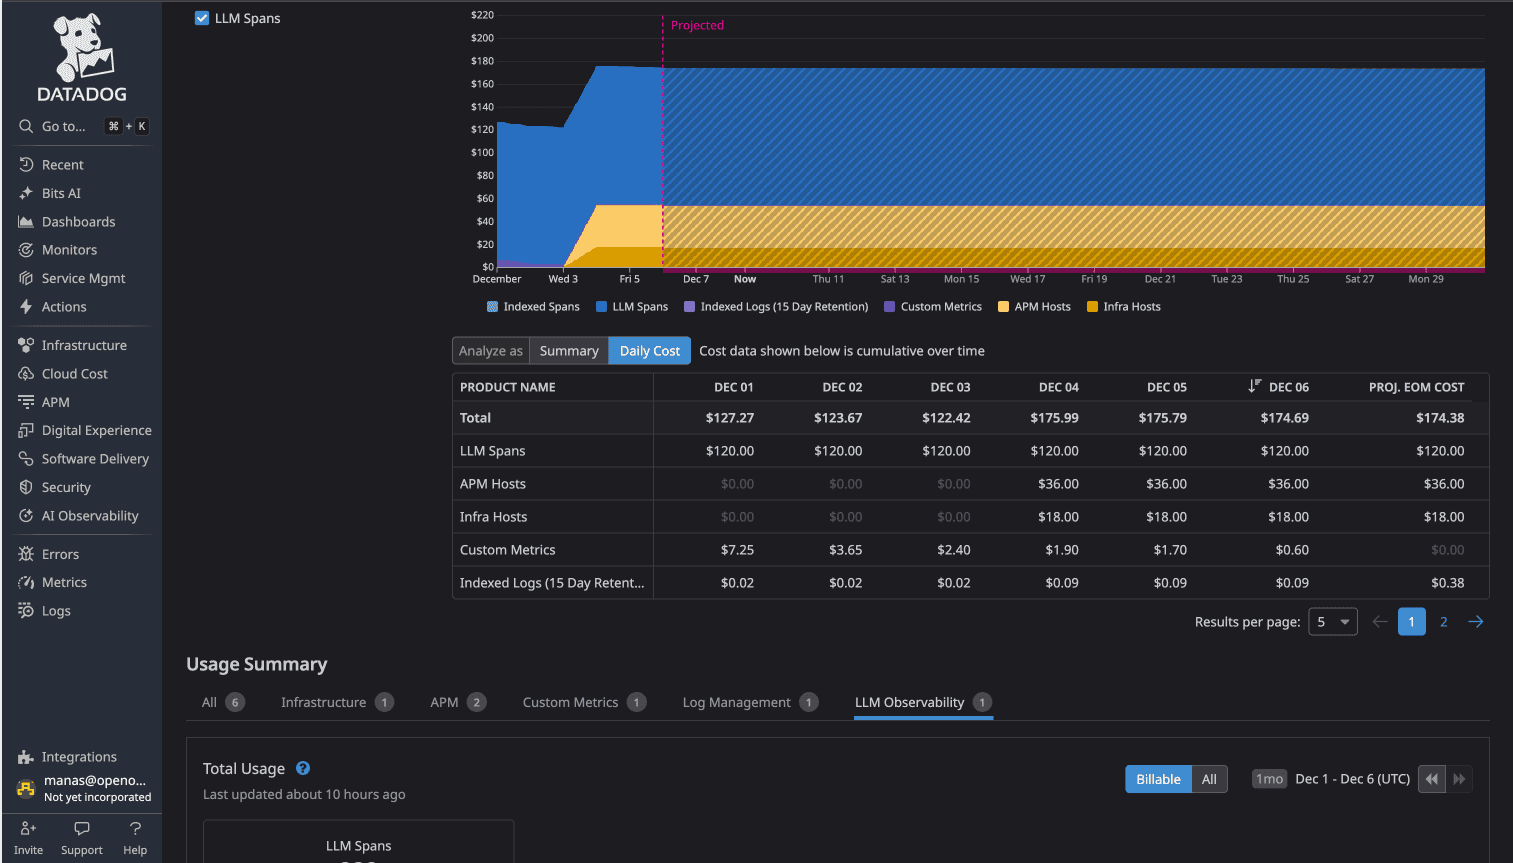
DataDog Total: $174/day
- Infrastructure monitoring (hosts): ~$18/day
- APM & trace indexing: ~$36/day
- LLM observability premium tier: ~$120/day
While not all $174/day was exclusively logs (traces and metrics contributed), the log component triggered host-based charges and indexed log costs that compounded with other observability charges.
OpenObserve Total: $3.00/day
- Flat ingestion pricing across logs, metrics, and traces
- No per-host charges
- No premium feature tiers
- No retention multipliers
The cost difference: 58x (more than 98% cost savings)
For identical observability data (logs, metrics, traces) from the same application, DataDog cost 58 times more than OpenObserve.
Why the Cost Difference Matters
For platform engineering teams managing production infrastructure at scale:
- Predictability: OpenObserve's flat pricing means you can forecast costs based on data volume. DataDog's multi-dimensional pricing creates surprises as infrastructure evolves.
- No Trade-Offs: With OpenObserve, you don't choose between full observability and budget. All logs are ingested at the same rate.
- Retention Freedom: Long-term log retention for compliance or historical analysis doesn't trigger cost escalation in OpenObserve.
The 60-90% cost reduction that Evereve achieved isn't an outlier. It's the direct result of eliminating multi-dimensional pricing complexity.
The Bottom Line
DataDog is a mature platform with extensive integrations and a large user base. If you're already invested in the DataDog ecosystem and cost isn't a primary concern, it works.
But if you're evaluating log management platforms or reconsidering your current observability costs, OpenObserve delivers advance log analysis capabilities (automatic field discovery, pattern detection, transformation pipelines, PII redaction) with significant advantages:
- SQL queries instead of proprietary syntax
- Automatic field indexing without manual facet creation
- Upto 90% lower costs
For platform engineers managing microservices at scale, these differences compound. Less operational friction, more query flexibility, and significantly lower costs.
- Full comparison
- Part 1: Logs - Automatic Field Discovery, SQL Queries, and 90% Cost Savings
- Part 2: Metrics - Drag & Drop, SQL, PromQL, High Cardinality
- Part 3: Traces/APM - OTel Native, No Hidden Tiers
- Part 4: Dashboards- Prebuilt, Drag & Drop, Custom
- Part 5: Alerts, Monitors, Destinations
- Part 6: Real User Monitoring
- Part 7: Pipelines
- Part 8: IAM (SSO, RBAC)
- Part 9: Cost
Prefer to try it locally first? The entire OpenObserve install is one command:
Sign up for a free cloud trial and test OpenObserve with your own logs, or schedule a demo to see how OpenObserve handles your specific logging requirements.
About the Author
Manas Sharma


Manas is a passionate Dev and Cloud Advocate with a strong focus on cloud-native technologies, including observability, cloud, kubernetes, and opensource. building bridges between tech and community.
Follow OpenObserve on Google
Add OpenObserve as a preferred source to see more of our articles in Google Search and Top Stories.













