Enterprise Professional
Self-hosted Enterprise, free up to 50GB. Advanced features for growing teams.
Gain deep insights into your cloud infrastructure performance, troubleshoot issues efficiently, and optimize your operations.
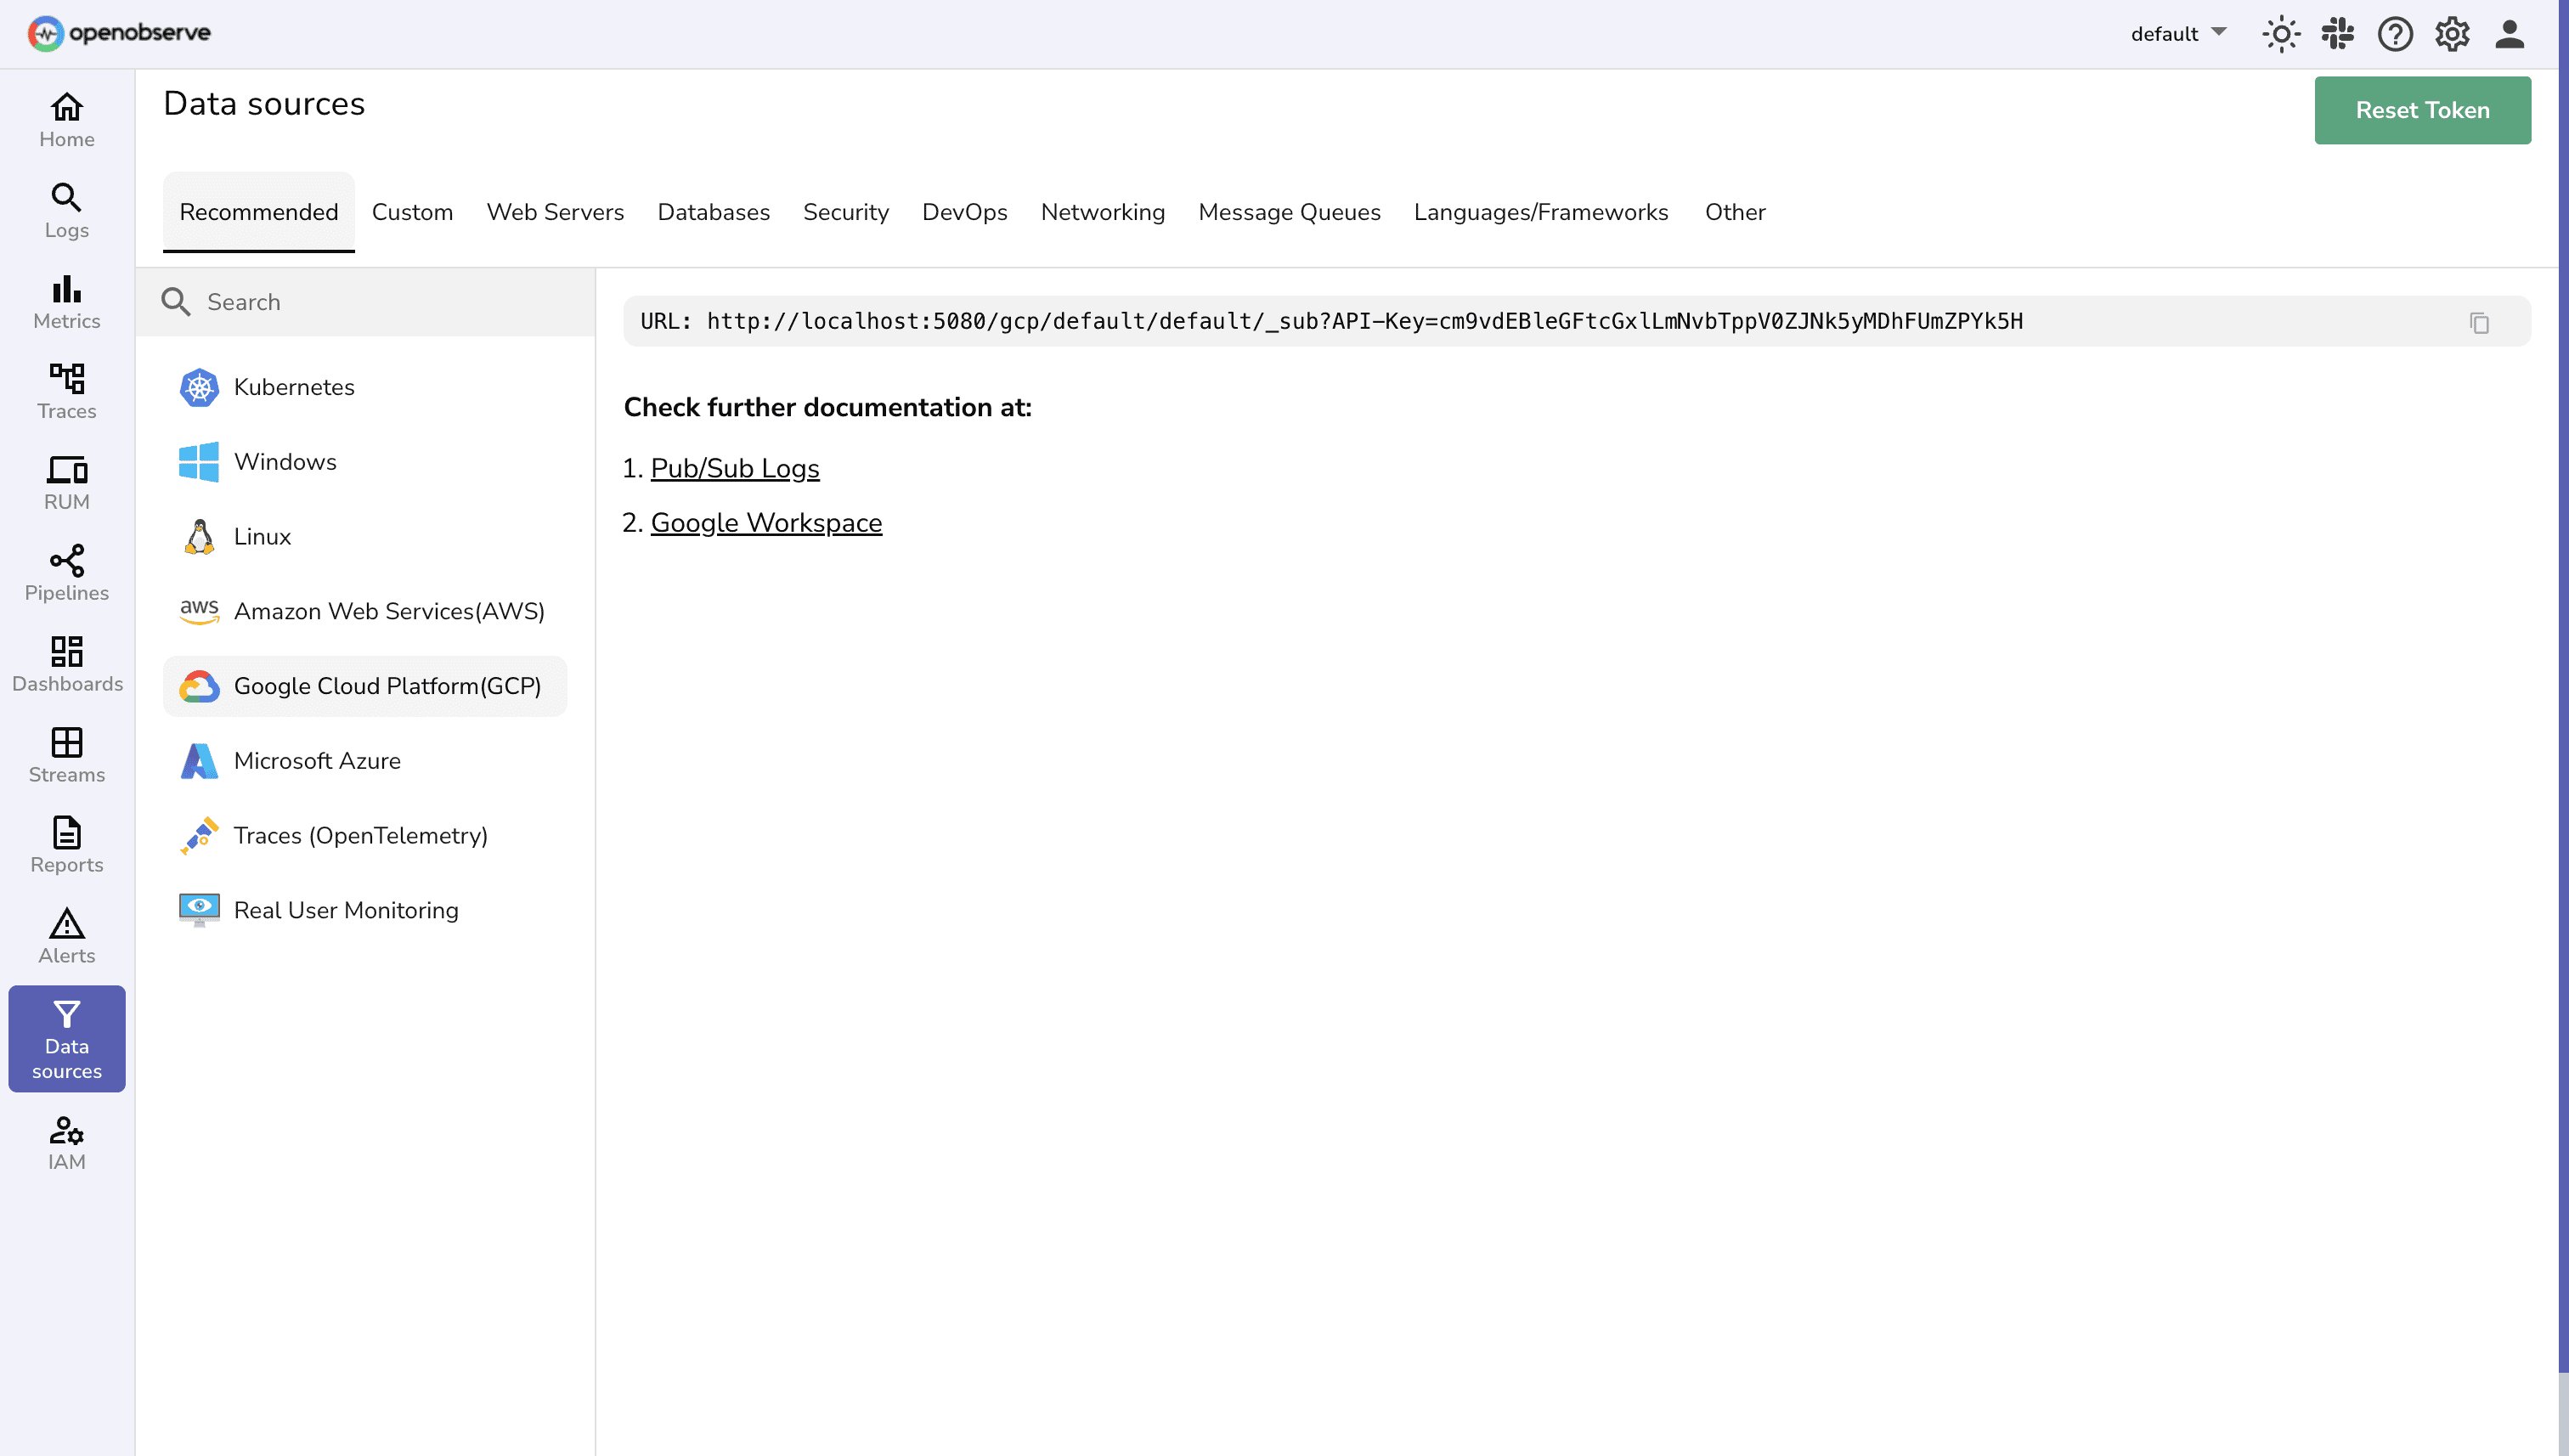
Connect your Google Cloud estate in minutes. OpenObserve ingests directly from the services you already run — no agents, no custom glue code.
Gain deep visibility into the many layers of your GCP environment for faster troubleshooting and proactive issue prevention.
Slash GCP telemetry storage costs with OpenObserve’s efficient compression and retention.
Easy setup with the Cloud Logging export to Pub/Sub or OpenTelemetry collector for efficient telemetry collection.
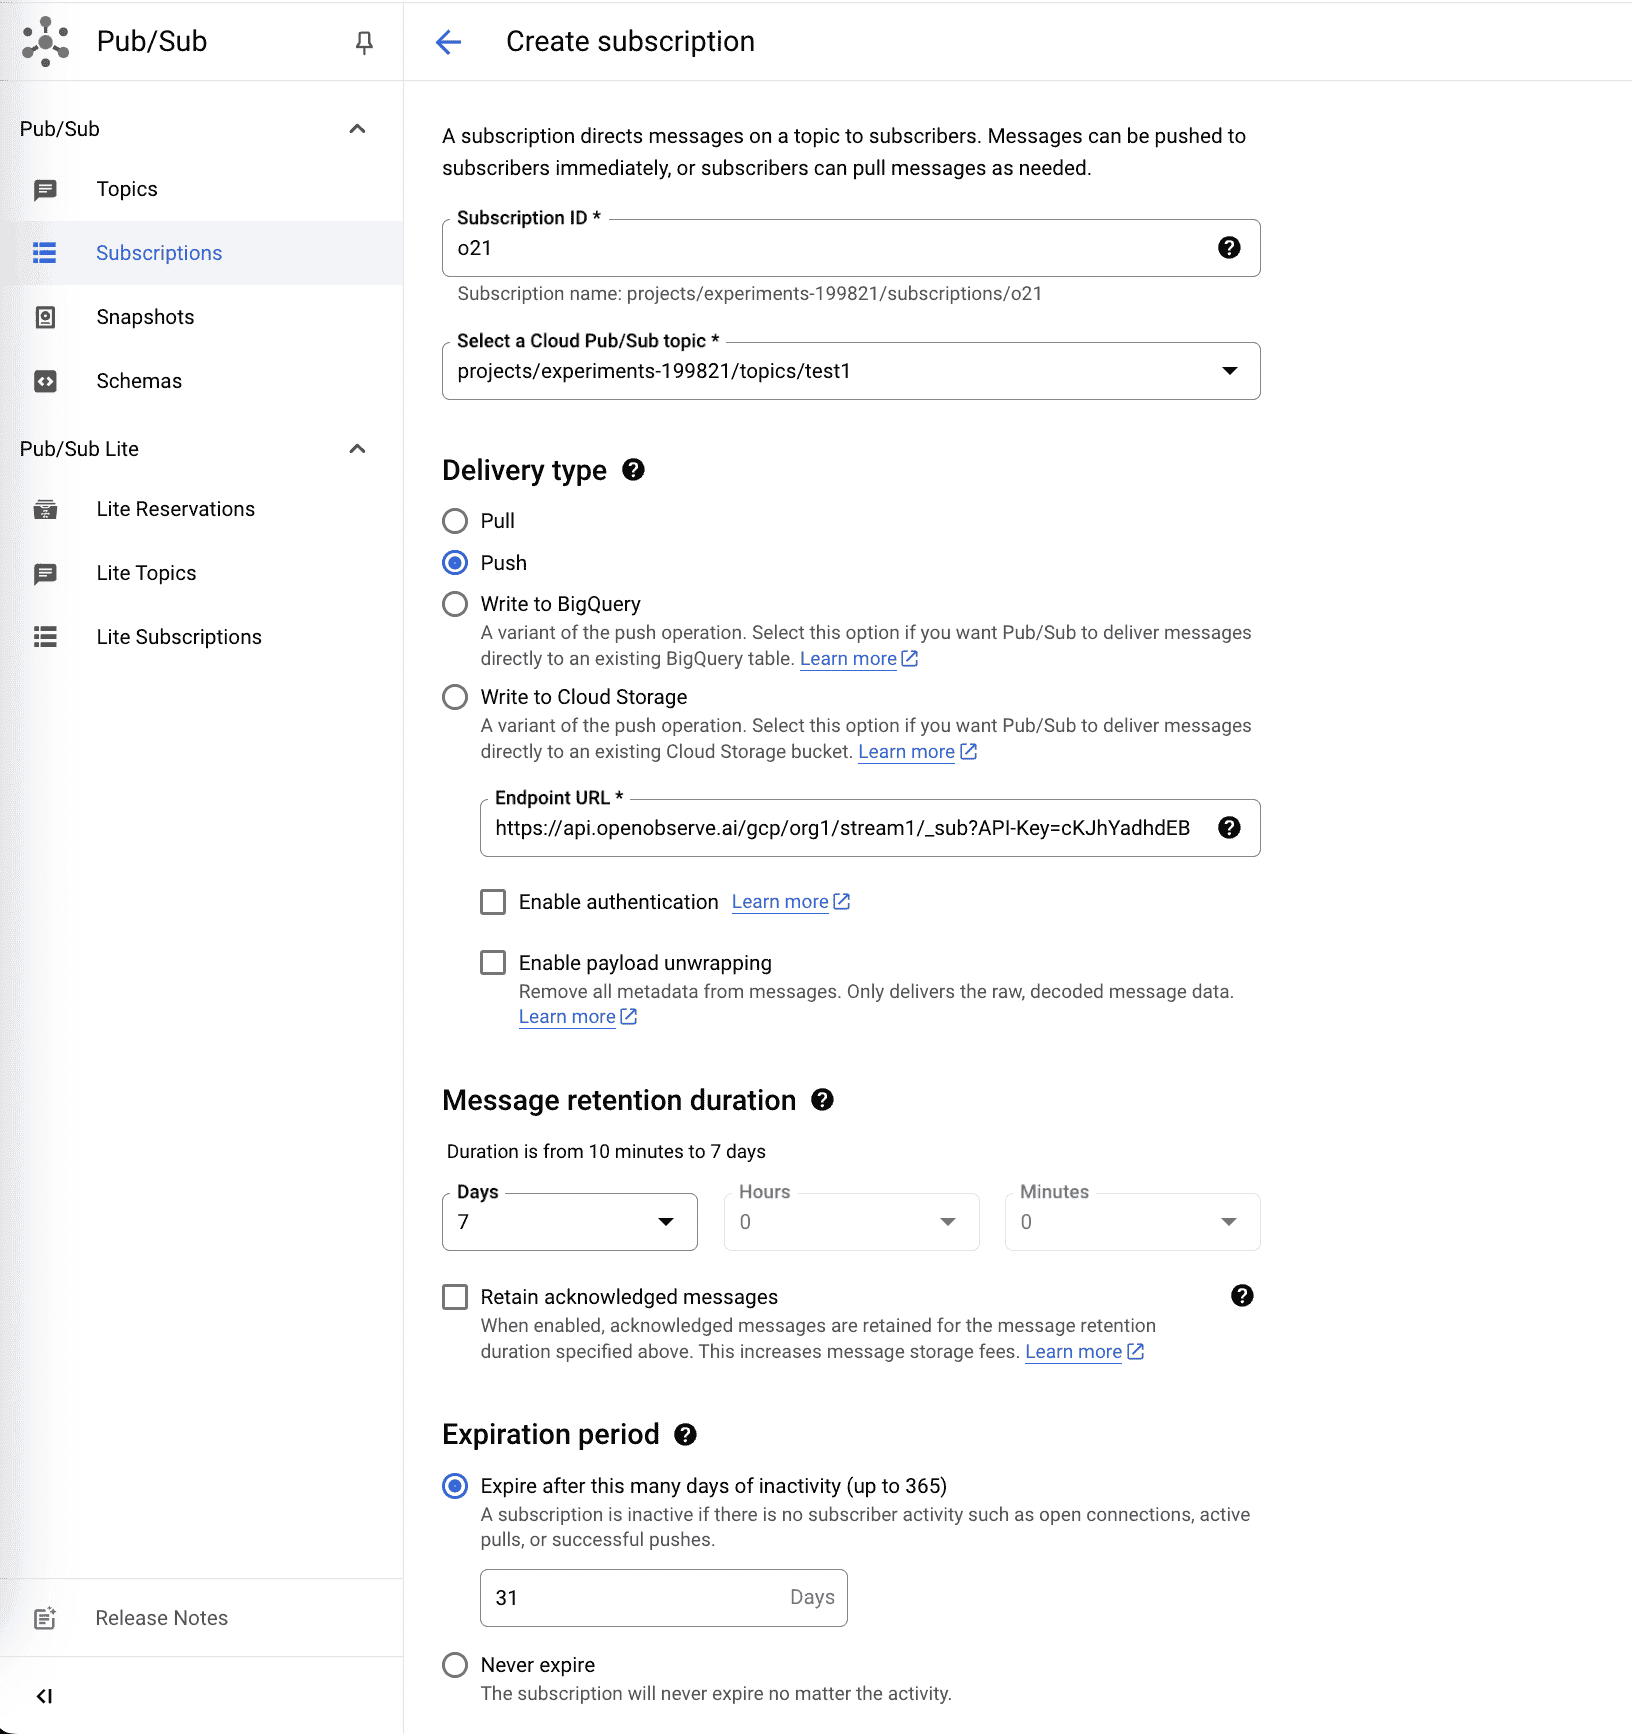
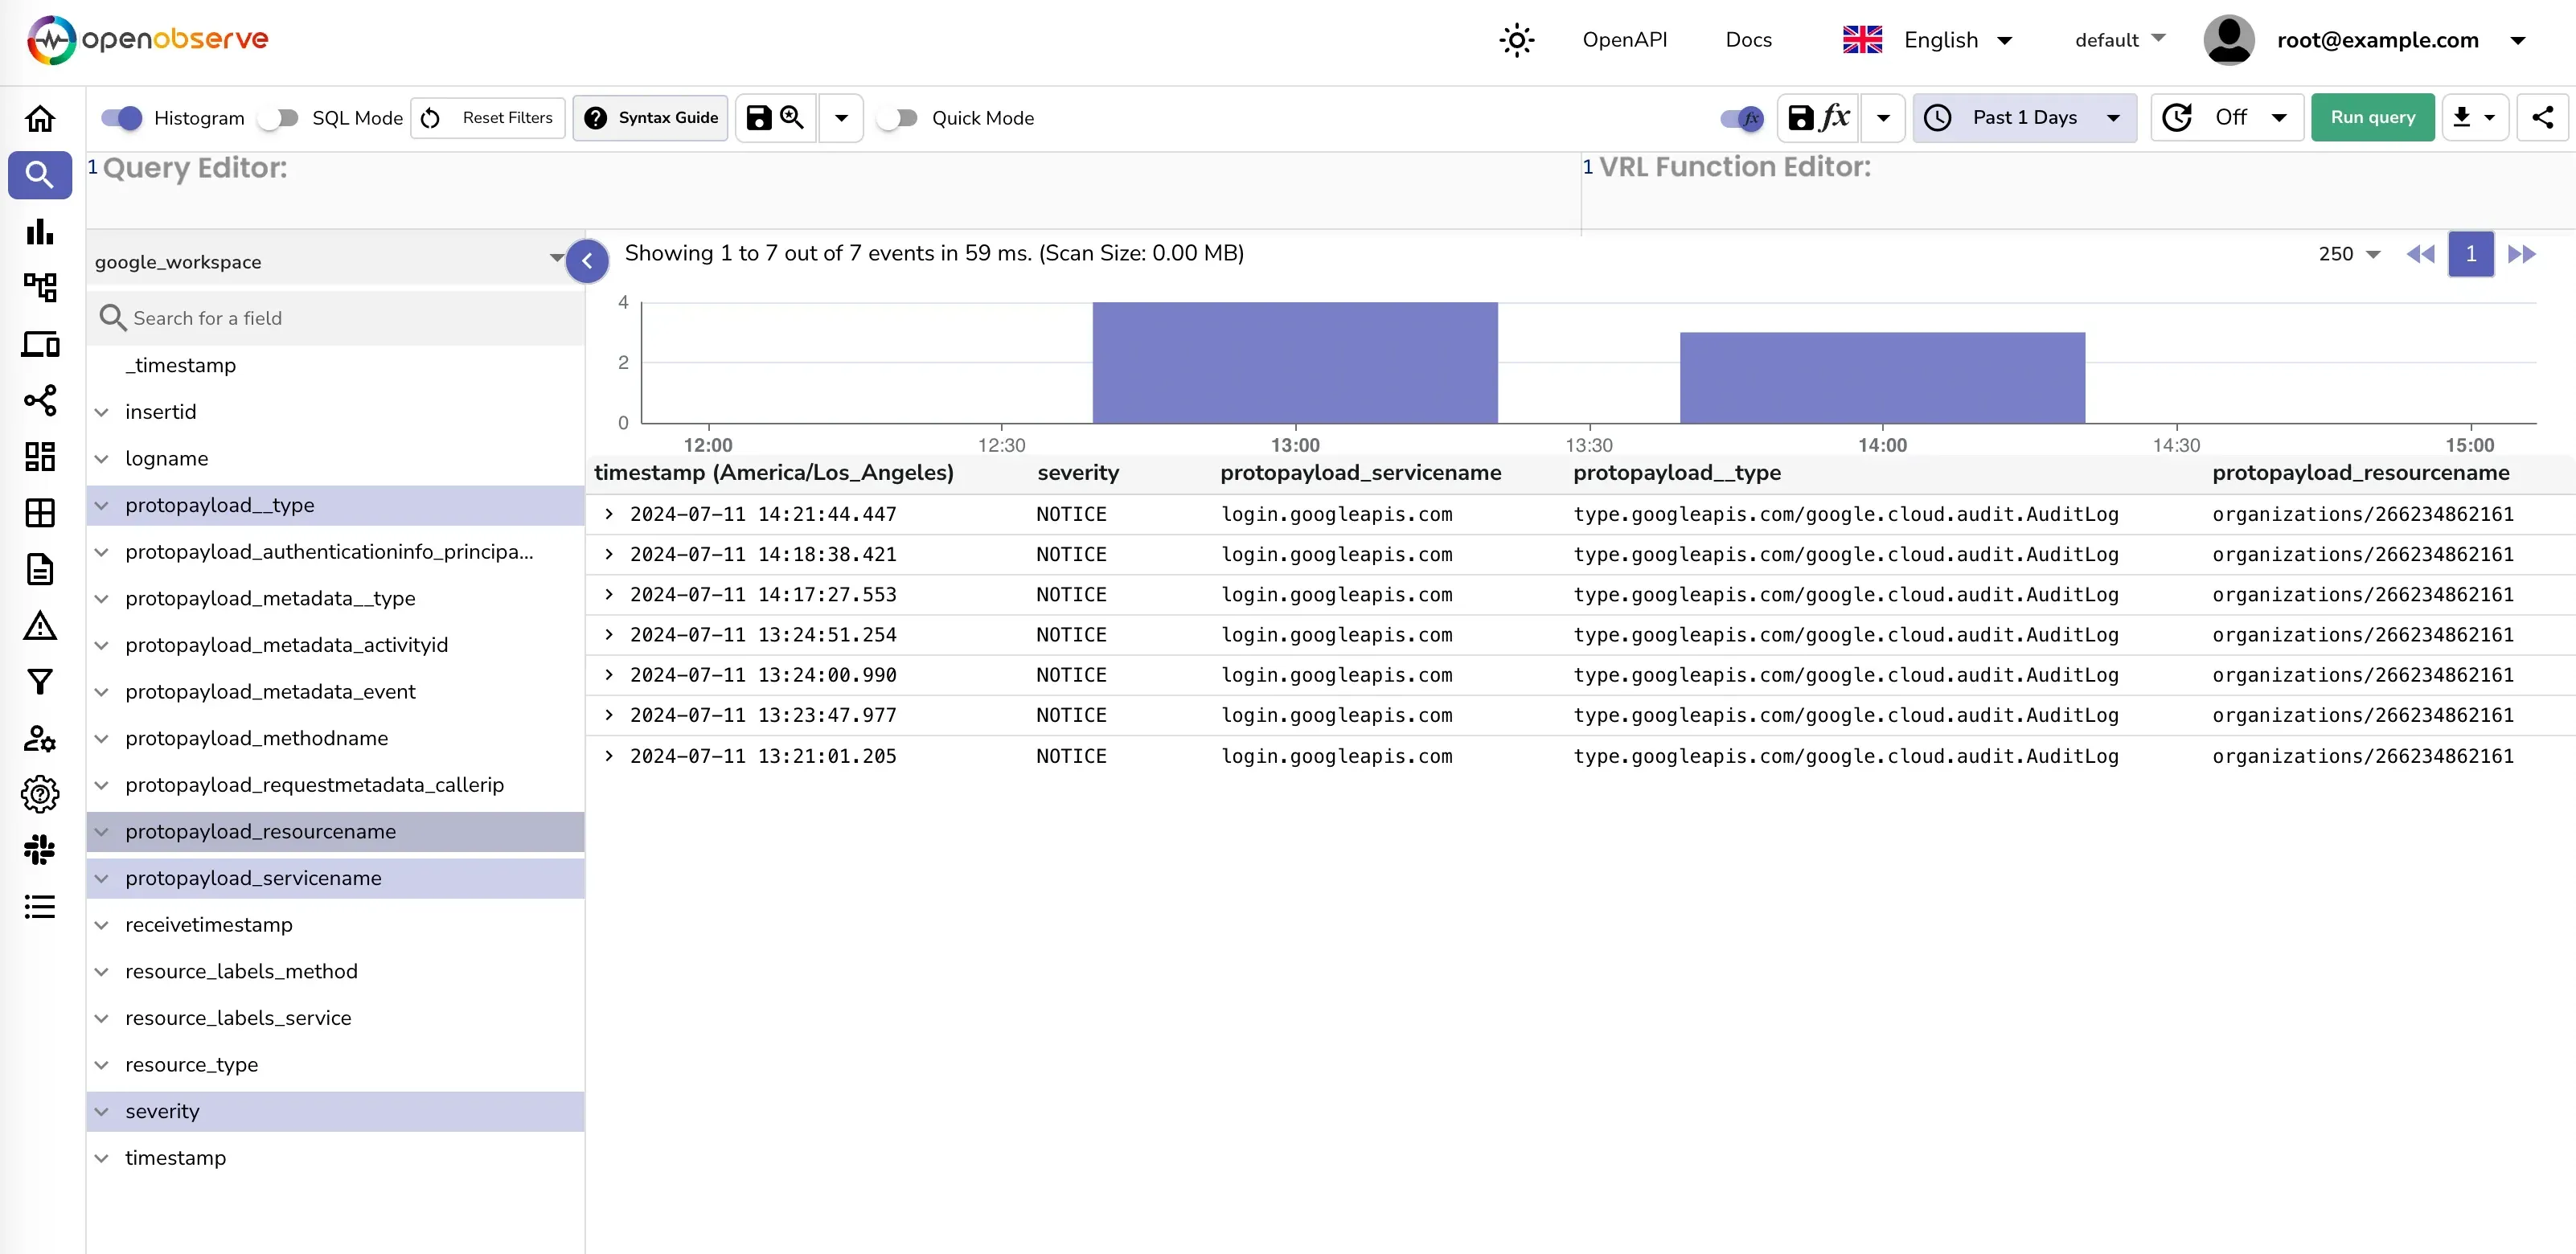
Export logs seamlessly from GCP services via Cloud Logging to Pub/Sub. Process audit logs, VPC flow logs, and application logs through a unified pipeline.
Monitor GCP metrics through Cloud Monitoring export with support for both platform and custom application metrics.
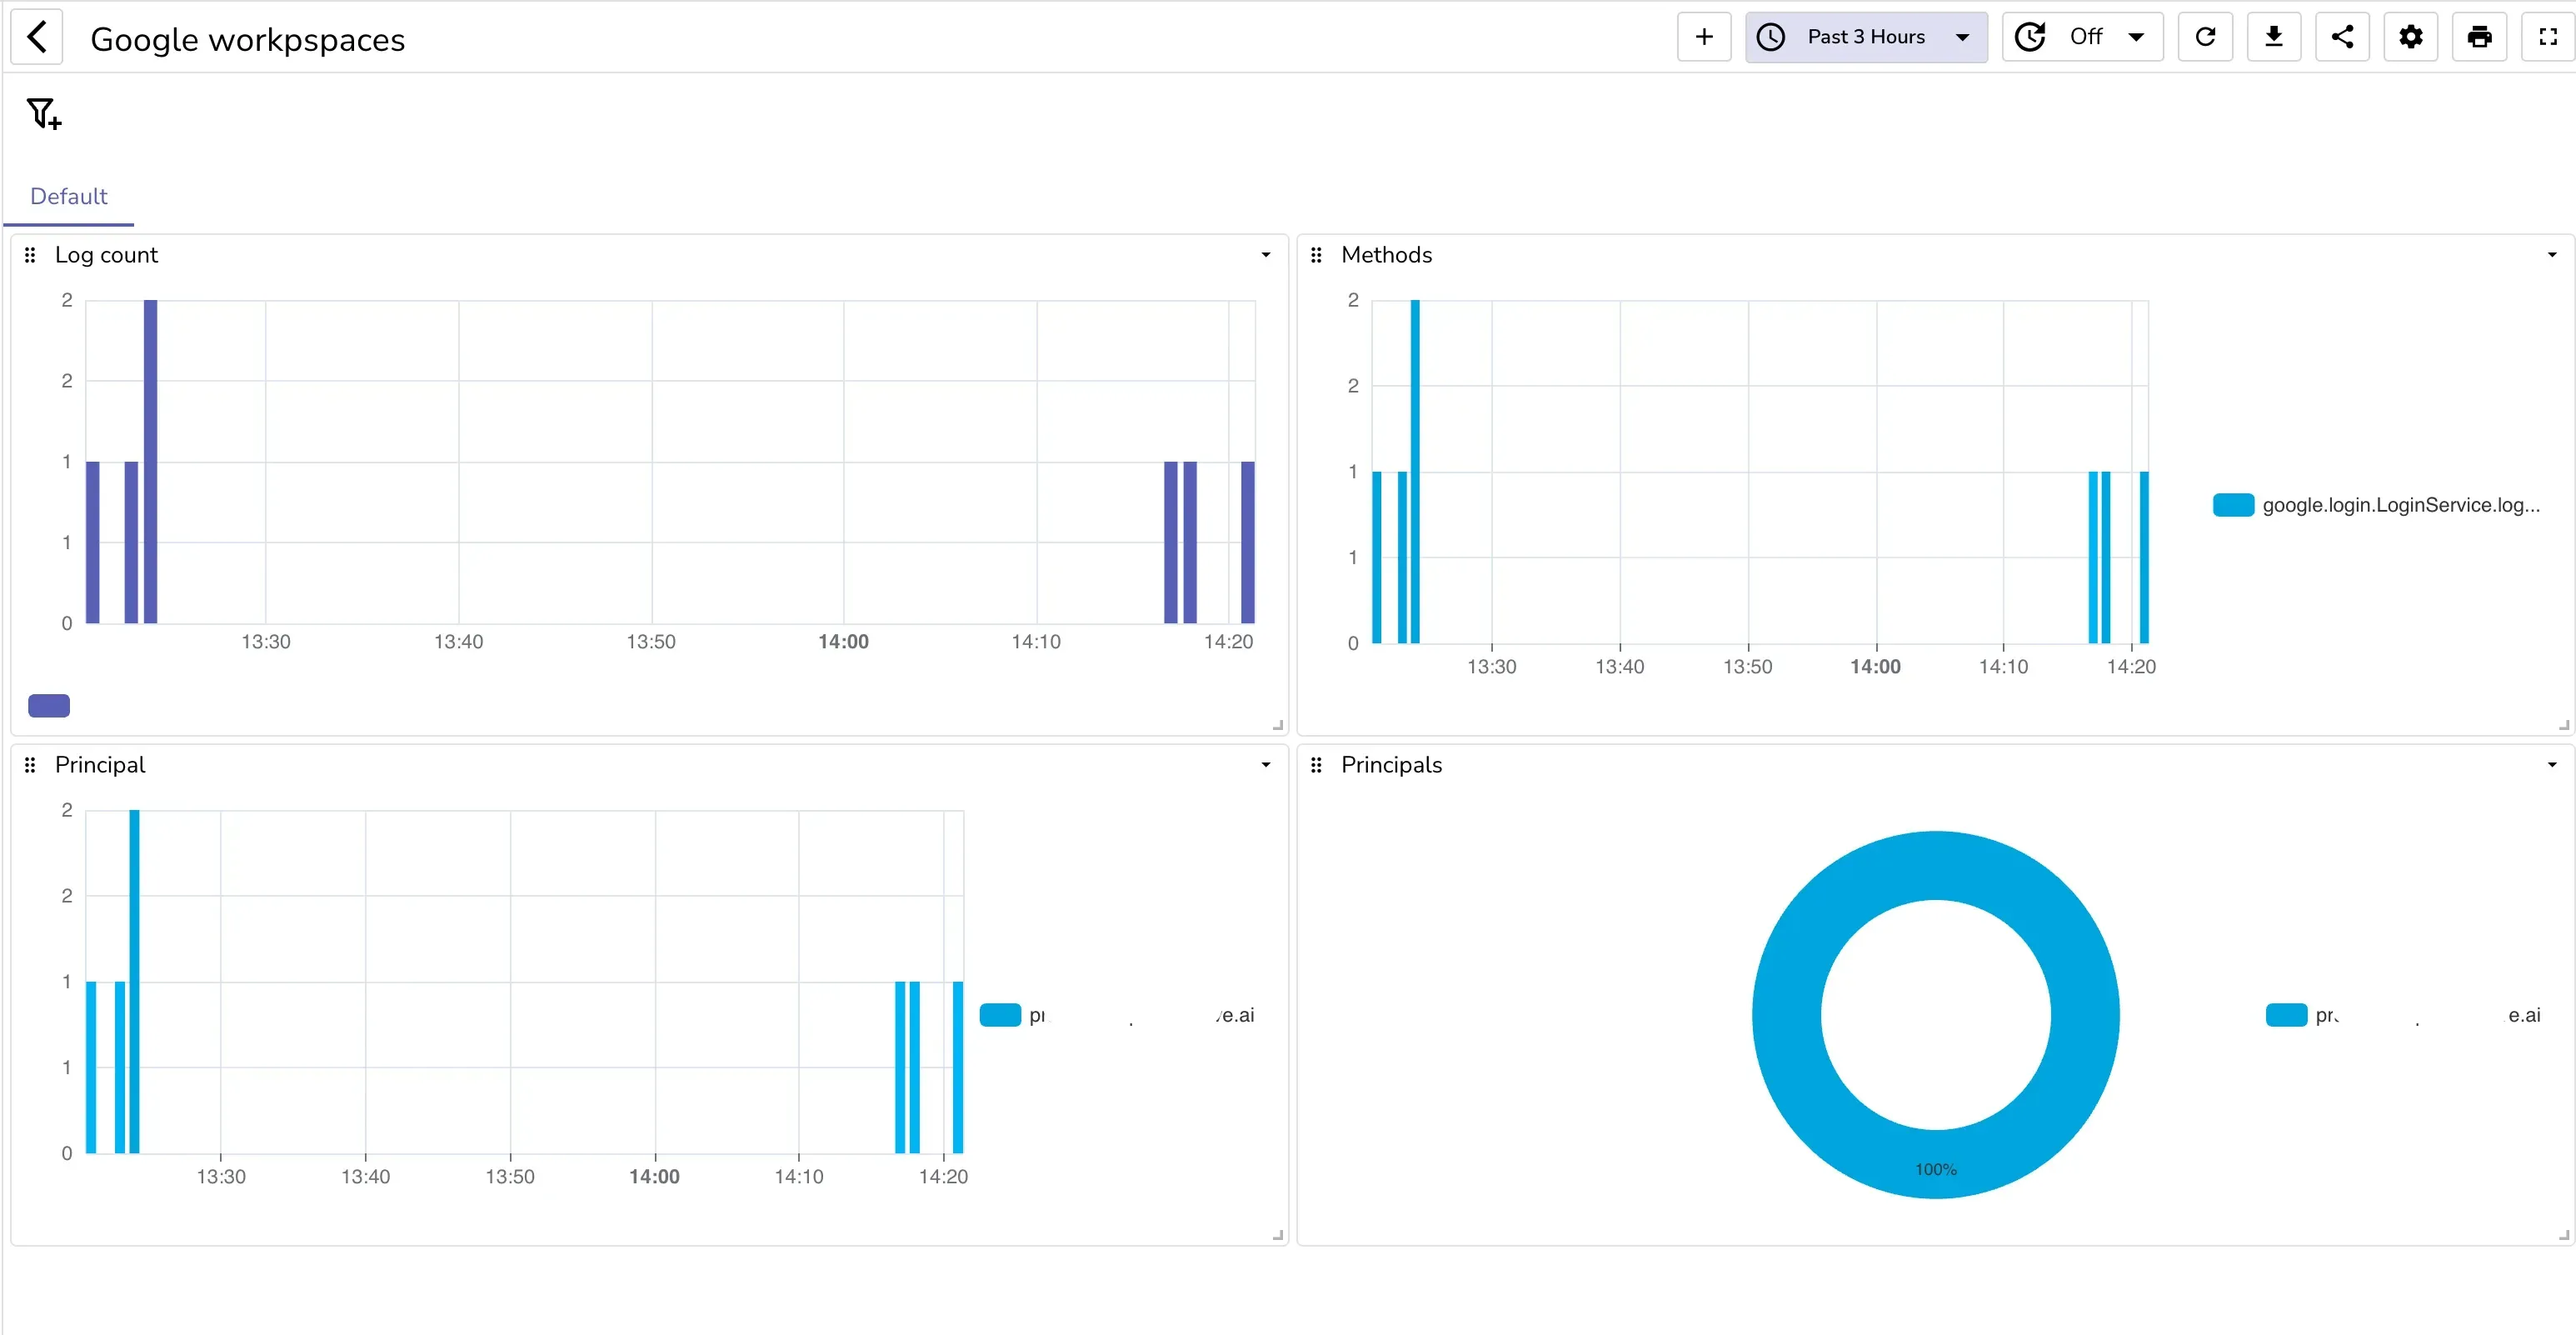
Monitor essential GCP services including Compute Engine, Cloud Run, Cloud Functions, and Cloud SQL with powerful dashboards and alerts.
Track resource utilization, performance metrics, and service health across your GCP environment with real-time visibility.

Parse GCP logs with built-in processors optimized for Google Cloud formats and custom log structures.
Query logs and metrics using familiar SQL syntax with support for complex aggregations and time-series analysis.
Monitor compute resources and services with detailed metrics for capacity planning and optimization.
Configure retention policies and compression settings to balance cost efficiency with data accessibility.
From zero to GCP dashboards in minutes — no agents to babysit, no pipelines to wire by hand.
See the guideSpin up a in the region closest to you.
Point Cloud Logging or Pub/Sub at OpenObserve and load prebuilt GCP dashboards in a couple of clicks.
Watch logs, metrics, and traces stream in — correlated and query-ready from the first event.
Monitor every AWS service you run with prebuilt dashboards, metrics, and alerting rules. Pick the plan that fits your team.
Self-hosted Enterprise, free up to 50GB. Advanced features for growing teams.
Fully managed OpenObserve in the cloud. Start with a free trial — no infrastructure to run.
Enterprise-grade support, SSO, and SLAs for large-scale, multi-region deployments.