“OpenObserve helped us migrate from Datadog in under an hour... reducing observability costs by 4x.”

4x
Lower observability cost

< 1 hour
Migrated off Datadog

Flat pricing
No month-end surprises
Investigates the second an alert fires.
Meet your 24/7 AI SRE. It starts investigating the second an alert fires, so you arrive to root causes instead of raw telemetry.
The agent starts the moment an alert fires, not when someone opens a ticket.
Get a complete audit trail of every log, trace, and metric during the agent’s investigation.
Connect your own LLM provider with your API key, so your team stays in control of security, governance, and spend.
Analyze logs, metrics, and traces across your entire environment automatically, investigating every signal and dependency exactly like a senior SRE.
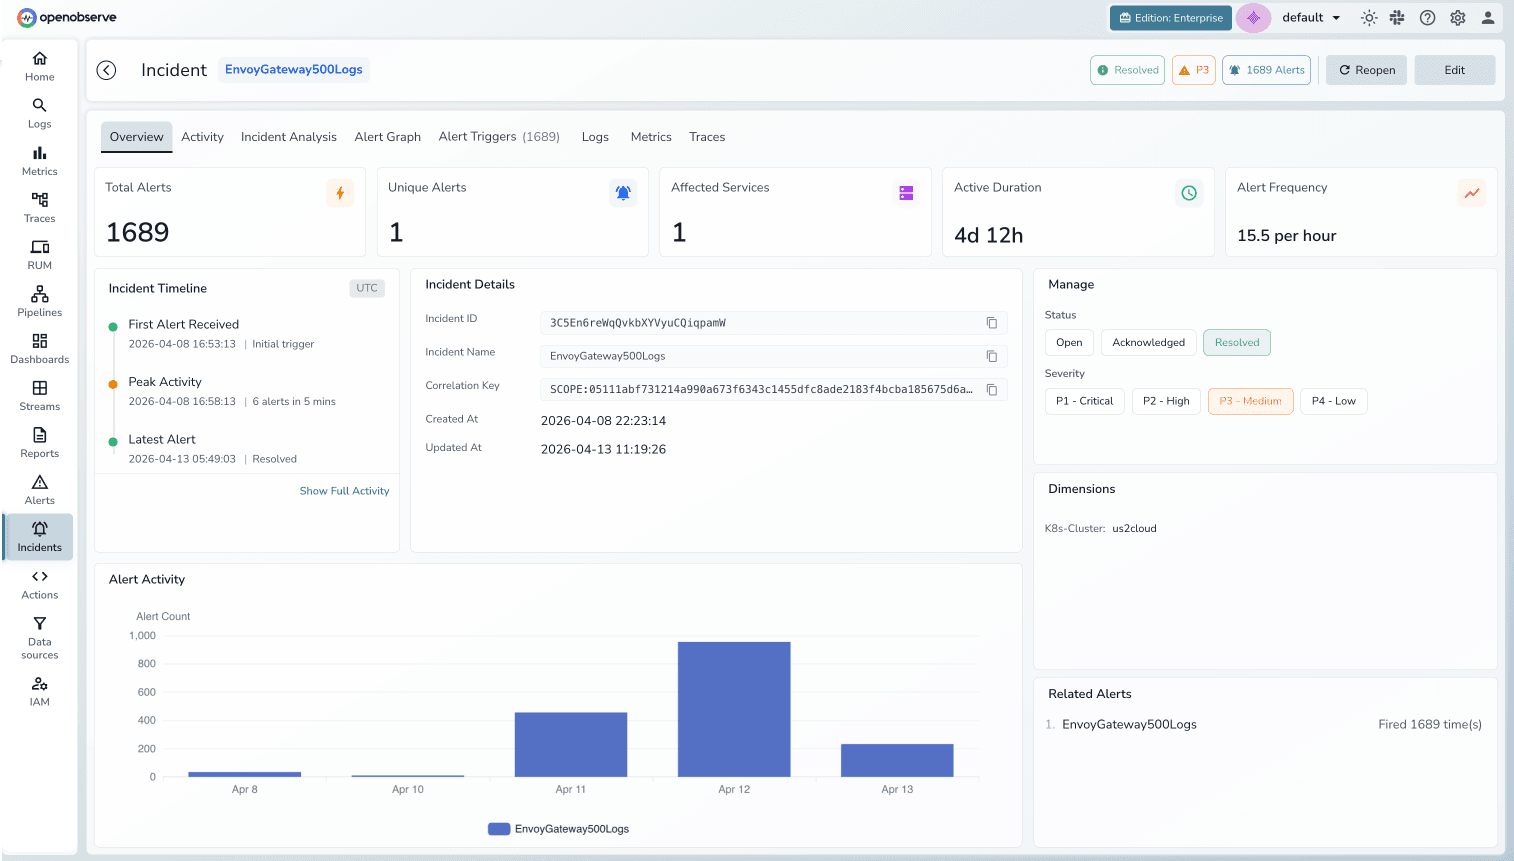
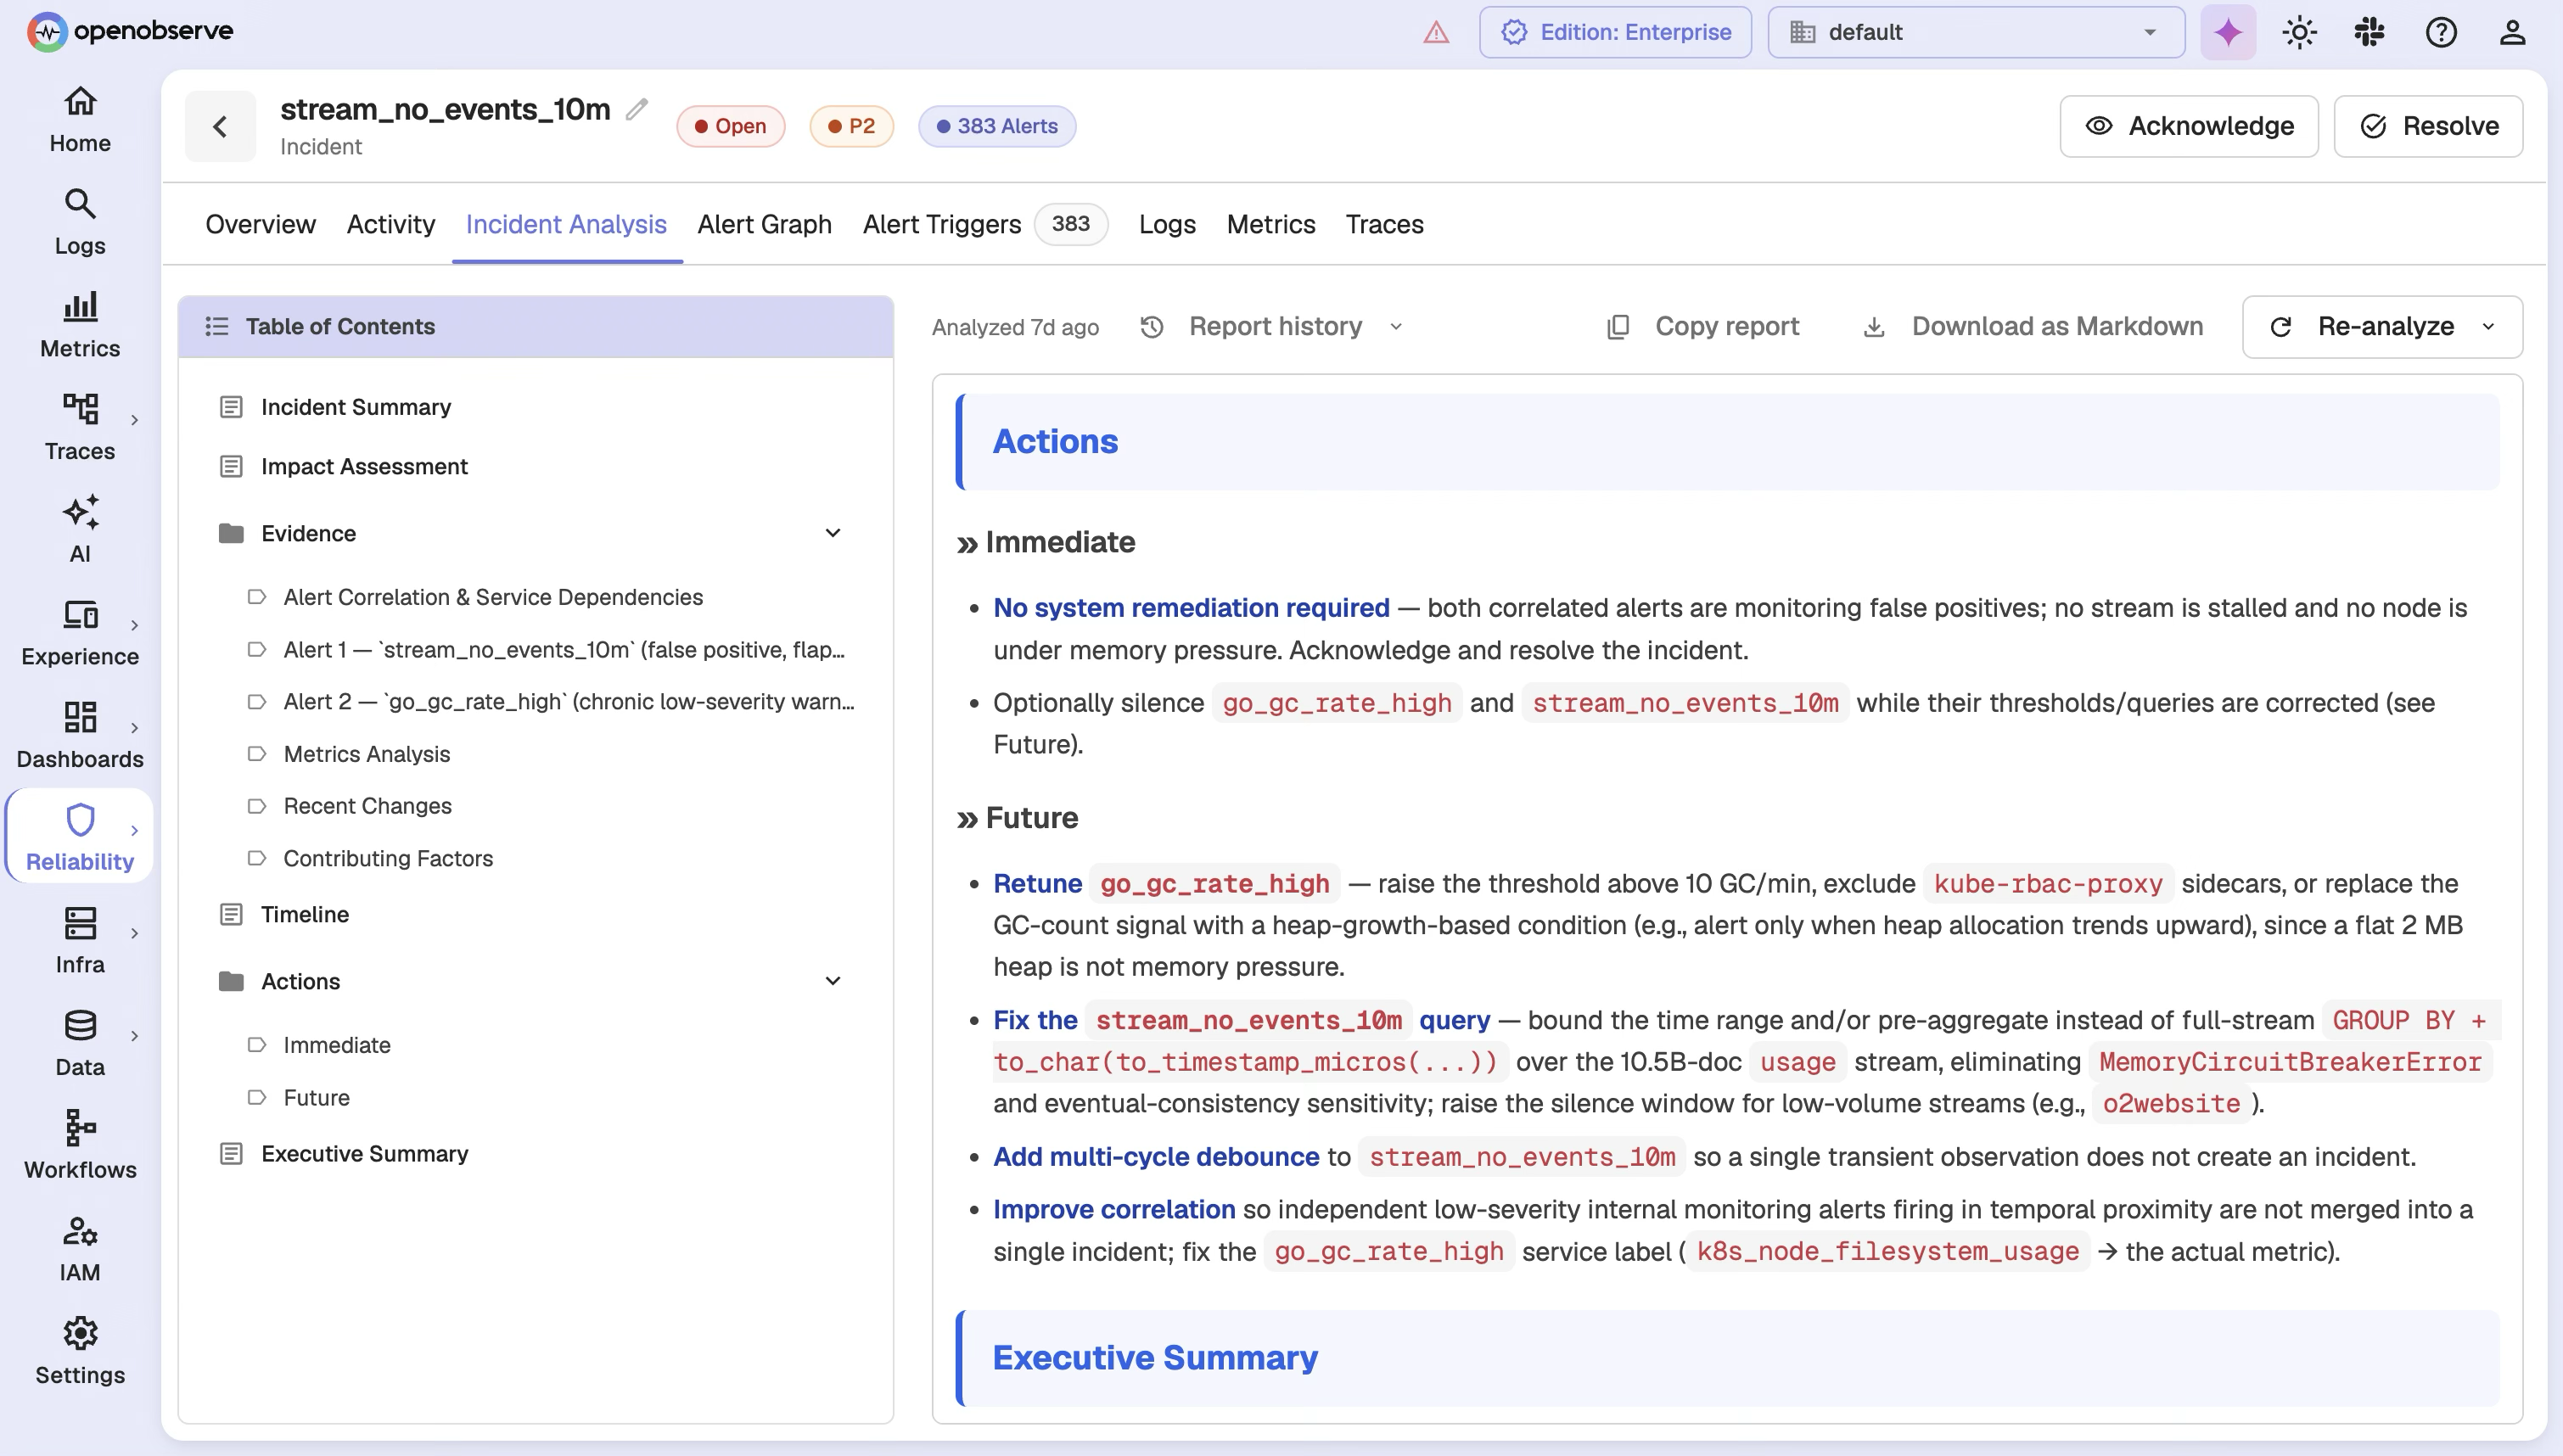
The agent automatically documents actionable remediation plans, delivering a full incident breakdown including diagnosis, root cause, and fix.
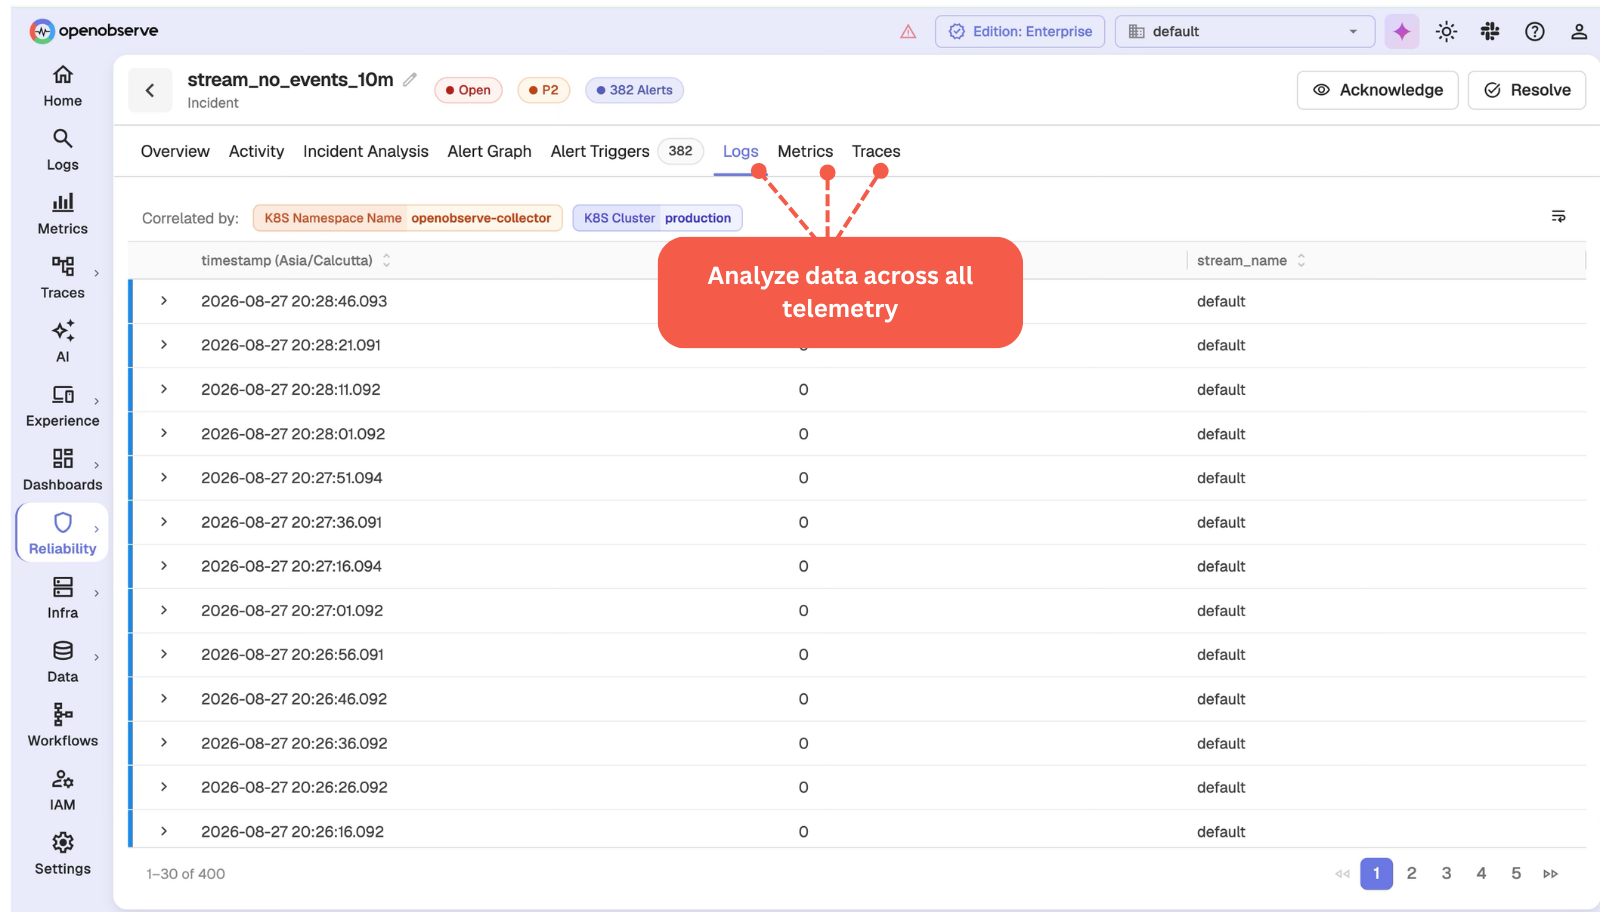
Verify findings with a complete evidence chain. Review correlated logs, metrics, and traces, inspect service topology graphs, and trace the incident’s timeline.
Map dependencies across distributed services instantly. The agent identifies upstream causes and downstream effects.
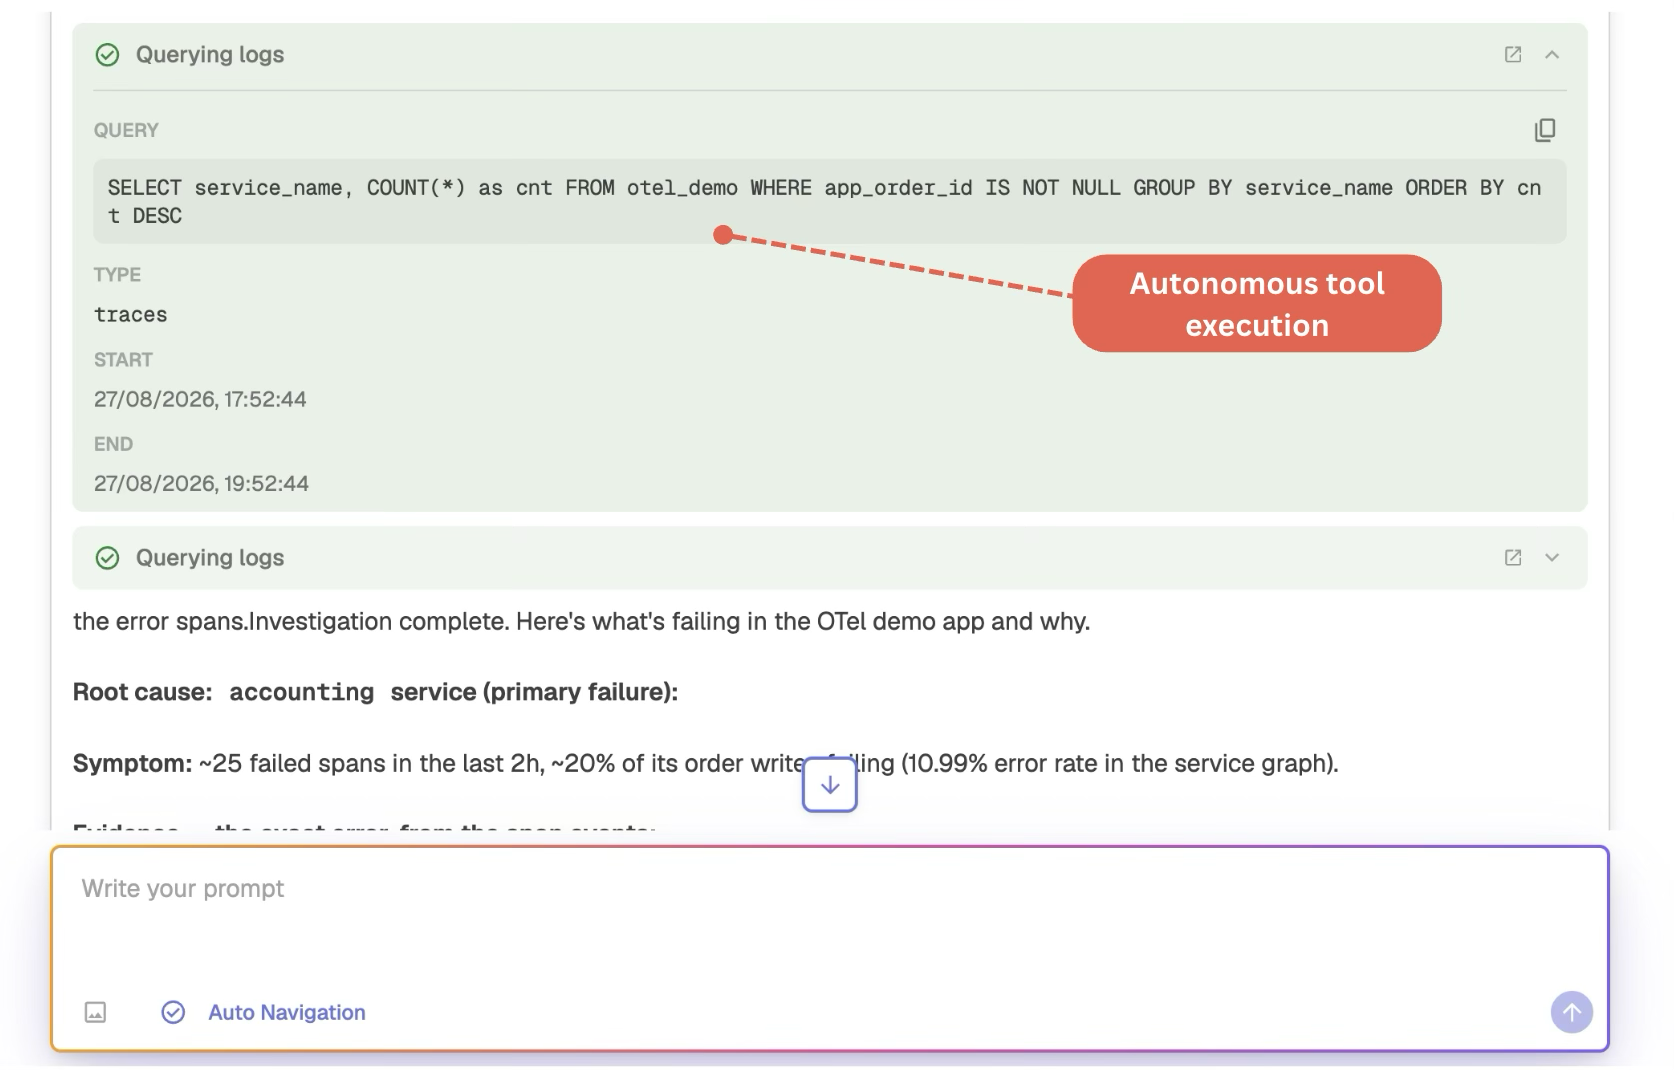
The agent uses OpenObserve’s own tooling via MCP, the same way a person would navigate the UI, except it never misses a step.
Unlike black-box systems, OpenObserve’s AI SRE shows exactly what data it analyzed and how it reached conclusions, helping engineers validate recommendations and learn from AI decision-making.
Triggered instantly, no delay. The agent initiates the investigation cycle the moment the alert fires.
Link current anomalies to historical incident data, and every incident becomes part of the knowledge base.
Same telemetry, same workloads, one platform. Every number is OpenObserve against a named vendor - not an industry average.
vs. Datadog
8×
more cost-effective
8x cost reduction means you can unify your observability into a single platform.
Read case studyvs. Elastic
140×
storage efficiency
140x storage means longer retention doesn't necessarily mean expensive bills.
Read case studyvs. Grafana stack
5–15×
faster performance
5x to 15x faster queries mean dashboards load in milliseconds, not minutes.
Read case studySee how much you would save switching today.
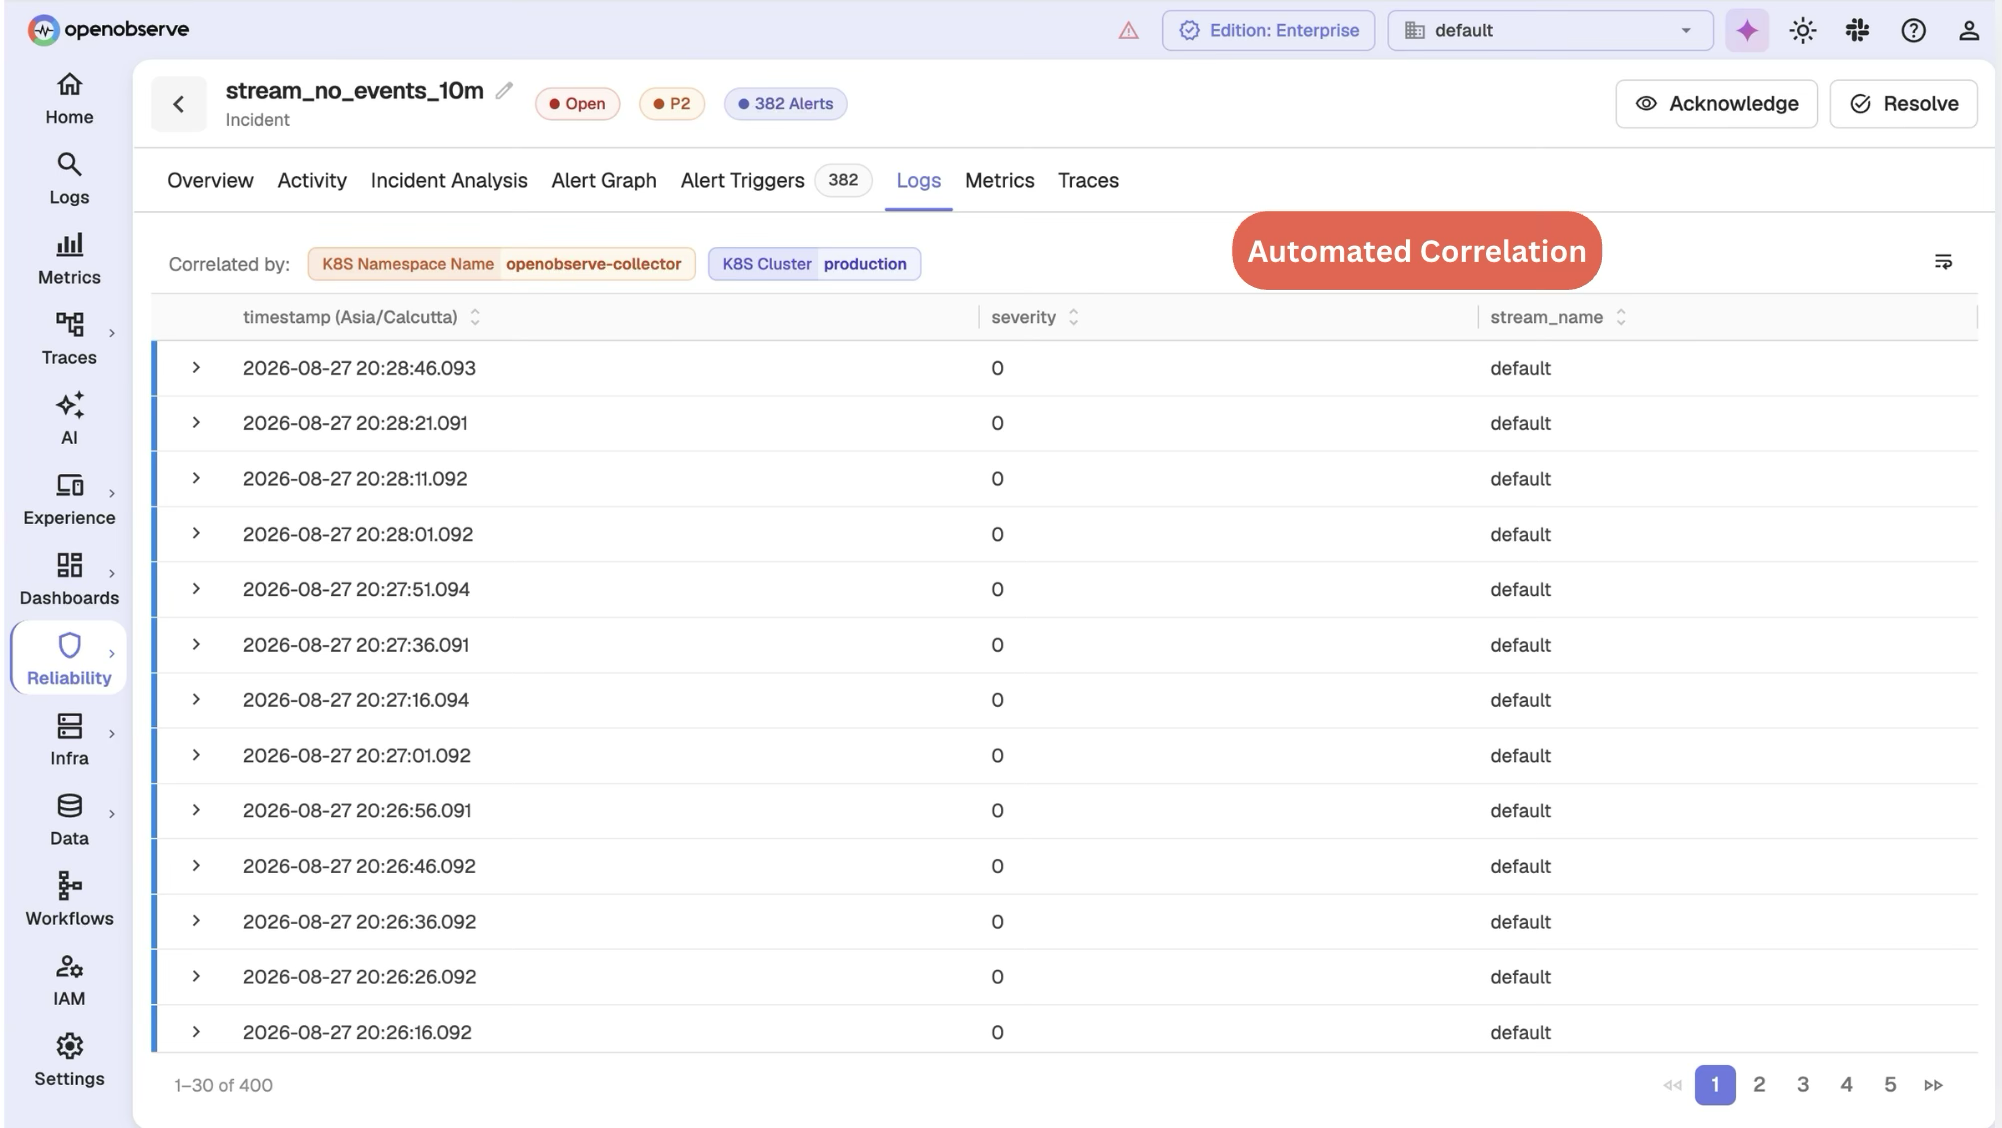
Correlate between the environments and signals across various sources with OpenObserve built-in correlation engine.
“OpenObserve helped us migrate from Datadog in under an hour... reducing observability costs by 4x.”
4x
Lower observability cost
< 1 hour
Migrated off Datadog
Flat pricing
No month-end surprises
to help you get the most out of AI SRE.
Try OpenObserve today for more efficient and performant observability.

AI Observability by OpenObserve
OpenTelemetry-native observability for agents and LLMs.