










“OpenObserve helped us migrate from Datadog in under an hour... reducing observability costs by 4x.”

4x
Lower observability cost

< 1 hour
Migrated off Datadog

Flat pricing
No month-end surprises
One ARM template builds the Event Hub path. Stop paying per GB to read your own data.
Stream Azure subscription activity logs via Event Hub. The ARM template sets up the infrastructure.
Creates an Event Hub namespace, Event Hub and all required resources in your subscription.
Deploy to Azurehttps://api.openobserve.ai/azure/<org-id>Access Key: ••••••••••••••••
o2-activityOne ARM template builds the Event Hub path. Nothing to install in your subscriptions.
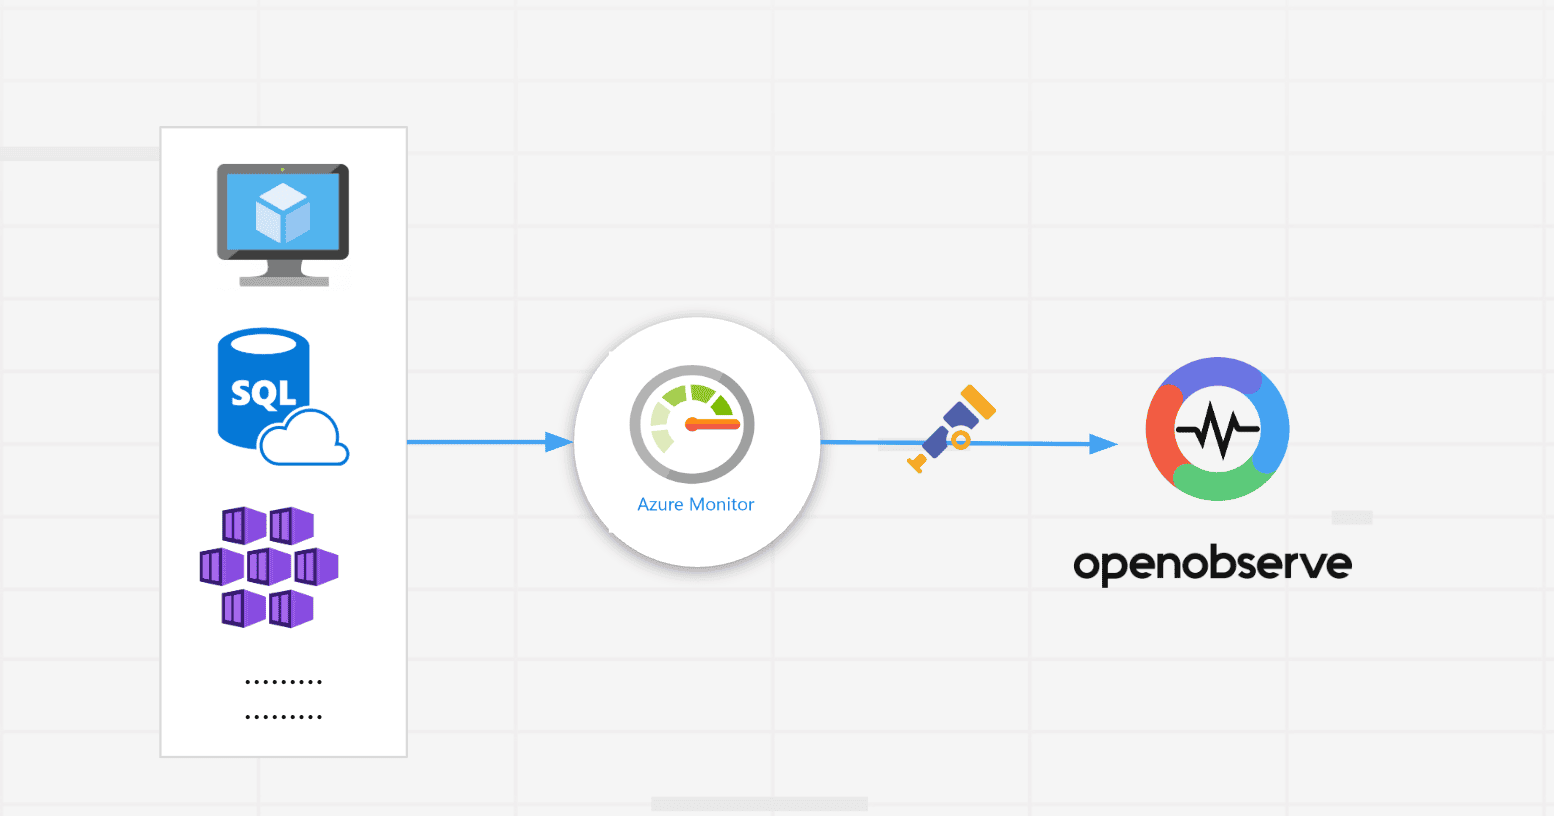
Connect your Azure estate in minutes. OpenObserve ingests directly from the services you already run - no agents, no custom glue code.












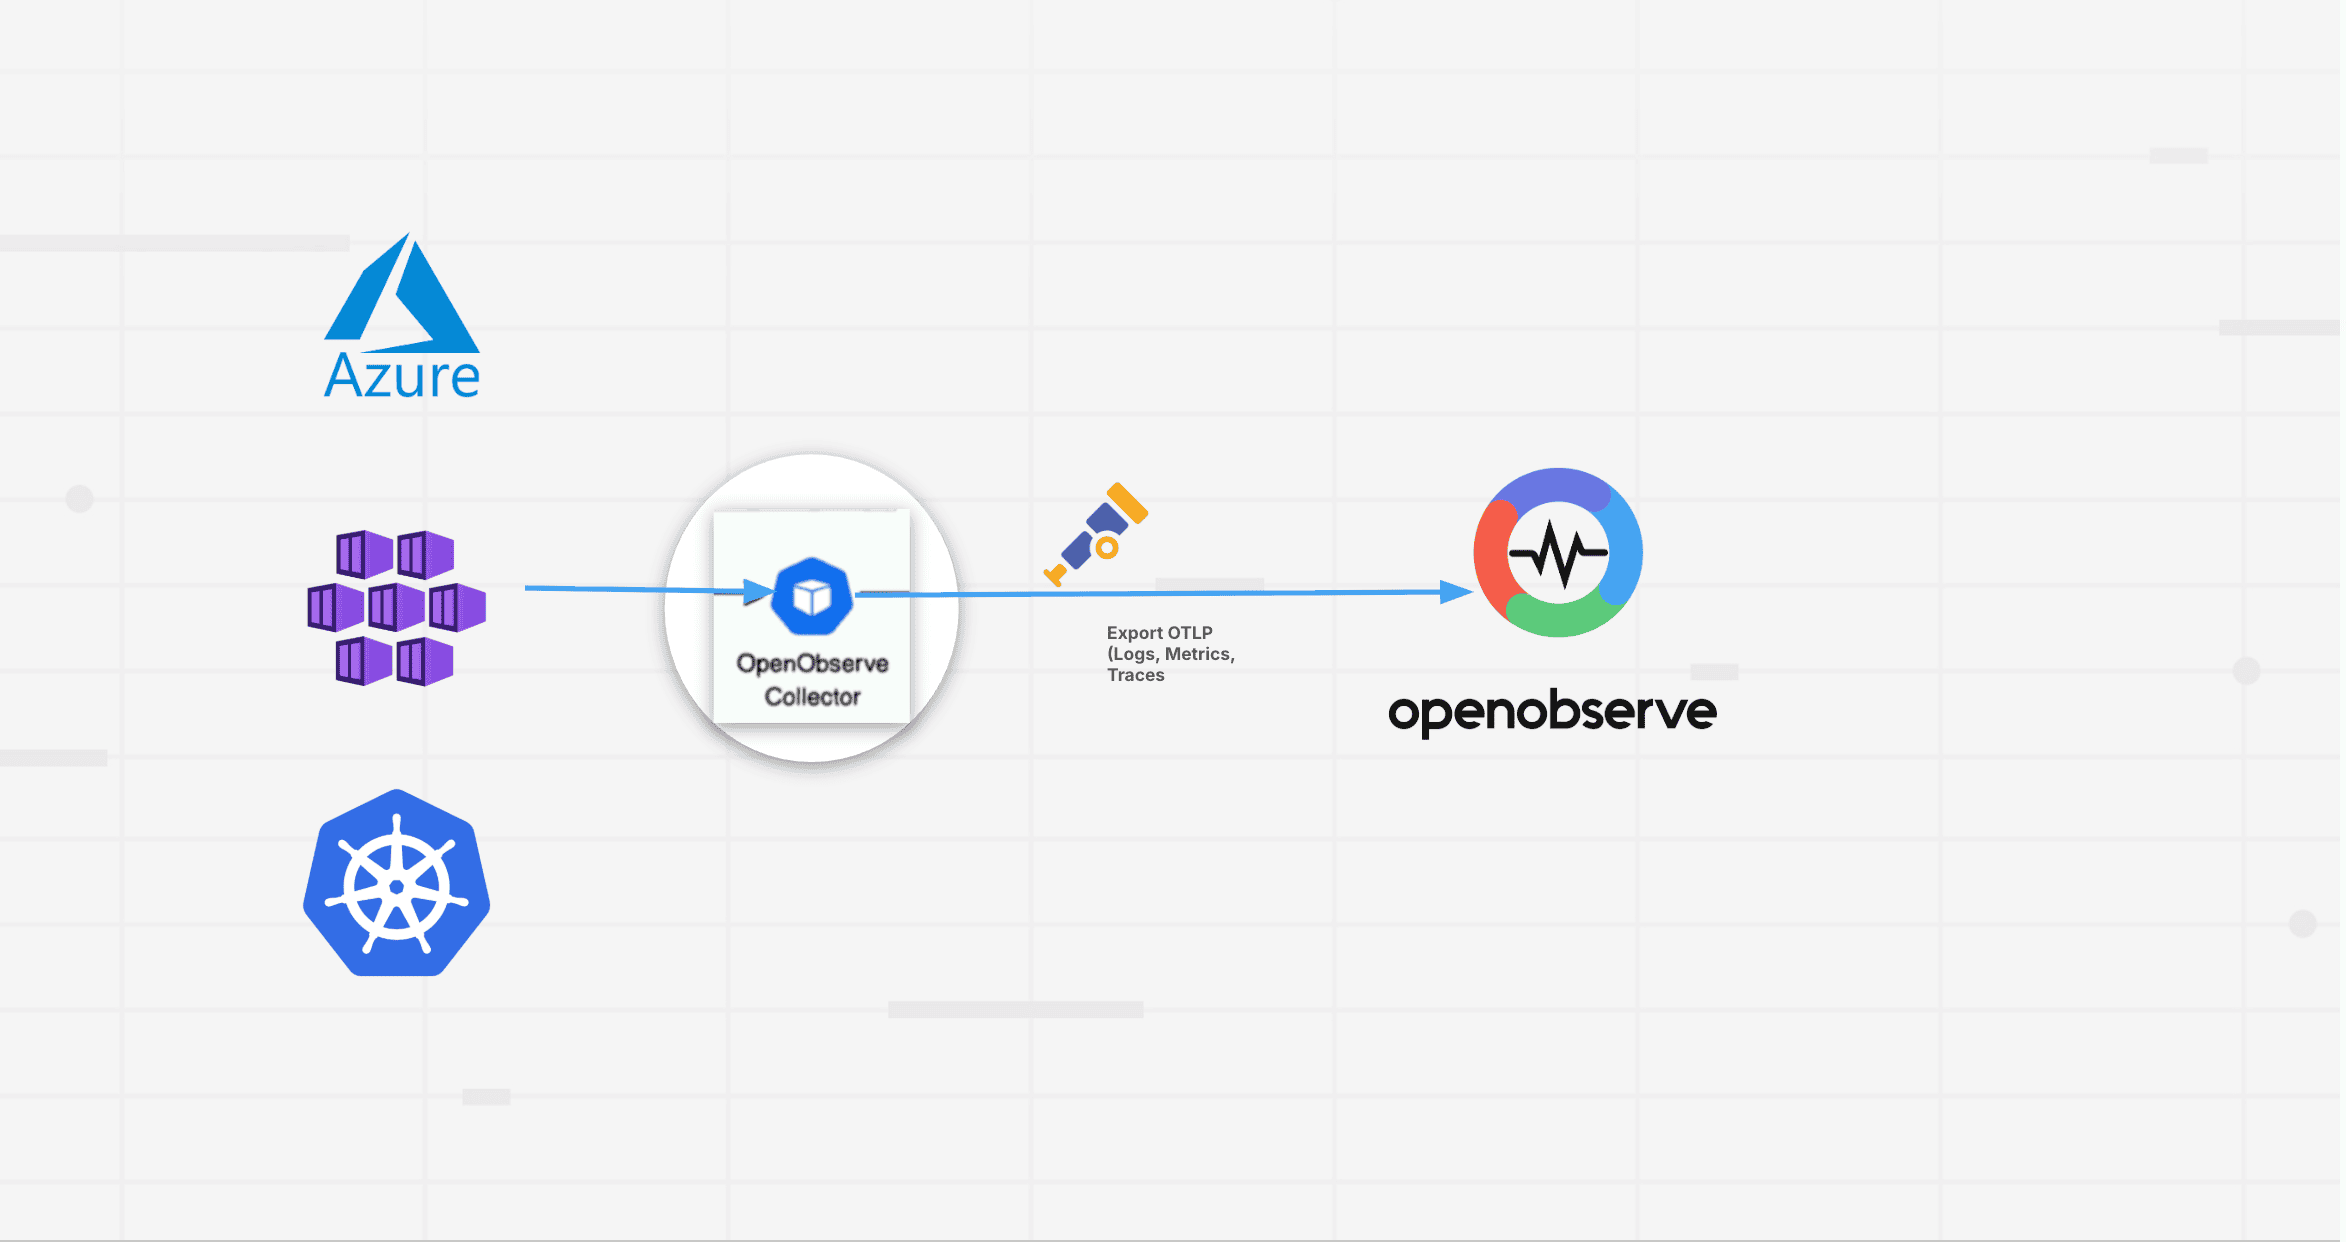
An ARM template provisions the Event Hub namespace and every resource needed, nothing built by hand.
Route Activity and diagnostic logs to the Event Hub in a few clicks.
Query Azure telemetry the same way you query everything else, no separate KQL skill set required.
Provision everything Azure monitoring needs without building it by hand. One ARM template creates the Event Hub namespace and every required resource.
Start sending Activity Logs to OpenObserve in a few clicks. No manual resource wiring in the Azure portal.
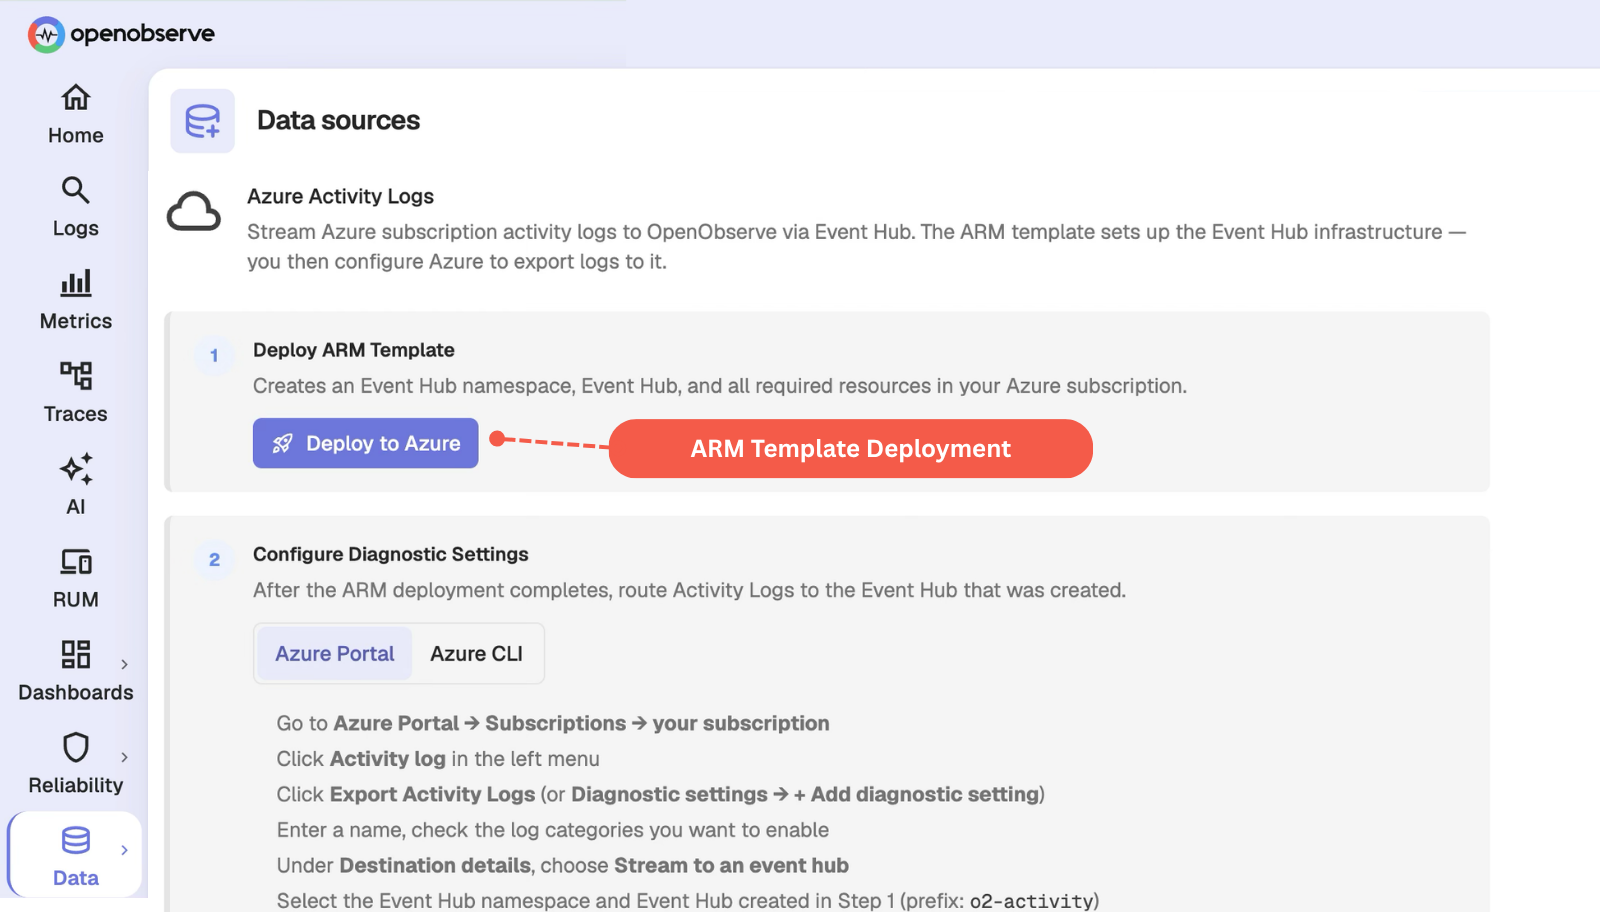
Send Activity Logs and diagnostic logs to the Event Hub without building a custom pipeline.
See Azure Kubernetes Service clusters alongside the rest of your Kubernetes estate instead of monitoring them in isolation.
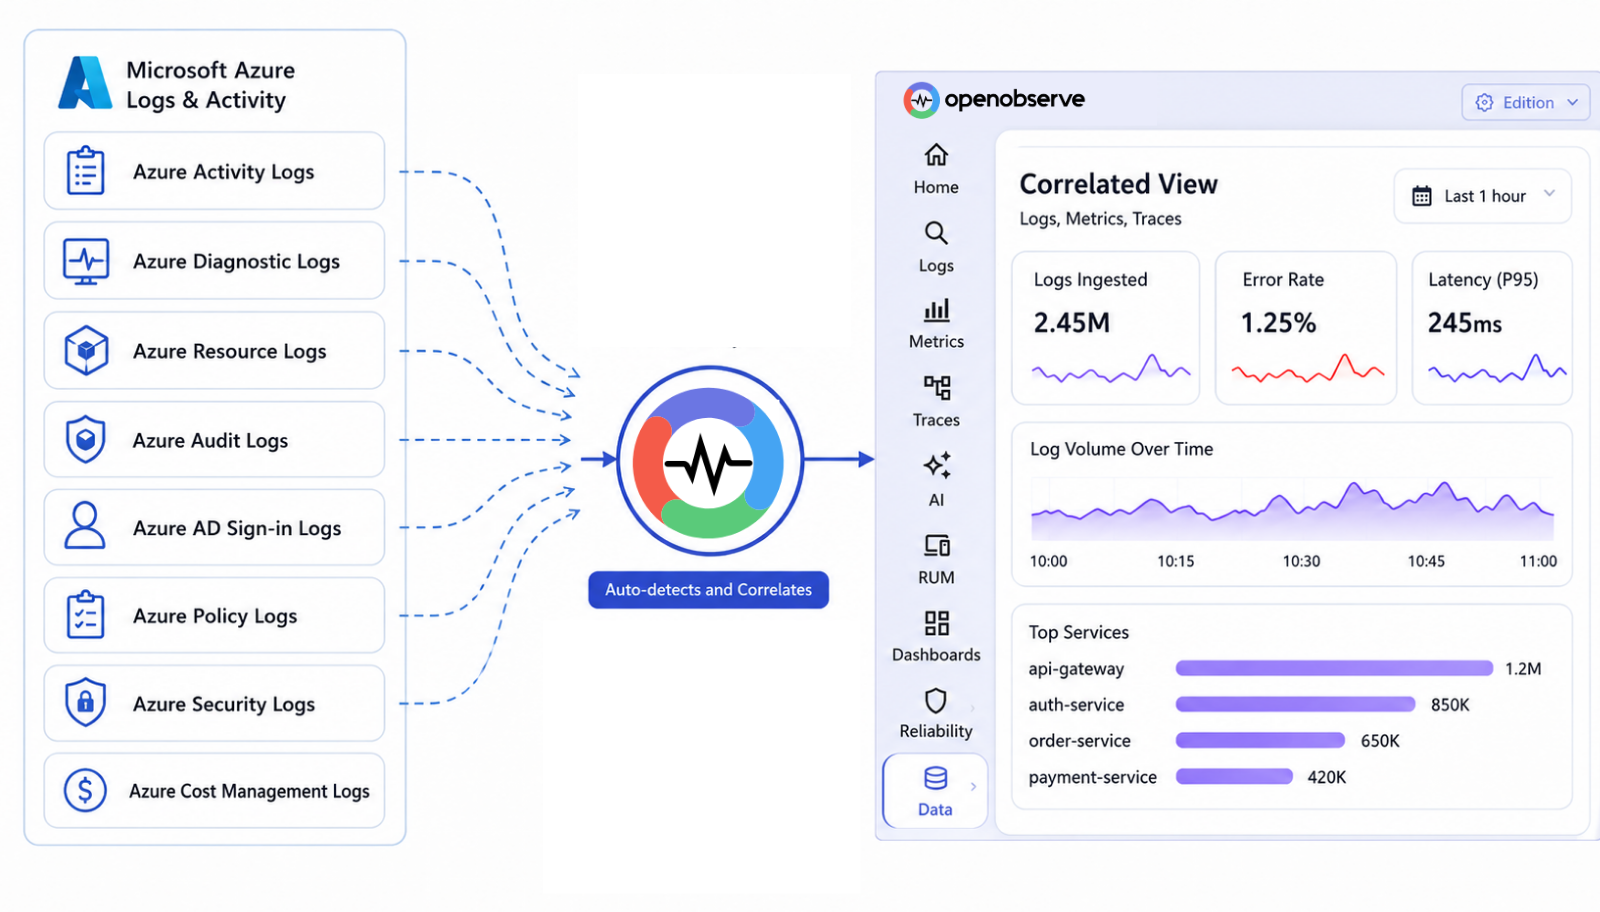
Query your Azure telemetry without paying per gigabyte read. Log Analytics-style per-GB pricing doesn’t apply.
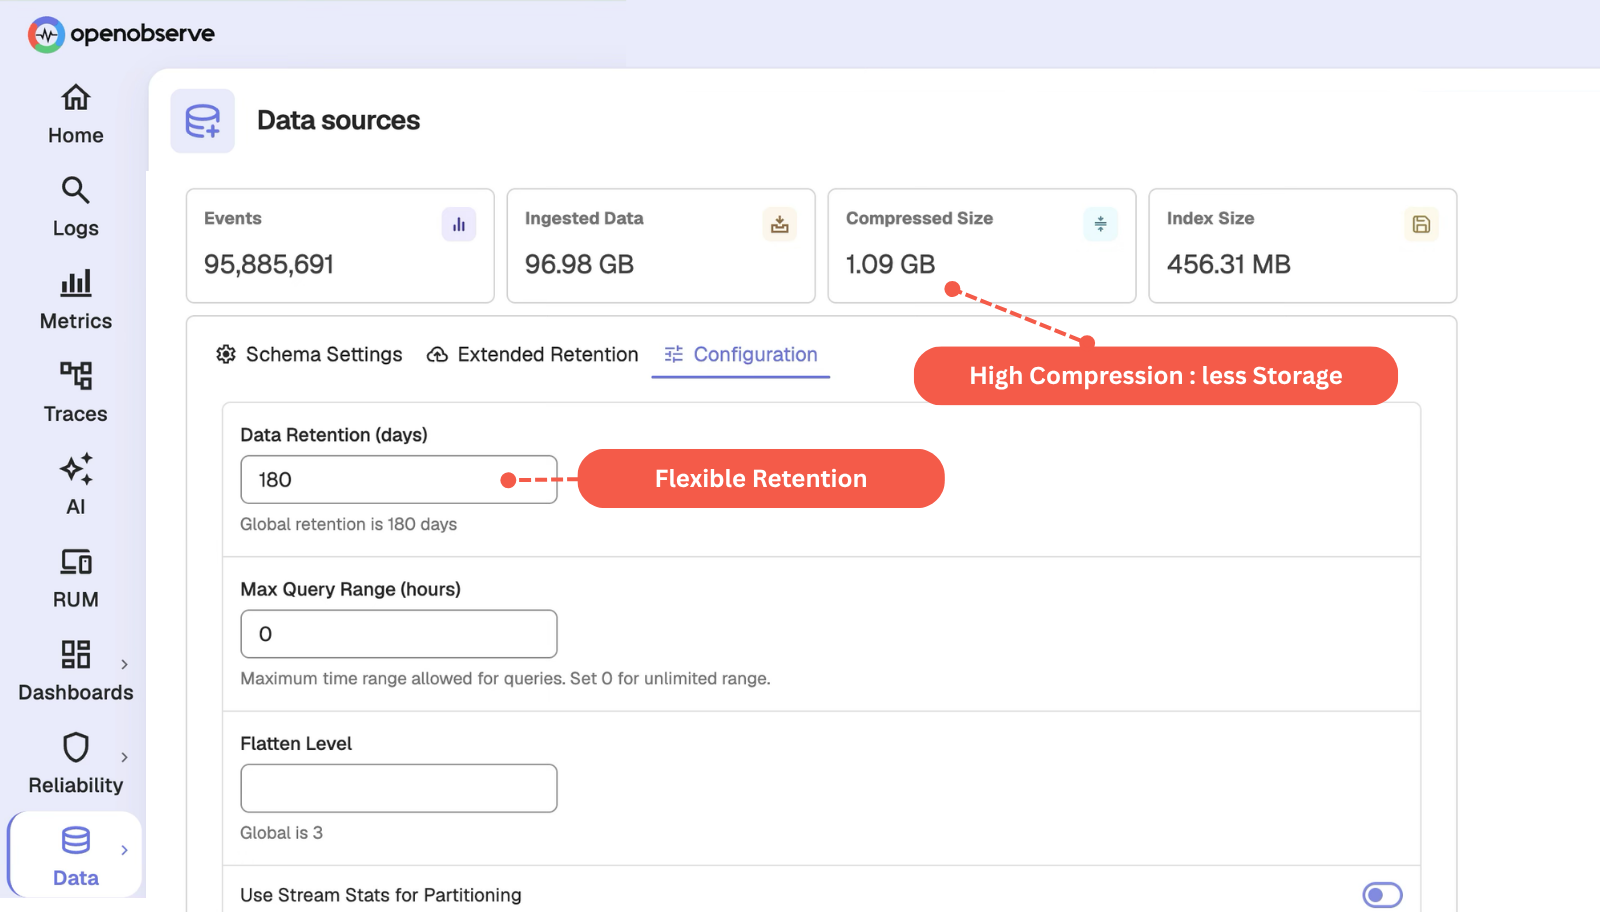
Keep longer Azure retention windows without the storage bill growing at the same rate.
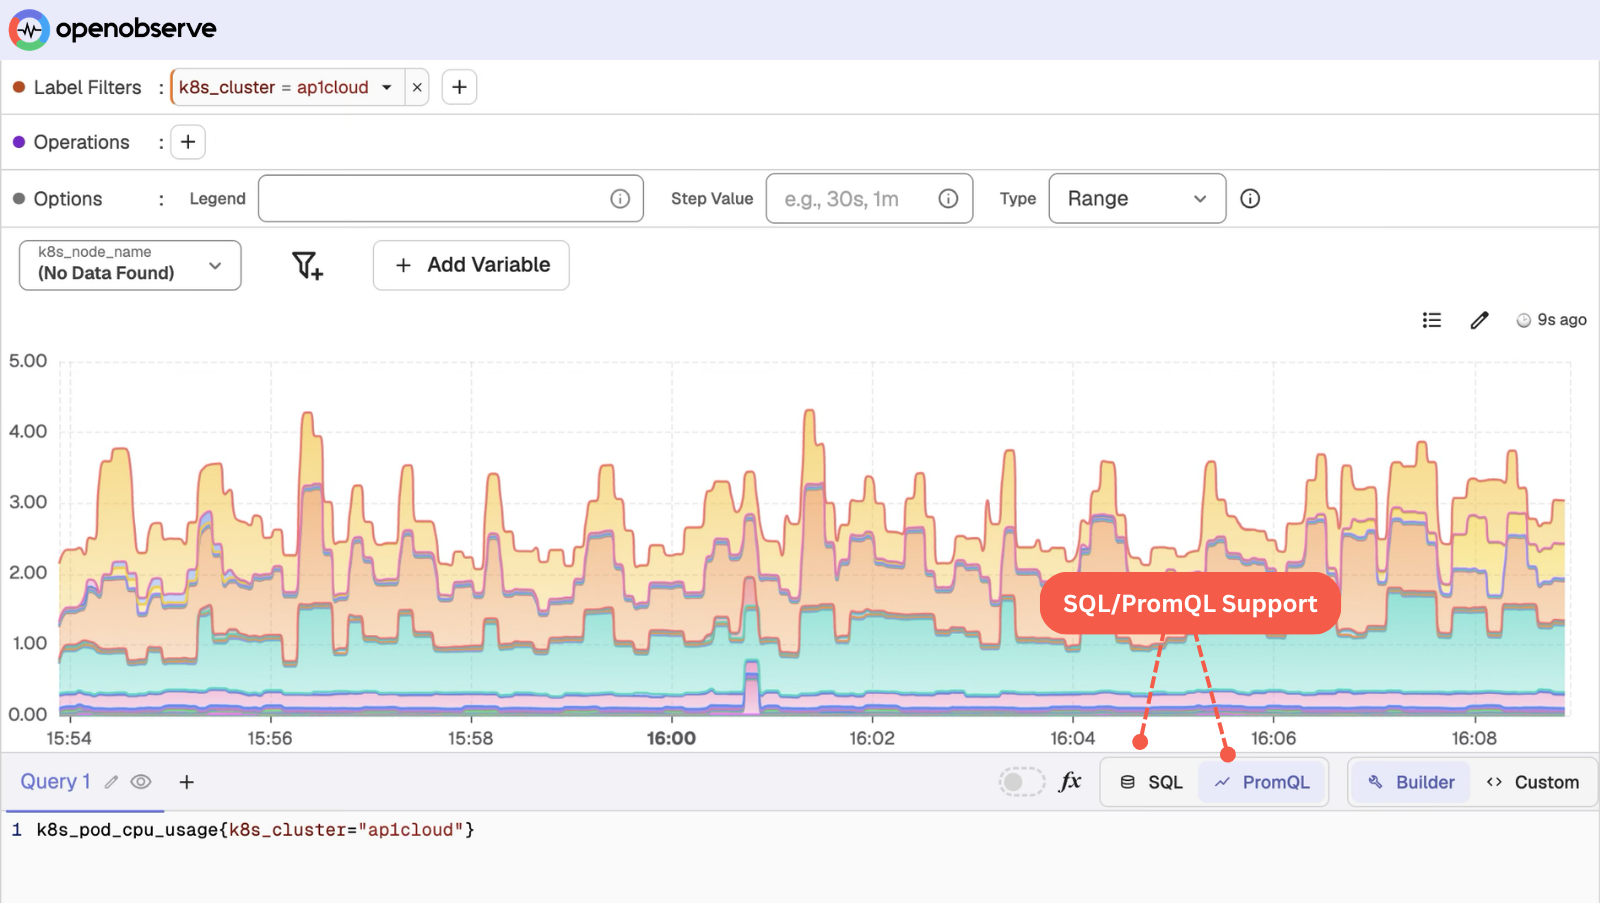
Query Azure telemetry the same way you query AWS, GCP, and on-prem data.
Keep using the SQL and PromQL skills your team already has.
Same telemetry, same workloads, one platform. Every number is OpenObserve against a named vendor - not an industry average.
vs. Datadog
8×
more cost-effective
8x cost reduction means you can unify your observability into a single platform.
vs. Elastic
140×
storage efficiency
140x storage means longer retention doesn't necessarily mean expensive bills.
vs. Grafana stack
5–15×
faster performance
5x to 15x faster queries mean dashboards load in milliseconds, not minutes.
See how much you'd save switching today.
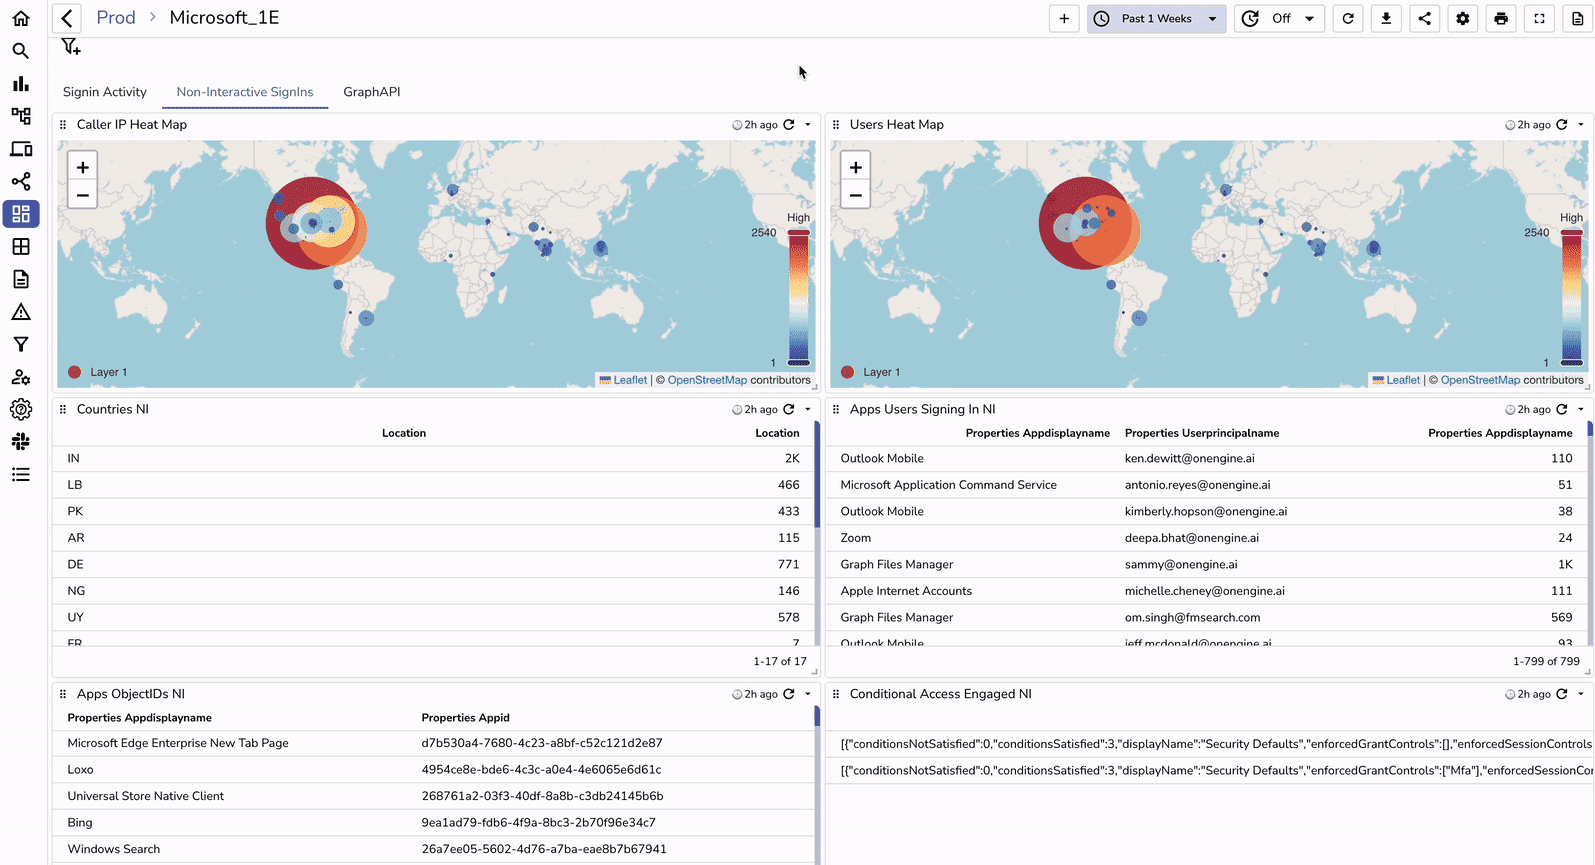
Correlate between the environments and signals across various sources with OpenObserve built-in correlation engine.
“OpenObserve helped us migrate from Datadog in under an hour... reducing observability costs by 4x.”
4x
Lower observability cost
< 1 hour
Migrated off Datadog
Flat pricing
No month-end surprises
From zero to Azure dashboards in minutes - no agents to babysit, no pipelines to wire by hand.
See the guideSpin up a in the region closest to you.
Point Azure Monitor or Event Hubs at OpenObserve and load prebuilt Azure dashboards in a couple of clicks.
Watch logs, metrics, and traces stream in - correlated and query-ready from the first event.
to help you get the most out of Azure monitoring.
Monitor every Azure service you run with prebuilt dashboards, metrics, and alerting rules. Pick the plan that fits your team.
Self-hosted Enterprise, free up to 50GB. Advanced features for growing teams.
Fully managed OpenObserve in the cloud. Start with a free trial - no infrastructure to run.
Enterprise-grade support, SSO, and SLAs for large-scale, multi-region deployments.

AI Observability by OpenObserve
OpenTelemetry-native observability for agents and LLMs.