Introducing the OpenObserve Kubernetes Operator: Observability as Code





Ready to get started?
Try OpenObserve Cloud today for more efficient and performant observability.
Introducing the OpenObserve Kubernetes Operator: Observability as Code
TL;DR: The OpenObserve Kubernetes Operator brings Infrastructure as Code principles to your observability stack. Manage alerts, pipelines, functions, destinations, and templates as native Kubernetes resources with GitOps workflows. Available in OpenObserve Enterprise Edition, free for up to 50GB ingestion per day.
The Challenge: Managing Observability at Scale
Platform teams scaling Kubernetes deployments face a specific problem: managing observability configurations across environments creates operational overhead. Manual UI configuration or API scripts lead to:
- Configuration drift across dev, test, and prod environments
- No version control for critical alert definitions
- Manual, error-prone deployments
- Difficulty auditing changes to monitoring rules
- Inconsistent practices across teams
Organizations need to manage observability the same way they manage applications: declaratively, with version control, and automated deployments.
Enter Observability as Code
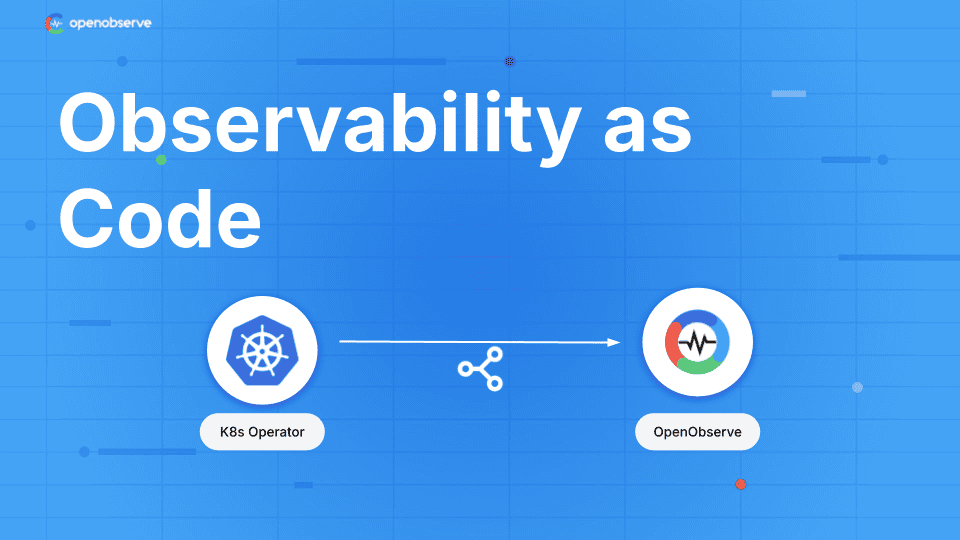
The OpenObserve Kubernetes Operator (o2-k8s-operator) transforms observability management into a Kubernetes-native experience. Define your entire observability stack as YAML manifests. Version control everything. Deploy with GitOps tools like ArgoCD or Flux.
Key capabilities:
Fully Declarative: Define alerts, pipelines, functions, templates, and destinations as YAML. No UI clicking or ad-hoc scripts.
GitOps Ready: Version control everything. Review changes through pull requests. Automate deployments with CI/CD pipelines.
Multi-Instance Support: Manage multiple OpenObserve Enterprise instances (dev, test, prod) from a single Kubernetes cluster with isolated configurations.
Real-Time Status: Get instant feedback on sync status, errors, and resource health through Kubernetes status conditions.
Important: The operator works exclusively with OpenObserve Enterprise Edition. Enterprise includes 50GB/day free tier.
Six Custom Resources for Complete Control
The operator introduces six Custom Resource Definitions (CRDs):
1. OpenObserveConfig - Connection Management
Connect to OpenObserve Enterprise instances with secure credential handling:
apiVersion: openobserve.ai/v1alpha1
kind: OpenObserveConfig
metadata:
  name: production
spec:
  endpoint: https://api.openobserve.ai
  organization: my-org
  credentialsSecretRef:
    name: o2-credentials
  tlsVerify: true
2. Alert - Intelligent Monitoring
Define alerts with SQL or PromQL queries, flexible scheduling, and deduplication:
apiVersion: openobserve.ai/v1alpha1
kind: Alert
metadata:
  name: high-error-rate
spec:
  configRef:
    name: production
  streamName: application-logs
  streamType: logs
  enabled: true
  queryCondition:
    type: custom
    sql: "SELECT COUNT(*) as count FROM default WHERE level='error'"
    aggregation:
      function: count
      having:
        column: count
        operator: GreaterThan
        value: 100
  duration: 5
  frequency: 1
  destinations:
    - slack-alerts
3. AlertTemplate - Notification Formatting
Create reusable templates for Slack, PagerDuty, email, or webhooks:
apiVersion: openobserve.ai/v1alpha1
kind: OpenObserveAlertTemplate
metadata:
  name: slack-template
spec:
  configRef:
    name: production
  name: slack-webhook-template
  type: http
  title: "🚨 Alert: {alert_name}"
  body: |
    {
      "text": "Alert Triggered",
      "blocks": [
        {
          "type": "section",
          "text": {
            "type": "mrkdwn",
            "text": "*Alert:* {alert_name}\n*Stream:* {stream_name}\n*Time:* {triggered_at}"
          }
        }
      ]
    }
4. Destination - Alert Routing
Route alerts to Slack, PagerDuty, email, SNS, Splunk, Elasticsearch, and more:
apiVersion: openobserve.ai/v1alpha1
kind: OpenObserveDestination
metadata:
  name: slack-alerts
spec:
  configRef:
    name: production
  name: slack-destination
  type: http
  url: https://hooks.slack.com/services/YOUR/WEBHOOK/URL
  method: post
  headers:
    Content-Type: application/json
  template: slack-template
5. Function - Data Transformation
Write VRL (Vector Remap Language) functions with built-in testing:
apiVersion: openobserve.ai/v1alpha1
kind: OpenObserveFunction
metadata:
  name: data-enricher
spec:
  configRef:
    name: production
  name: enrich-logs
  function: |
    .processed_at = now()
    .environment = "production"
    if exists(.error) {
      .severity = "high"
    }
    .
  test:
    enabled: true
    input:
      - error: "Connection timeout"
        message: "Service unavailable"
    output:
      - error: "Connection timeout"
        message: "Service unavailable"
        processed_at: "2024-01-01T00:00:00Z"
        environment: "production"
        severity: "high"
6. Pipeline - Data Processing
Build data processing pipelines with node-based architecture:
apiVersion: openobserve.ai/v1alpha1
kind: OpenObservePipeline
metadata:
  name: error-log-processor
spec:
  configRef:
    name: production
  name: error-log-processor
  description: "Process error logs and route to multiple destinations"
  enabled: true
  org: default

  # Real-time source
  source:
    streamName: "application-logs"
    streamType: "logs"
    sourceType: "realtime"

  # Processing nodes
  nodes:
    - id: "filter-errors"
      type: "condition"
      config:
        conditions:
          or:
            - column: "level"
              operator: "="
              value: "error"
            - column: "status_code"
              operator: ">="
              value: "500"

    - id: "enrich-data"
      type: "function"
      config:
        function: "log-enricher"

    - id: "error-output"
      type: "stream"
      config:
        org_id: "default"
        stream_name: "critical_errors"
        stream_type: "logs"

  # Data flow
  edges:
    - source: "source"
      target: "filter-errors"
    - source: "filter-errors"
      target: "enrich-data"
      condition: true
    - source: "enrich-data"
      target: "error-output"
Pipeline capabilities:
- Real-time and scheduled data processing
- Query-based sources (SQL, PromQL)
- Multi-node processing chains
- Conditional routing and branching logic
- External destinations (Splunk, Elasticsearch, Datadog)
Real-World Applications
GitOps-Driven Observability
Scenario: Platform team maintains consistent alerting across 50+ microservices in dev, test, and production.
Implementation:
- Store alert definitions in Git with application code
- Deploy alerts automatically via ArgoCD when merging changes
- Review alert modifications through pull requests
- Rollback problematic alerts with
git revert
Result: Zero configuration drift, full audit trail, 90% reduction in alert management overhead.
Multi-Tenant Management
Scenario: SaaS platform needs isolated observability per customer environment.
Implementation:
- Deploy one OpenObserveConfig per customer namespace
- Use namespace isolation for tenant-specific alerts and pipelines
- Share common functions and templates across namespaces
- Manage everything from a single cluster
Result: Secure multi-tenancy with simplified operations.
Automated Incident Response
Scenario: DevOps team needs alerts to create PagerDuty incidents, post to Slack, and send email summaries.
Implementation:
- Define alert templates for each notification channel
- Create destinations for PagerDuty, Slack, and email
- Reference all destinations in a single alert definition
- Operator handles synchronization and delivery
Result: Consistent notifications across all channels with zero manual configuration.
Enterprise Features
Security
- Credentials stored as Kubernetes Secrets
- TLS security with auto-generated certificates
- RBAC controls for granular permission management
- Non-root containers with read-only filesystem
- Pod security contexts and resource limits
Performance & Scalability
- High availability with 2-replica deployment and leader election
- Configurable concurrency per resource type
- Rate limiting to protect OpenObserve API
- Efficient HTTP connection pooling
- Fine-tuned CPU and memory limits
Performance tuning (via ConfigMap):
 ALERT_CONTROLLER_CONCURRENCY: "5"
  O2_RATE_LIMIT_RPS: "50"
  O2_MAX_CONNS_PER_HOST: "20"
Observability
- Health probes:
/healthz,/readyz,/startup - Prometheus metrics at
/metrics - Real-time sync status with detailed conditions
- Kubernetes events for important operations
Getting Started
Prerequisites
- Kubernetes cluster 1.21+
- OpenObserve Enterprise Edition
- kubectl access
Deploy in 5 Minutes
1. Deploy the operator:
git clone https://github.com/openobserve/o2-k8s-operator
 cd o2-k8s-operator
 ./deploy.sh
2. Configure connection:
kubectl apply -f configs/prod/o2prod-config.yaml
3. Deploy your first alert:
kubectl apply -f samples/alerts/high-cpu-alert.yaml
4. Check status:
kubectl get alerts
kubectl describe alert high-cpu-alert
Your alert now syncs automatically with OpenObserve Enterprise.
How It Works: Continuous Reconciliation
The operator ensures your desired state (Kubernetes resources) matches actual state (OpenObserve configurations):
- Watch: Monitors Kubernetes API for resource changes
- Reconcile: Syncs changes to OpenObserve Enterprise
- Update Status: Reports success or errors
- Retry: Automatic retry with exponential backoff on failures
Zero-downtime updates:
- Rolling deployments for operator upgrades
- Leader election prevents split-brain scenarios
- PodDisruptionBudget ensures availability during maintenance
- Anti-affinity rules spread replicas across nodes
Why Observability as Code Matters
The operator shifts observability management from manual to automated:
✅ Manual → Automated ✅ GUI-driven → Code-driven ✅ Scattered → Centralized ✅ Undocumented → Version-controlled ✅ Fragile → Reliable
Platform teams apply the same engineering practices to observability that they use for applications: code review, testing, CI/CD, and automated rollbacks.
Resources
Documentation:
Community:
- Report issues: GitHub Issues
- Join discussion: OpenObserve Community
- Sample configurations: GitHub samples/
Conclusion
The OpenObserve Kubernetes Operator (v1.0.6) brings observability as code to platform engineering teams. Whether managing a small development cluster or observability at scale across hundreds of services, the operator provides the foundation for reliable, automated, and auditable operations.
Get Started with OpenObserve: https://openobserve.ai/downloads/
About the Authors
Md Mosaraf
I'm a Solution Architect and Observability Engineer with over 10 years of experience helping organizations build resilient, transparent systems. As a Certified Splunk Consultant, I've spent my career turning data into actionable insights that drive real business outcomes. I'm passionate about open source observability tools and believe that robust monitoring is the foundation of modern infrastructure. I share practical strategies, lessons learned, and hands-on guidance from the trenches of enterprise observability
Manas Sharma


Manas is a passionate Dev and Cloud Advocate with a strong focus on cloud-native technologies, including observability, cloud, kubernetes, and opensource. building bridges between tech and community.