DataDog vs OpenObserve Part 3: Traces & APM Comparison




Ready to get started?
Try OpenObserve Cloud today for more efficient and performant observability.
DataDog vs OpenObserve Part 3: Traces & APM: OTel Native, No Hidden Tiers, Up to 90% Cost Savings
DataDog charges per APM host, per indexed span, with automatic premium tiers for LLM traces. OpenObserve flips this model: predictable costs, SQL queries for trace visualization, no feature-based pricing. Same distributed tracing capabilities and up to 90% lower costs.
Beyond pricing, query flexibility and feature transparency matter. SQL support for trace dashboards, automatic span indexing, and OpenTelemetry-native compatibility directly impact how teams debug distributed systems and visualize trace data.
This hands-on comparison tests DataDog and OpenObserve as APM and distributed tracing platforms, sending identical production-like trace data to both platforms simultaneously. The results show how these platforms handle LLM observability, span indexing, trace search, and cost structure with the same production-like data.
Evereve, a fashion retail company, achieved 90% cost savings migrating from DataDog to OpenObserve for their full observability stack. They didn't sacrifice visibility but instead eliminated automatic premium tier surprises. Full trace retention, SQL-based dashboards, and accurate cost forecasting became possible.
This is Part 3 in a series comparing DataDog and OpenObserve for observability(security use cases excluded):
- Full comparison
- Part 1: Logs - Automatic Field Discovery, SQL Queries, and 90% Cost Savings
- Part 2: Metrics - Drag & Drop, SQL, PromQL, High Cardinality
- Part 3: Traces/APM- OTel Native, No Hidden Tiers
- Part 4: Dashboards- Prebuilt, Drag & Drop, Custom
- Part 5: Alerts, Monitors, Destinations
- Part 6: Real User Monitoring
- Part 7: Pipelines
- Part 8: IAM (SSO, RBAC)
- Part 9: Cost
TL;DR: 8 Key Findings
- LLM Observability Premium: 232 LLM spans triggered $120/day automatic charge in DataDog. OpenObserve treats LLM traces as standard traces with no premium pricing.
- Span Indexing: DataDog charges per indexed span with retention filters. OpenObserve uses flat $0.50/GB for all spans with configurable retention.
- Service Maps: Both auto-generate service topology and dependencies. Feature parity.
- Trace Search: DataDog uses tag-based proprietary syntax. OpenObserve supports SQL queries plus UI filters.
- Error Tracking: Both identify errors, aggregate, and support root cause analysis. Feature parity.
- APM Host Charges: DataDog charges $36/day per APM host. OpenObserve has no per-host charges.
- OpenTelemetry Native: OpenObserve provides full OTel compatibility without proprietary agents. DataDog requires DataDog Agent for full functionality.
- Cost Reality: Teams are reducing their total cost of observability by 60-90% moving from DataDog to OpenObserve without sacrificing visibility.
What We Tested
The test used the OpenTelemetry Astronomy Shop demo: a 16-service microservices application with Kafka, PostgreSQL, Valkey cache, and an LLM service for AI-powered features.
Traces collected: HTTP server/client spans, database queries, cache operations, RPC calls, message queue spans, and 232 LLM API call spans.
Total: ~49,100 indexed spans across distributed traces.
All services used OpenTelemetry SDKs sending traces to the OTel Collector, which exported to both platforms simultaneously.
The $120/Day LLM Observability Charge
Modern applications integrate AI features: product recommendations, chat interfaces, content generation. These make API calls to LLM providers (OpenAI, Anthropic, Cohere, or self-hosted). When instrumented with OpenTelemetry, LLM calls generate traces like HTTP requests or database queries.
The test LLM service made 232 LLM spans. These included metadata identifying them as LLM API interactions (span names like llm.generate, attributes like llm.model, llm.prompt_tokens).
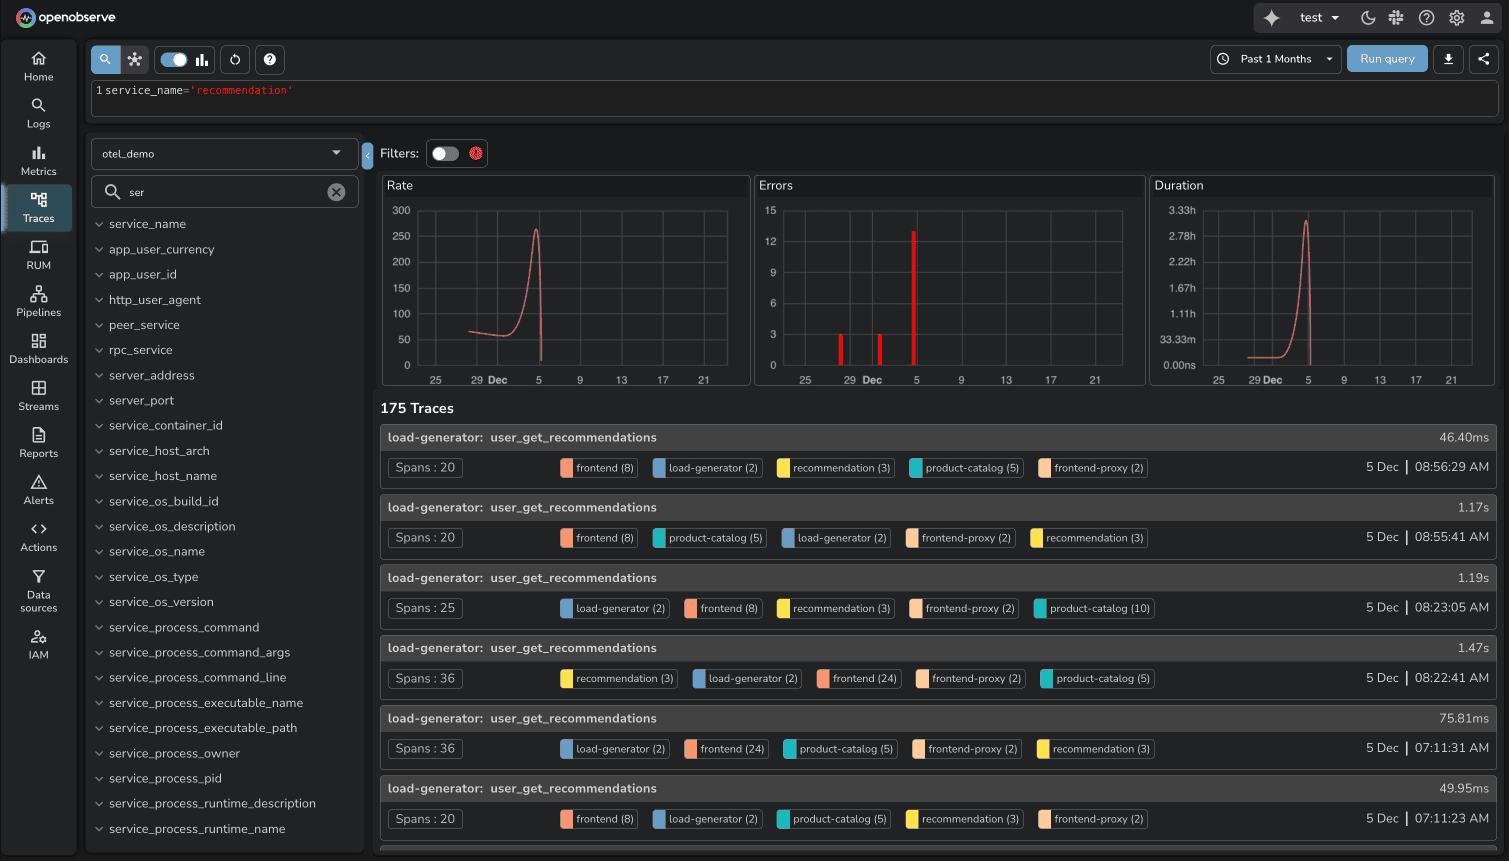
In OpenObserve, these appeared in the traces UI like any other span. Search, filter, analyze latency, view request flows. LLM traces are traces. No special classification. No premium pricing.
In DataDog, these 232 spans automatically activated LLM Observability, a premium feature. The cost: $120 per day.
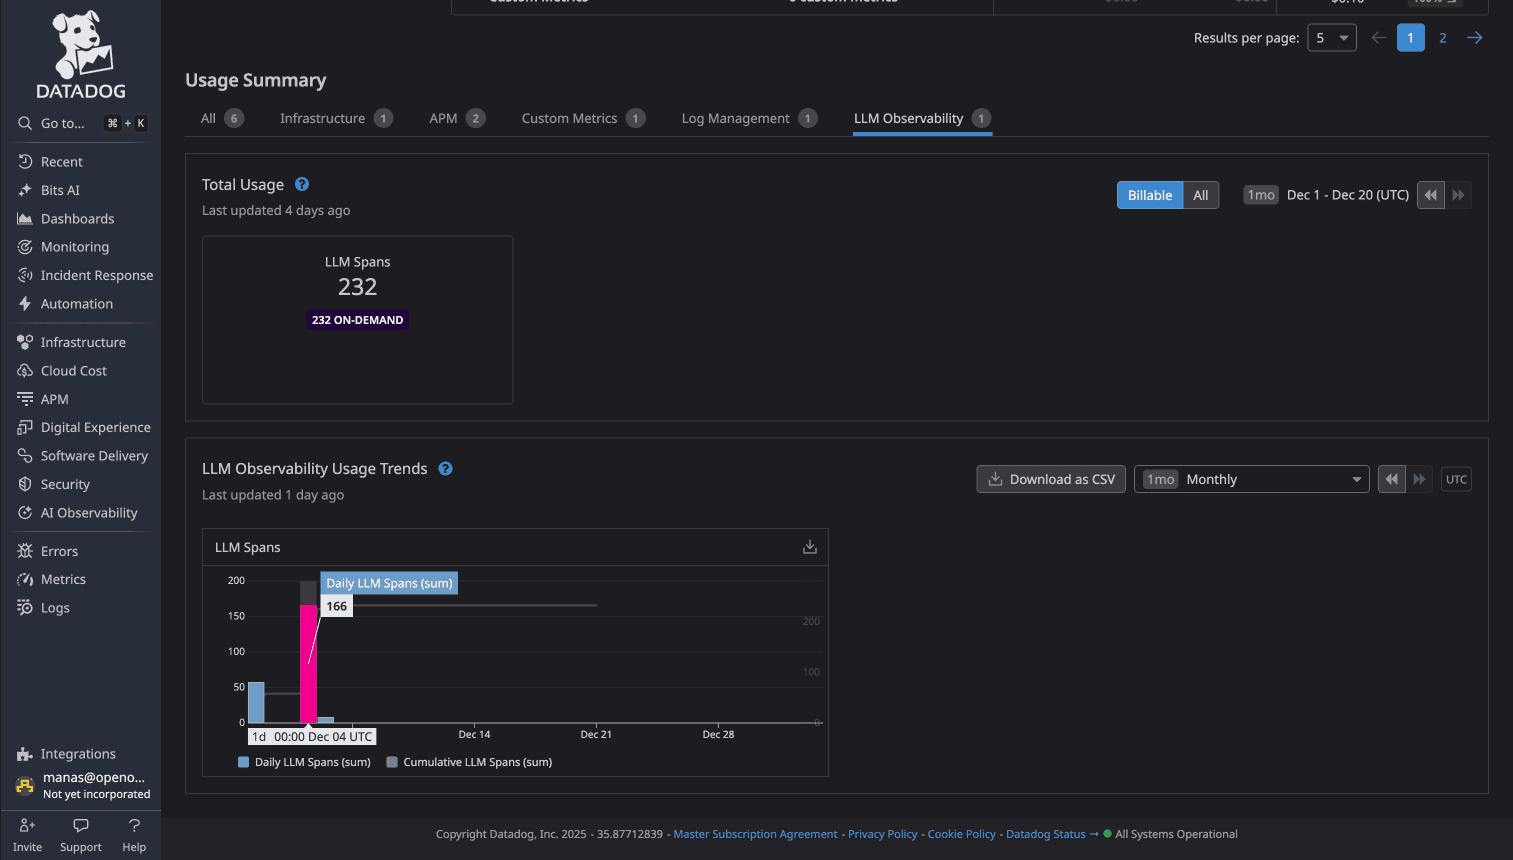
This activation happened automatically. No warning. No opt-in. DataDog detected LLM span attributes and enabled the premium feature. Over a month: $3,600 for LLM trace observability.
Why This Matters
The LLM charge illustrates feature-based tier pricing. Teams instrument services with OpenTelemetry expecting standard costs. Specific span types trigger premium charges.
This creates unpredictability: adding AI features adds $3,600/month in observability costs before the first production request.
OpenObserve eliminates feature tiers for traces. LLM spans, HTTP spans, database spans cost $0.50/GB ingested. Add AI features. Instrument with OpenTelemetry. Cost scales with data volume, not feature classification.
Span Indexing and Retention
DataDog uses retention filters to control which spans are indexed and searchable. Configure filters based on span attributes. Spans matching filters are indexed. Others are sampled or dropped.
In the test:
- APM Hosts: $36/day (1 host)
- Indexed Spans: 137 spans
The 137 indexed spans represent head-based sampling and retention filtering from ~49,100 total spans. DataDog's sampling reduced storage costs but limited trace visibility (99.7% of traces not searchable).
OpenObserve indexes all ingested spans at $0.50/GB. Configure retention per stream after ingestion. All spans are searchable during retention.
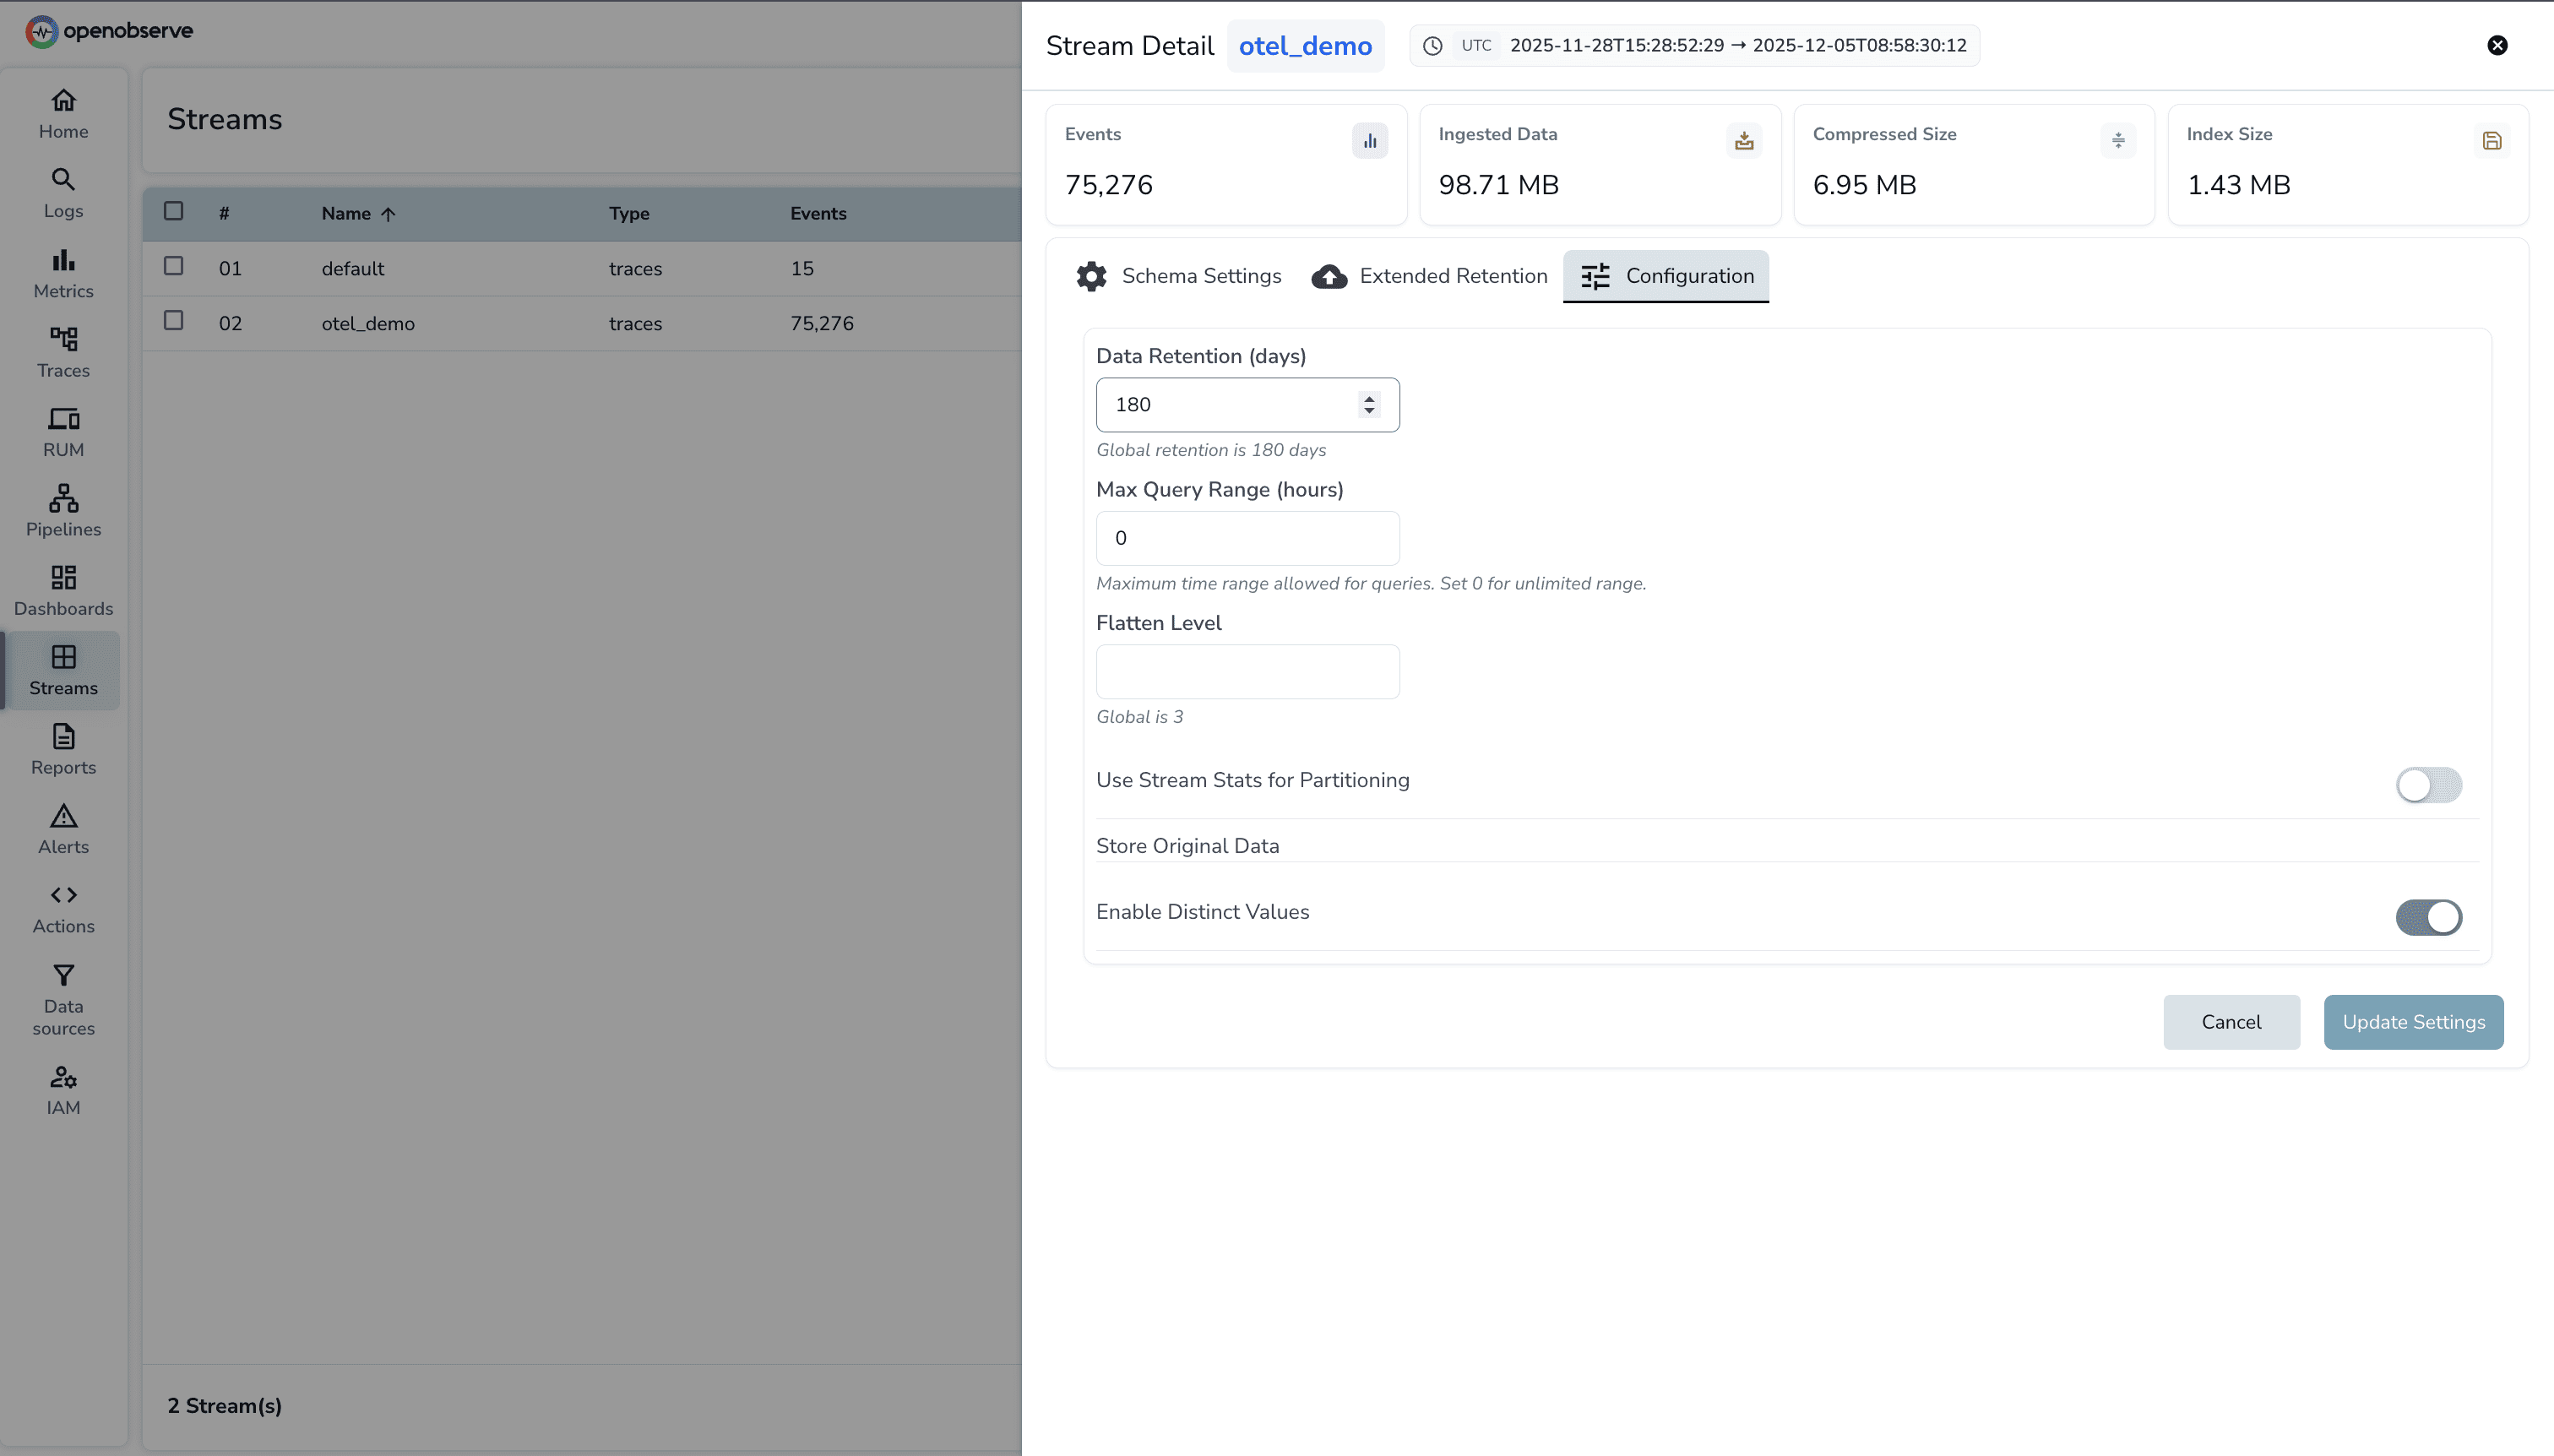
For debugging production issues, complete trace history matters. OpenObserve provides full visibility during configured retention windows.
Service Maps and Dependencies
Service Maps: OSS and Enterprise. Service Graph: Enterprise.
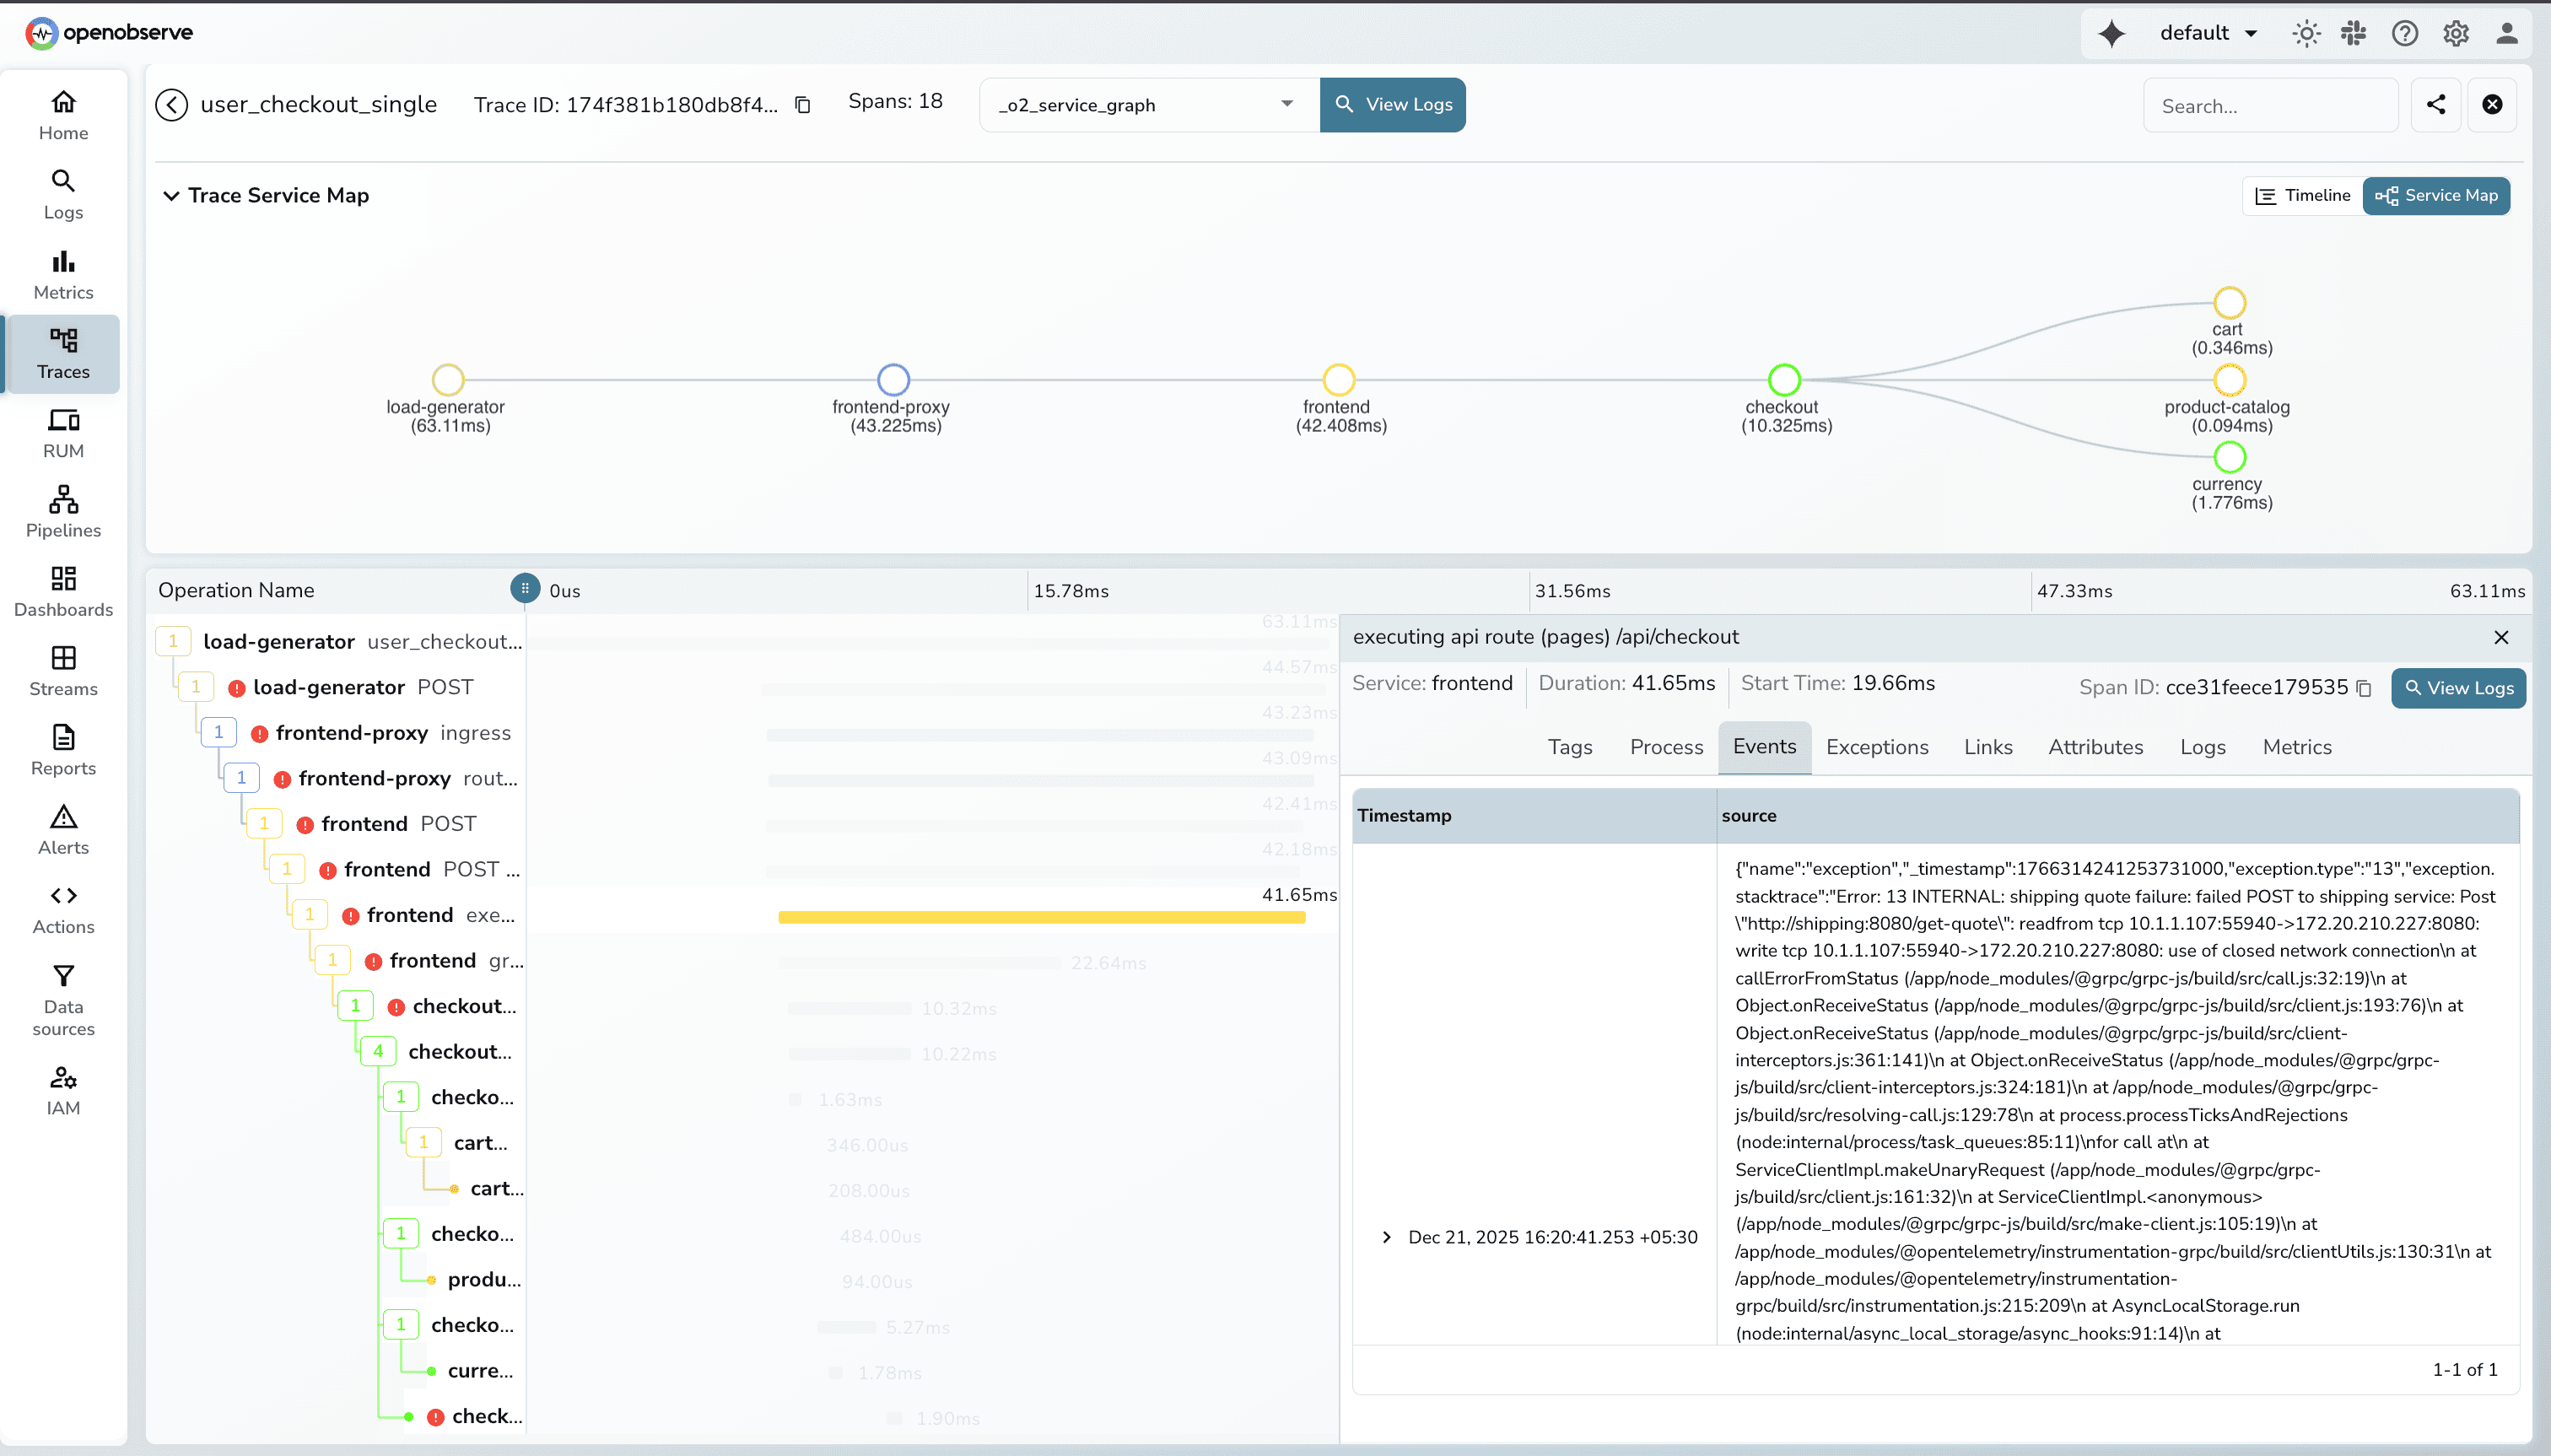
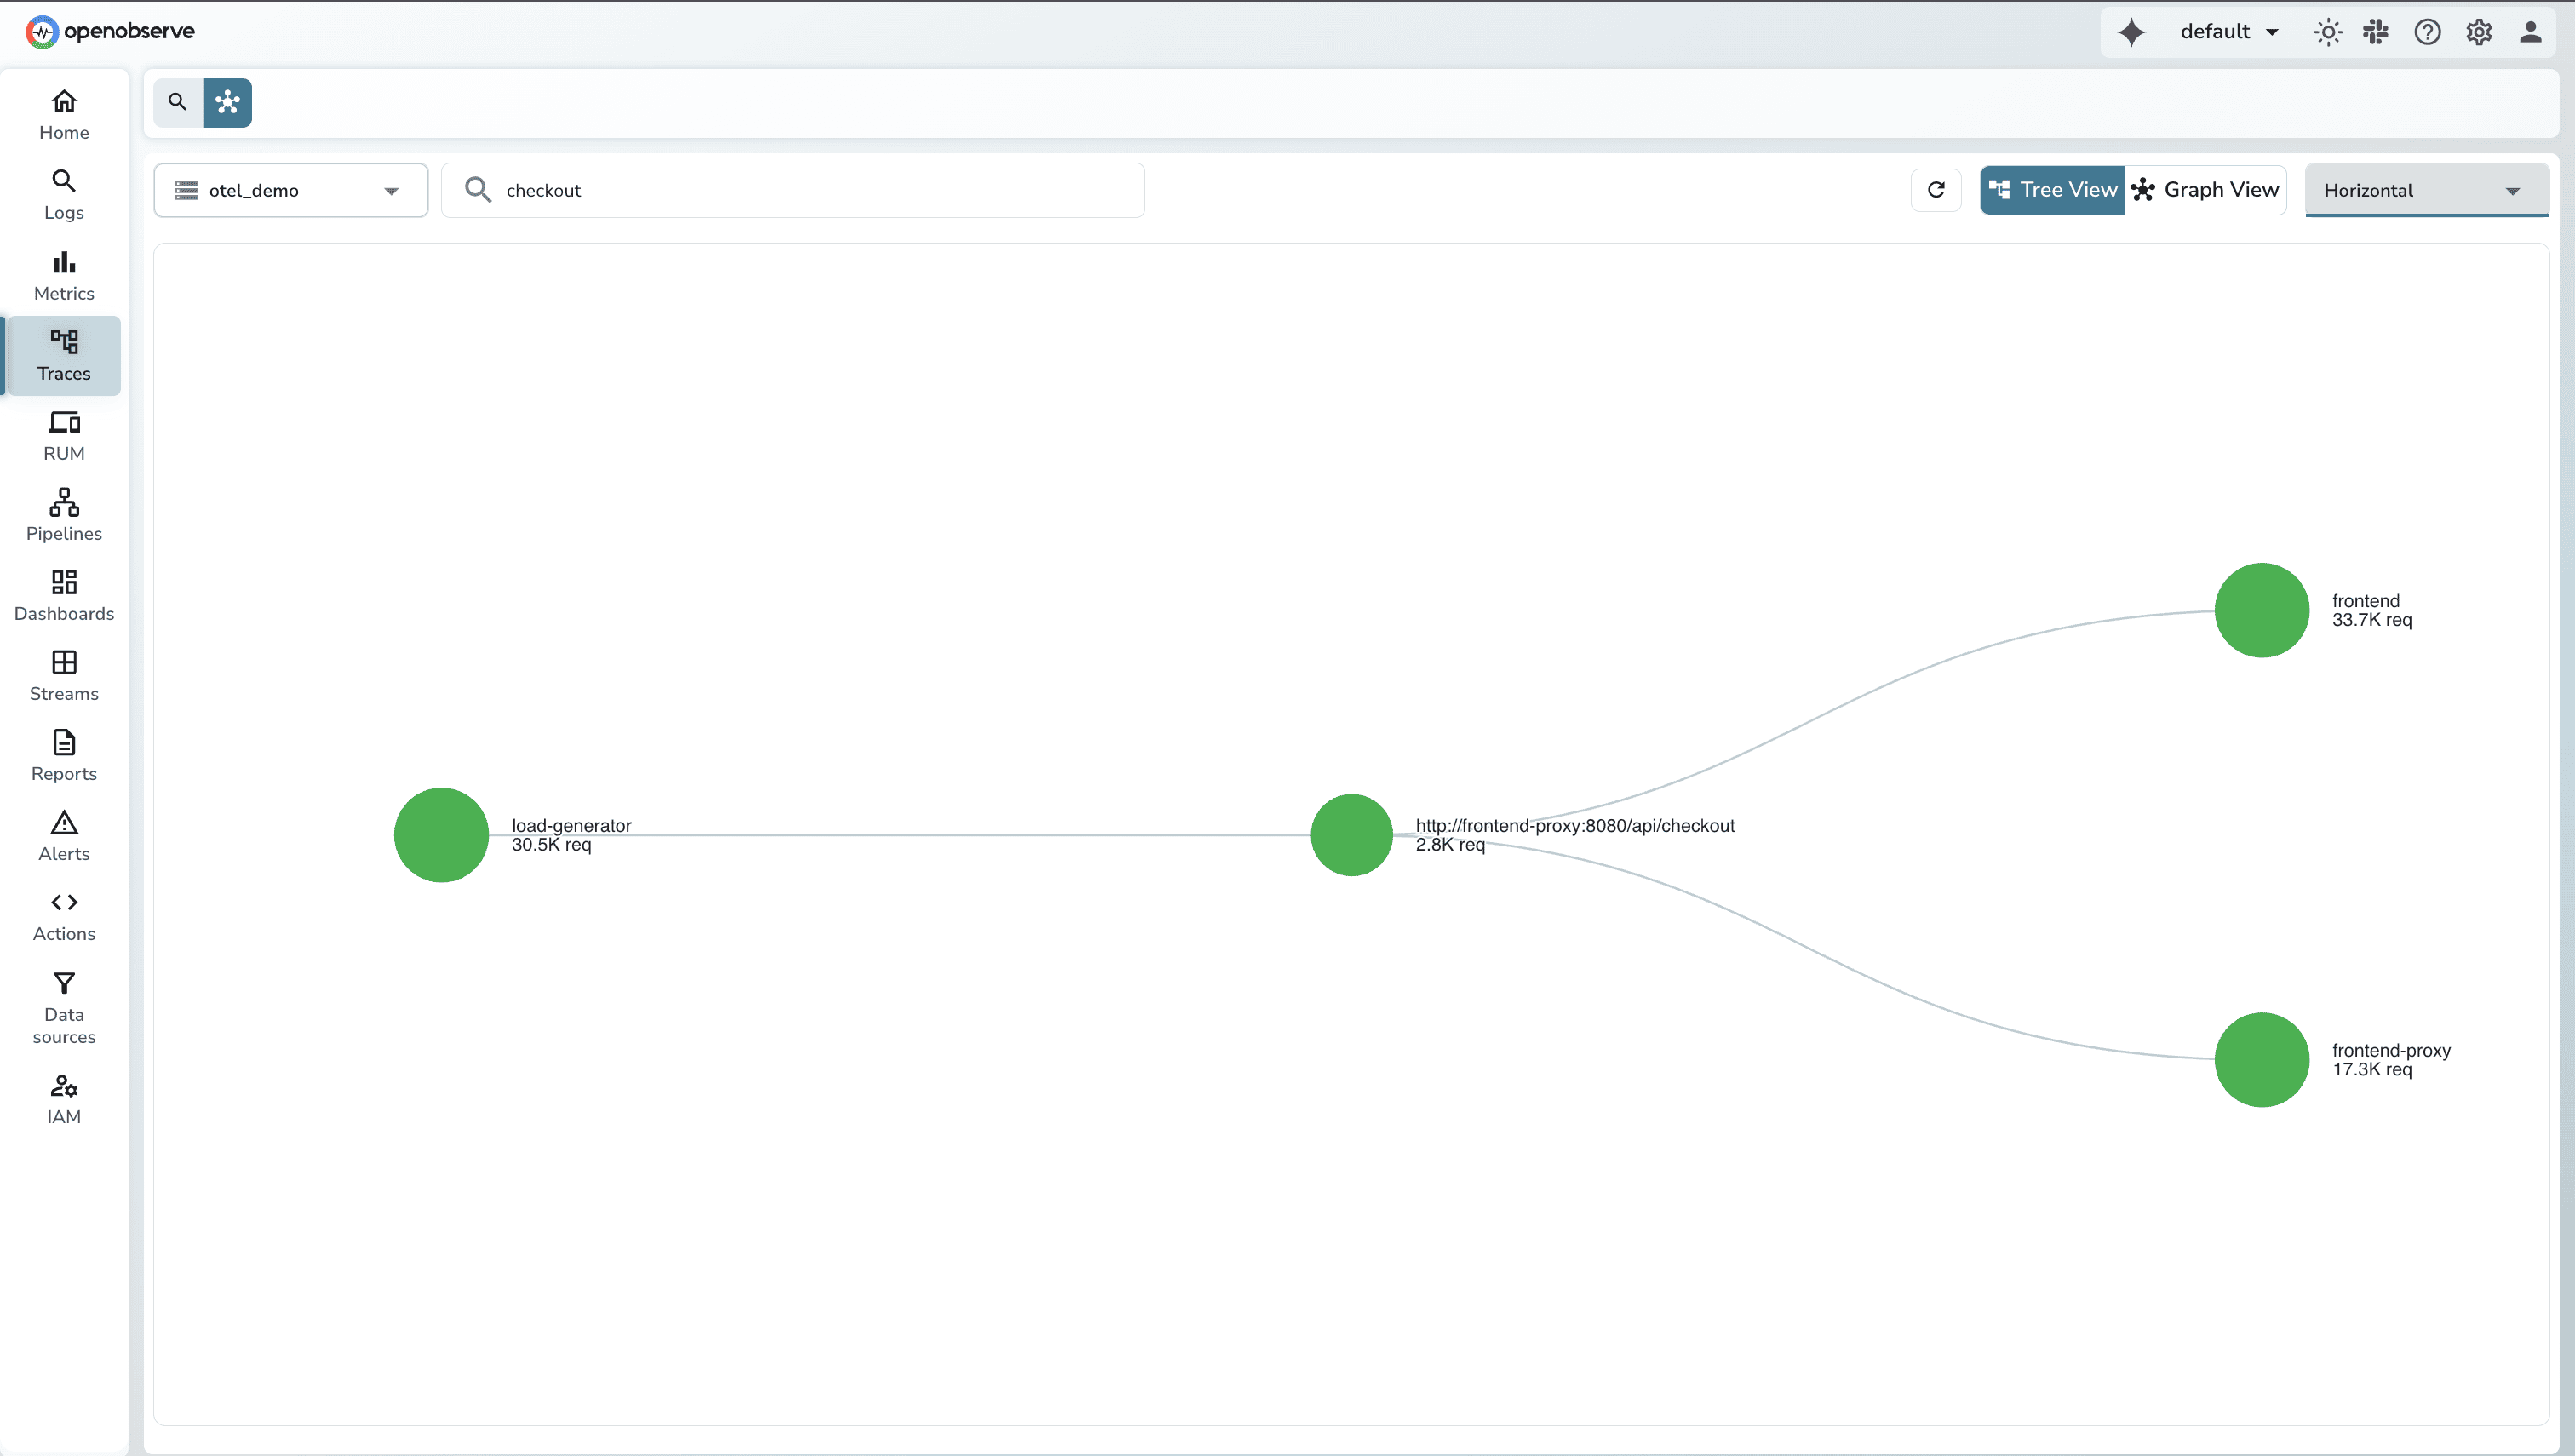
Both platforms auto-generate service topology from traces.
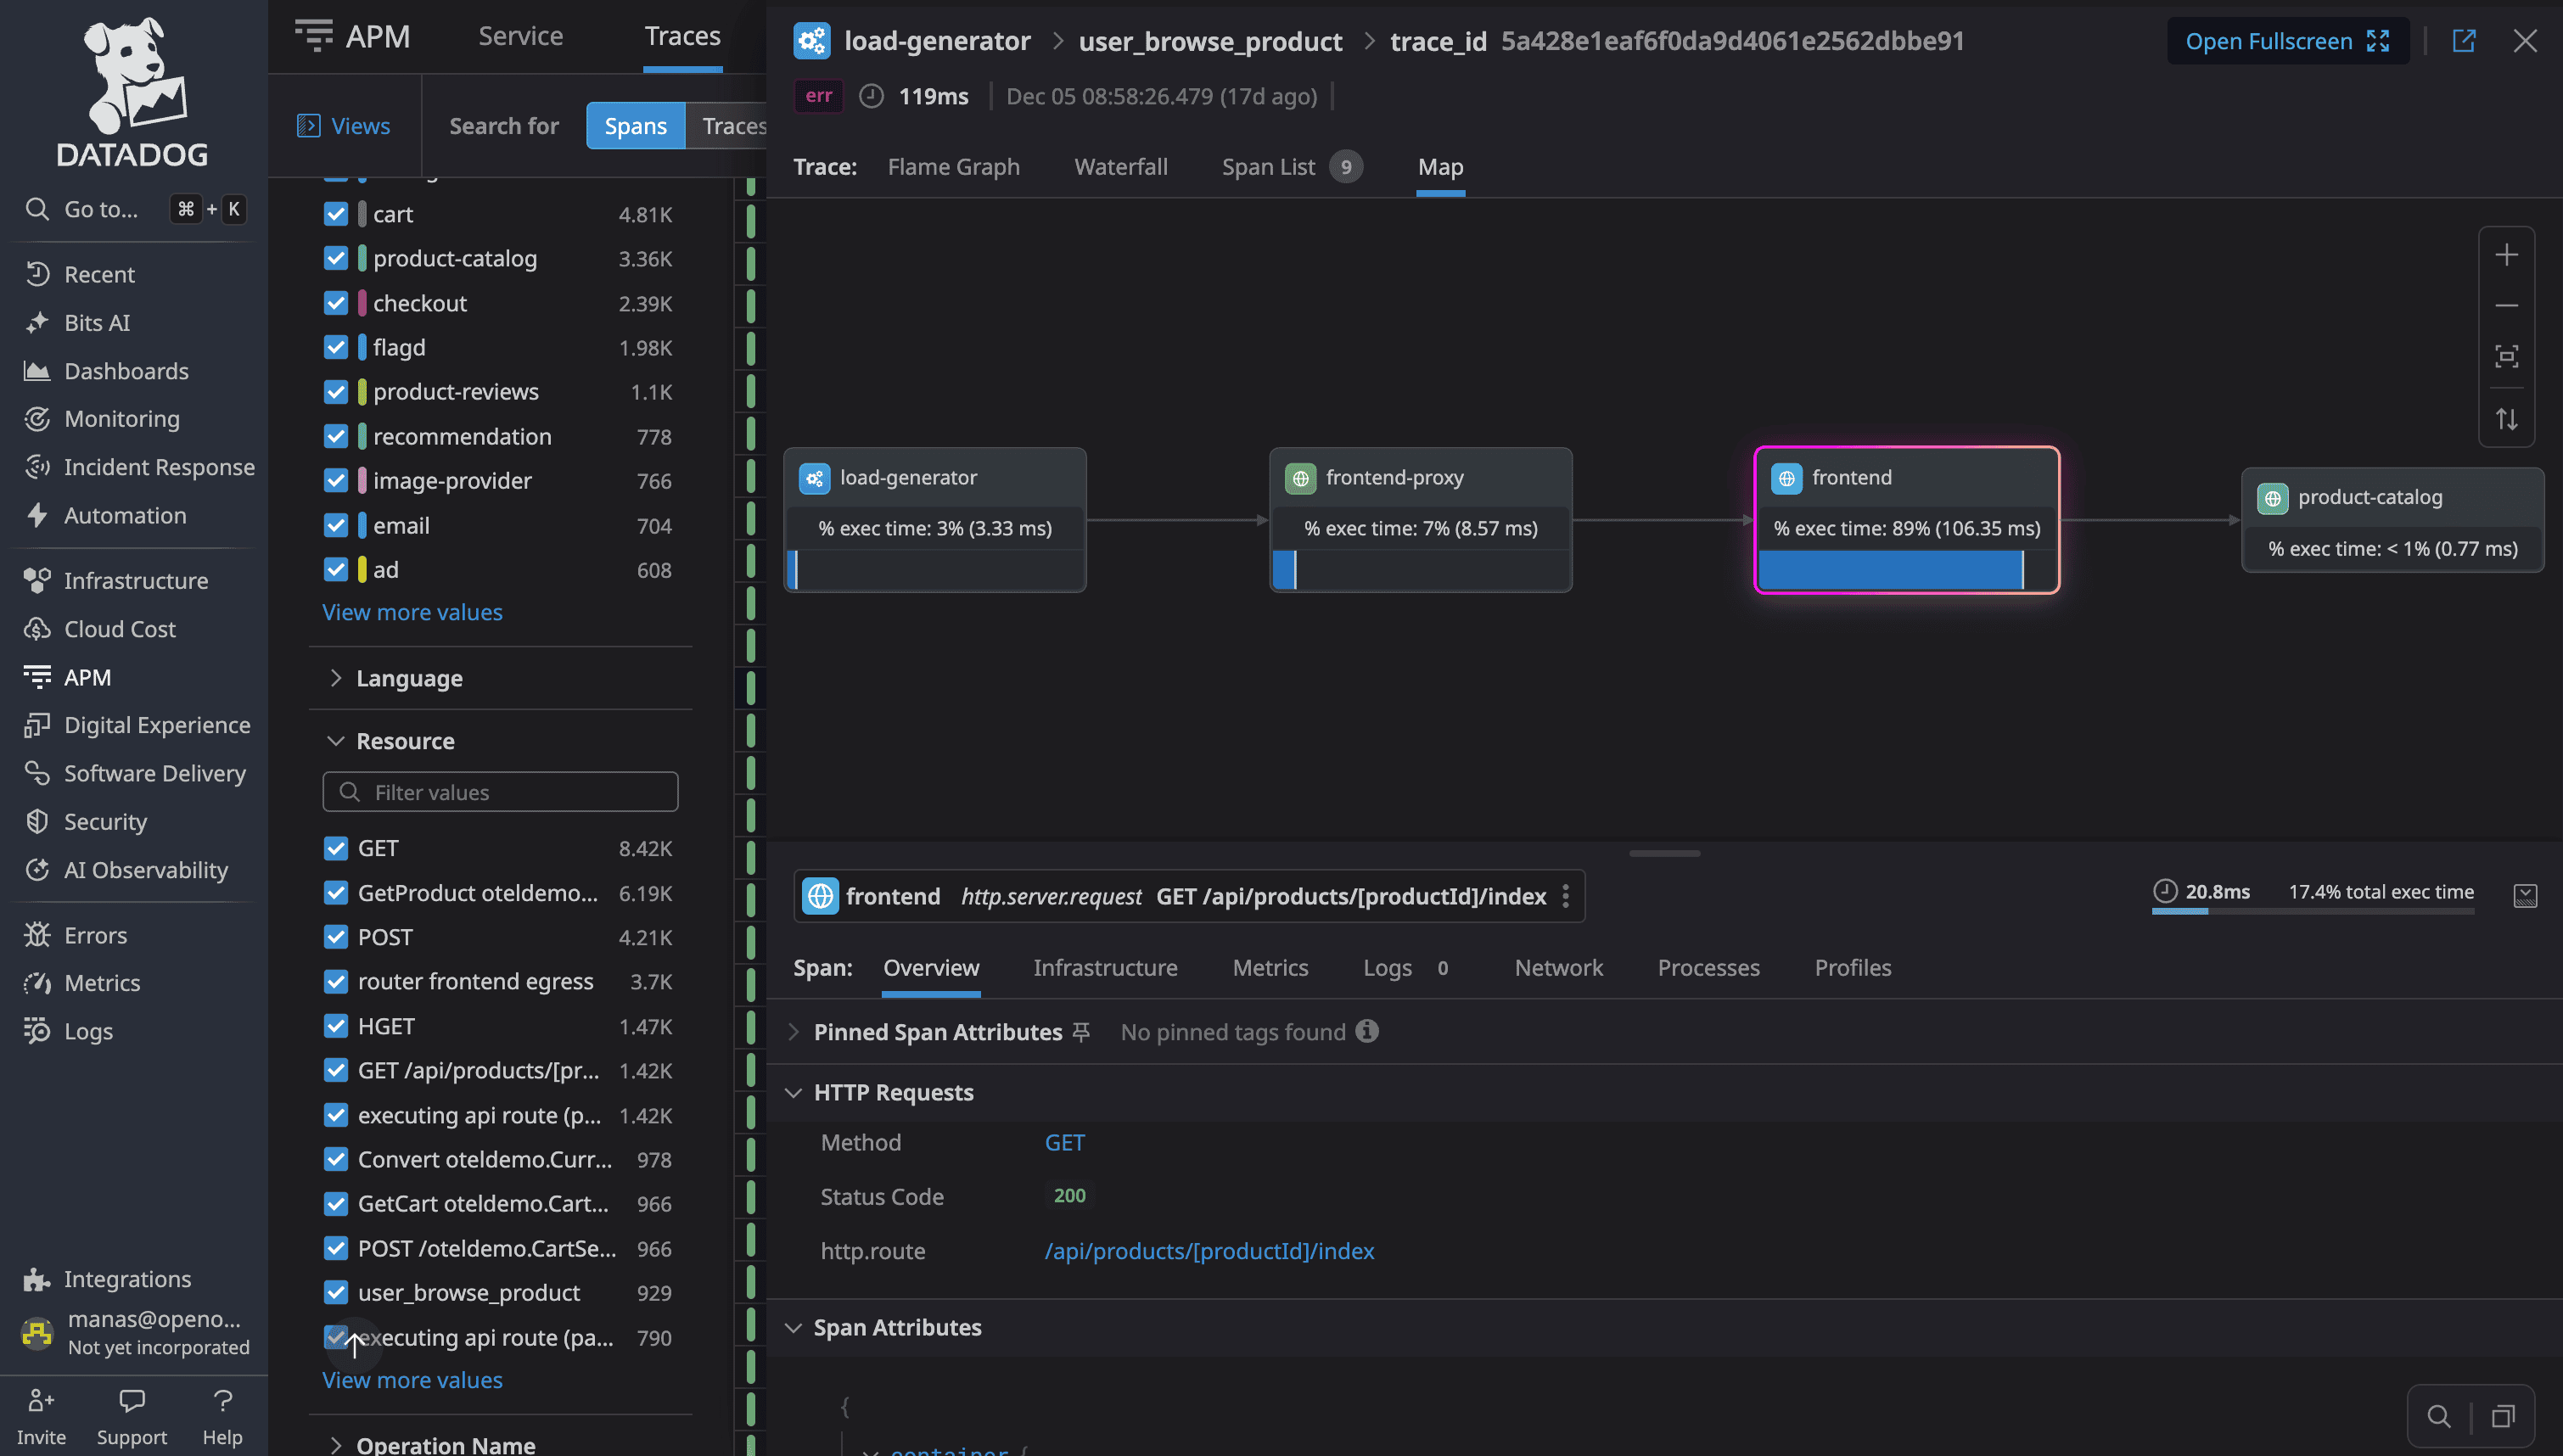
DataDog's Service Map visualizes dependencies based on observed traces. Services appear as nodes, requests as edges. Shows request rates, error rates, latency per service.
**OpenObserve provides Service Map and **Service Graph** with real-time topology and performance metrics overlaid. Interactive exploration of dependencies.
Trace Search and Filtering
Available in OSS and Enterprise Edition.
DataDog uses tag-based search with proprietary syntax:
service:frontend operation_name:http.request status:error duration:>1s
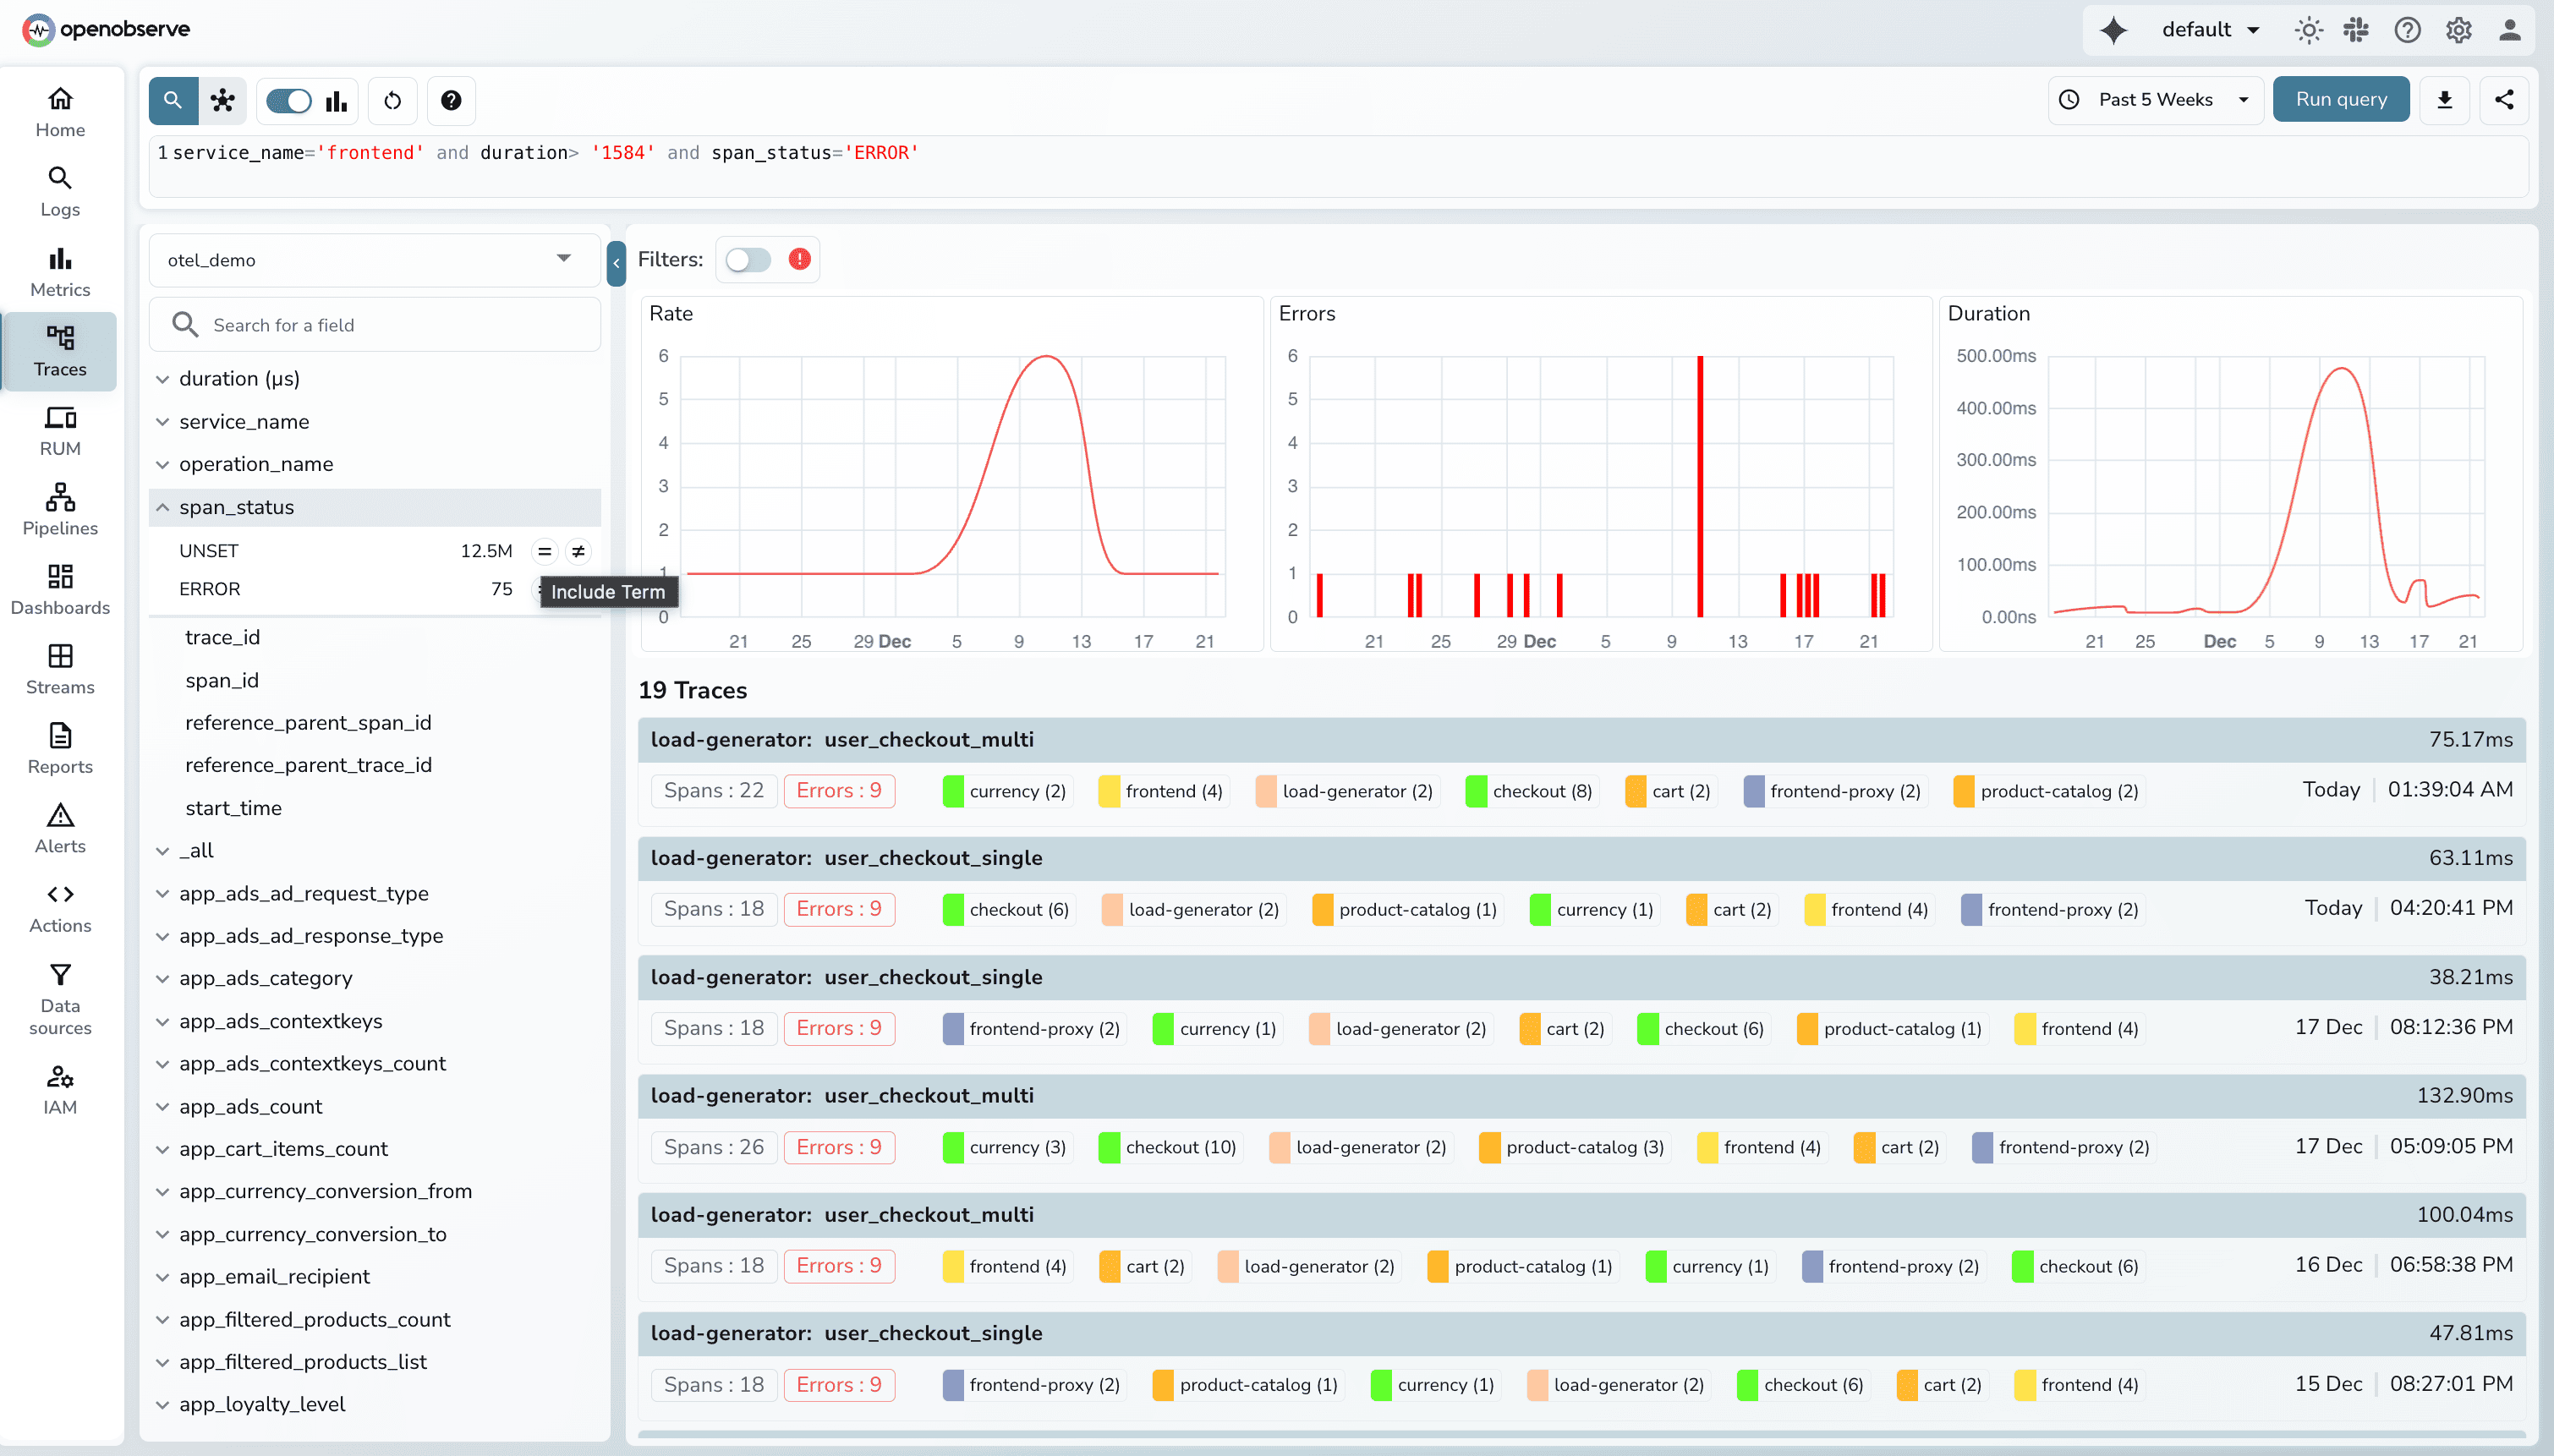
OpenObserve provides Quick Mode for trace search with intuitive UI interactions. Sidebar filters (service, operation, status, duration) and attribute-based filtering let teams search traces without writing queries. Click to filter by any span attribute.
For complex analysis, OpenObserve dashboards support SQL queries on trace data. Build visualizations showing trace patterns, latency distributions, or error trends using SQL:
SELECT histogram(_timestamp) as "x_axis_1", count(duration) as "y_axis_1" FROM "default" GROUP BY x_axis_1 ORDER BY x_axis_1 ASC
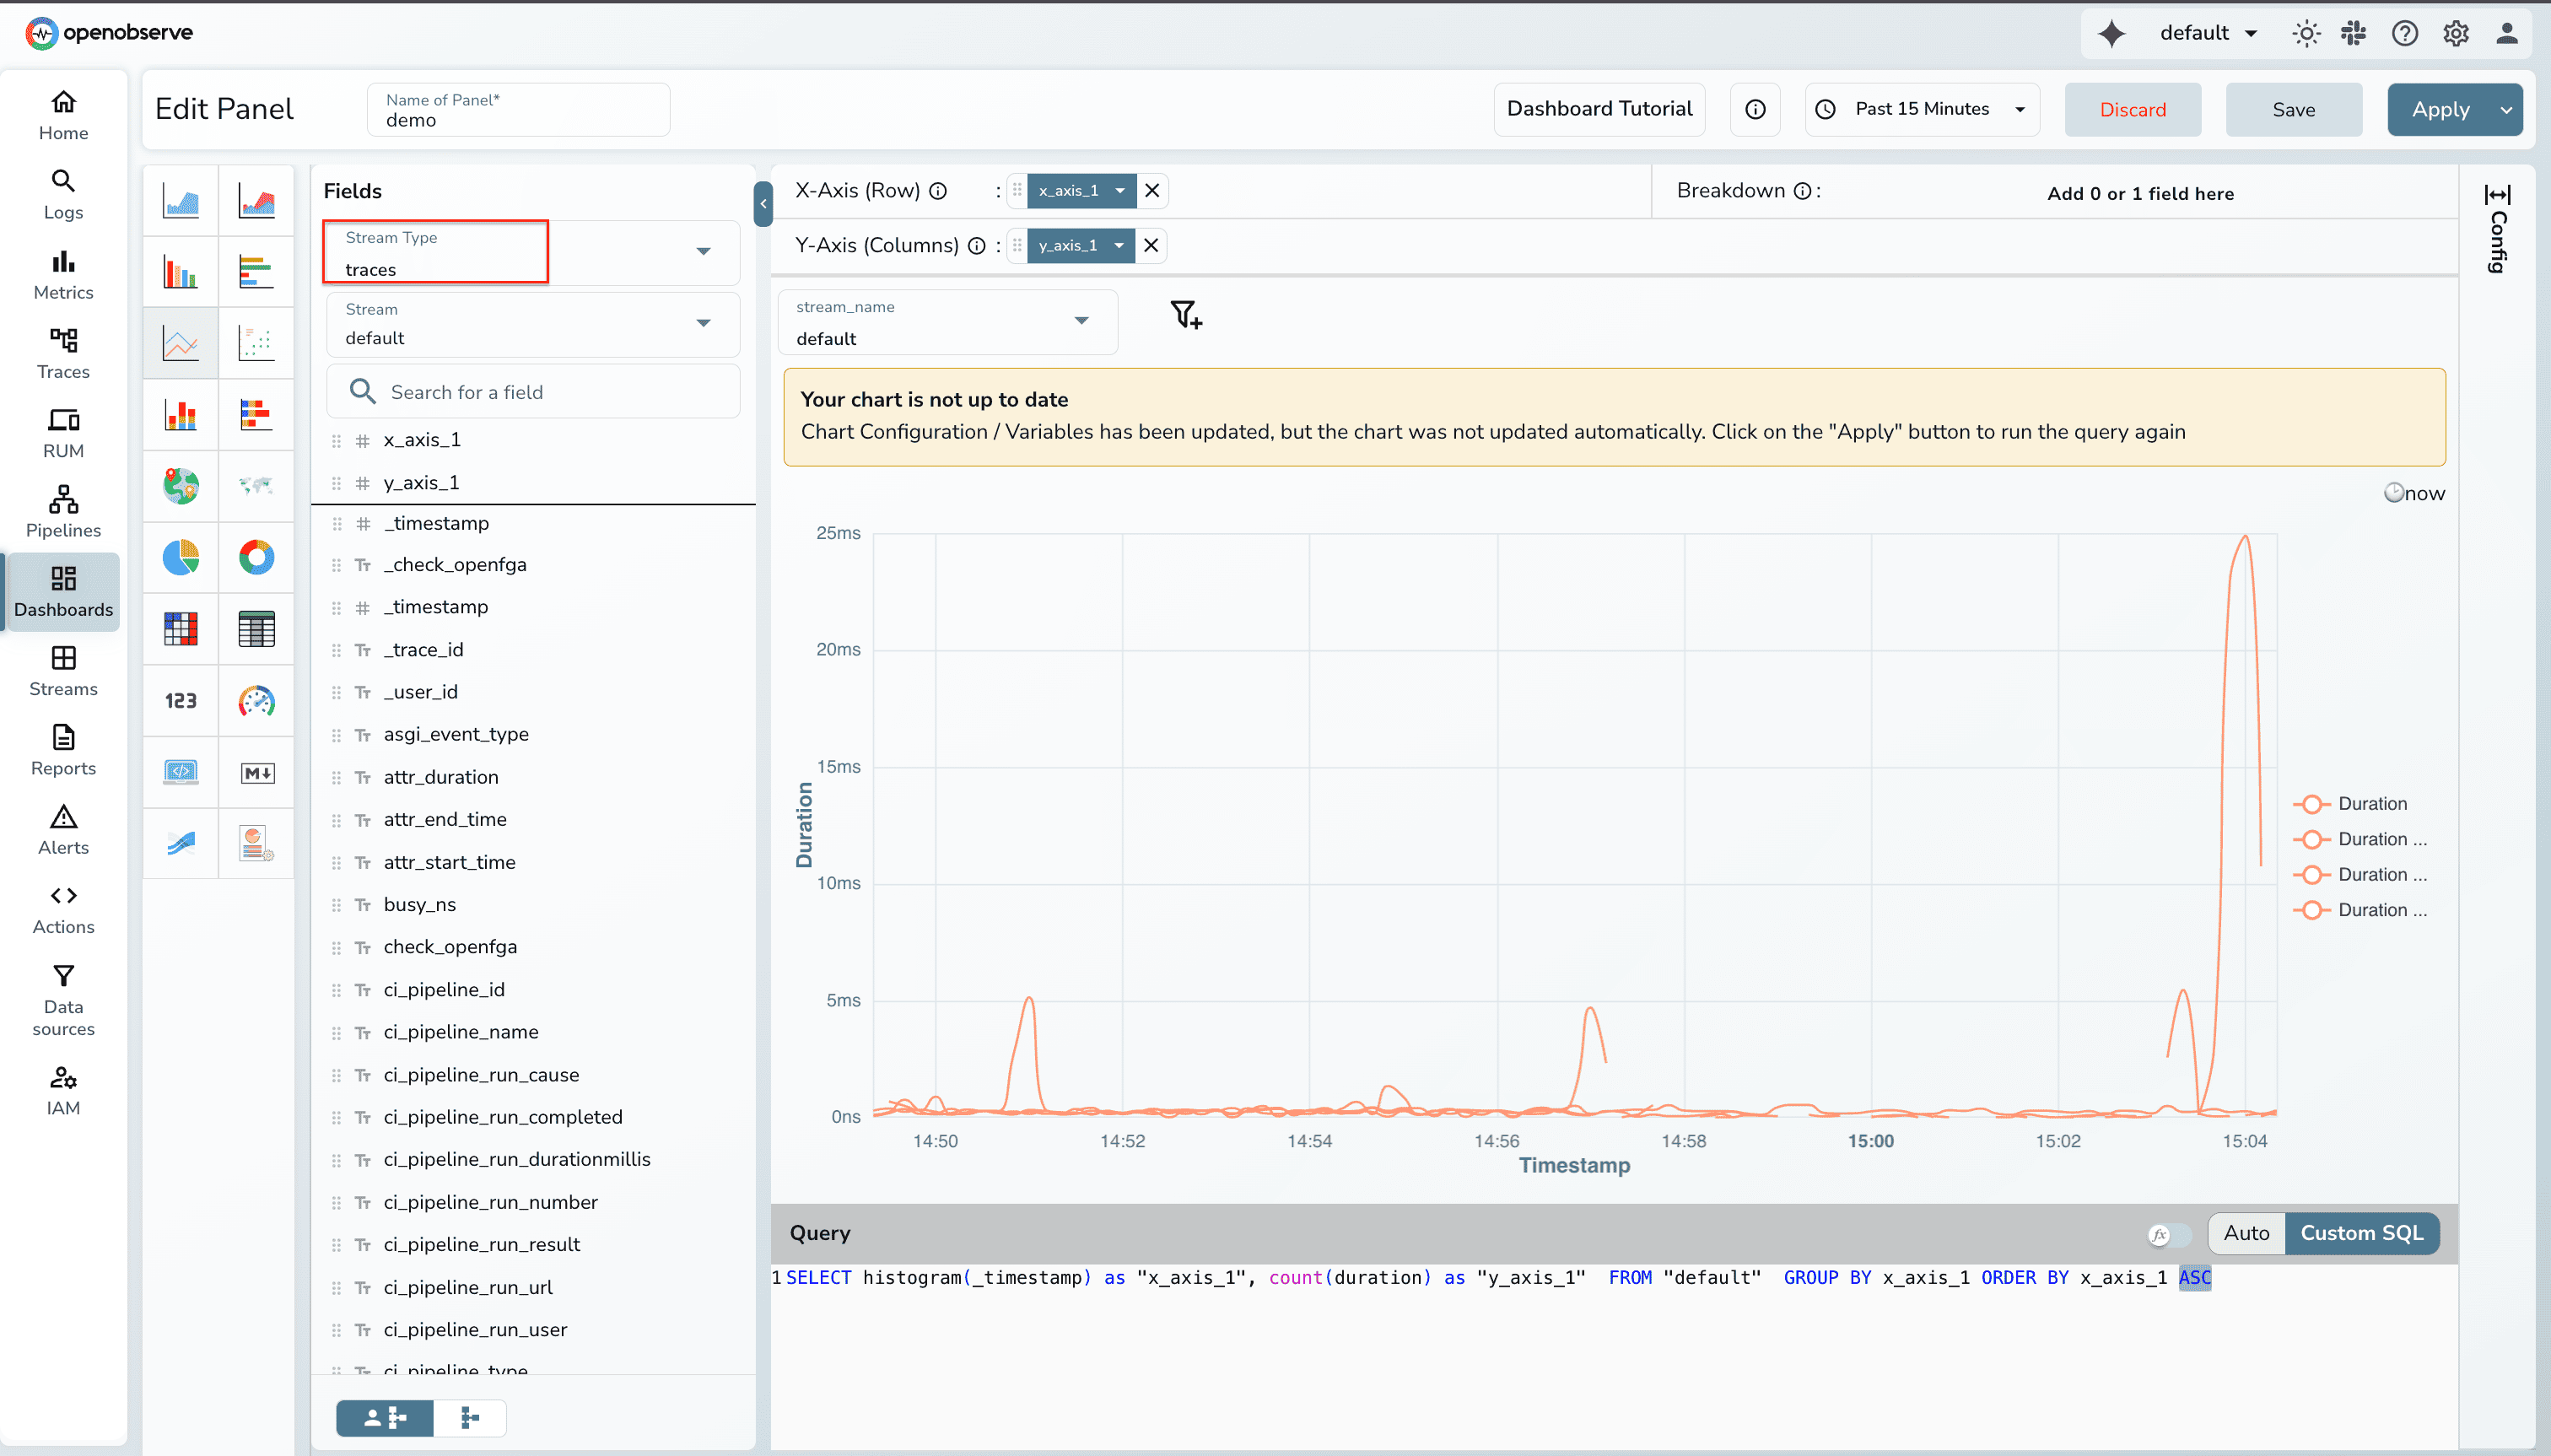
This separation is intentional: UI filters for quick trace searches, SQL for dashboard visualizations. OpenObserve dashboards support SQL for both logs and traces, enabling correlation and custom analytics.
Error Tracking
Both identify error spans (HTTP 5xx, database failures, exceptions) and aggregate for analysis.
DataDog groups errors by service, operation, error type. Shows error rates in service maps and dashboards.
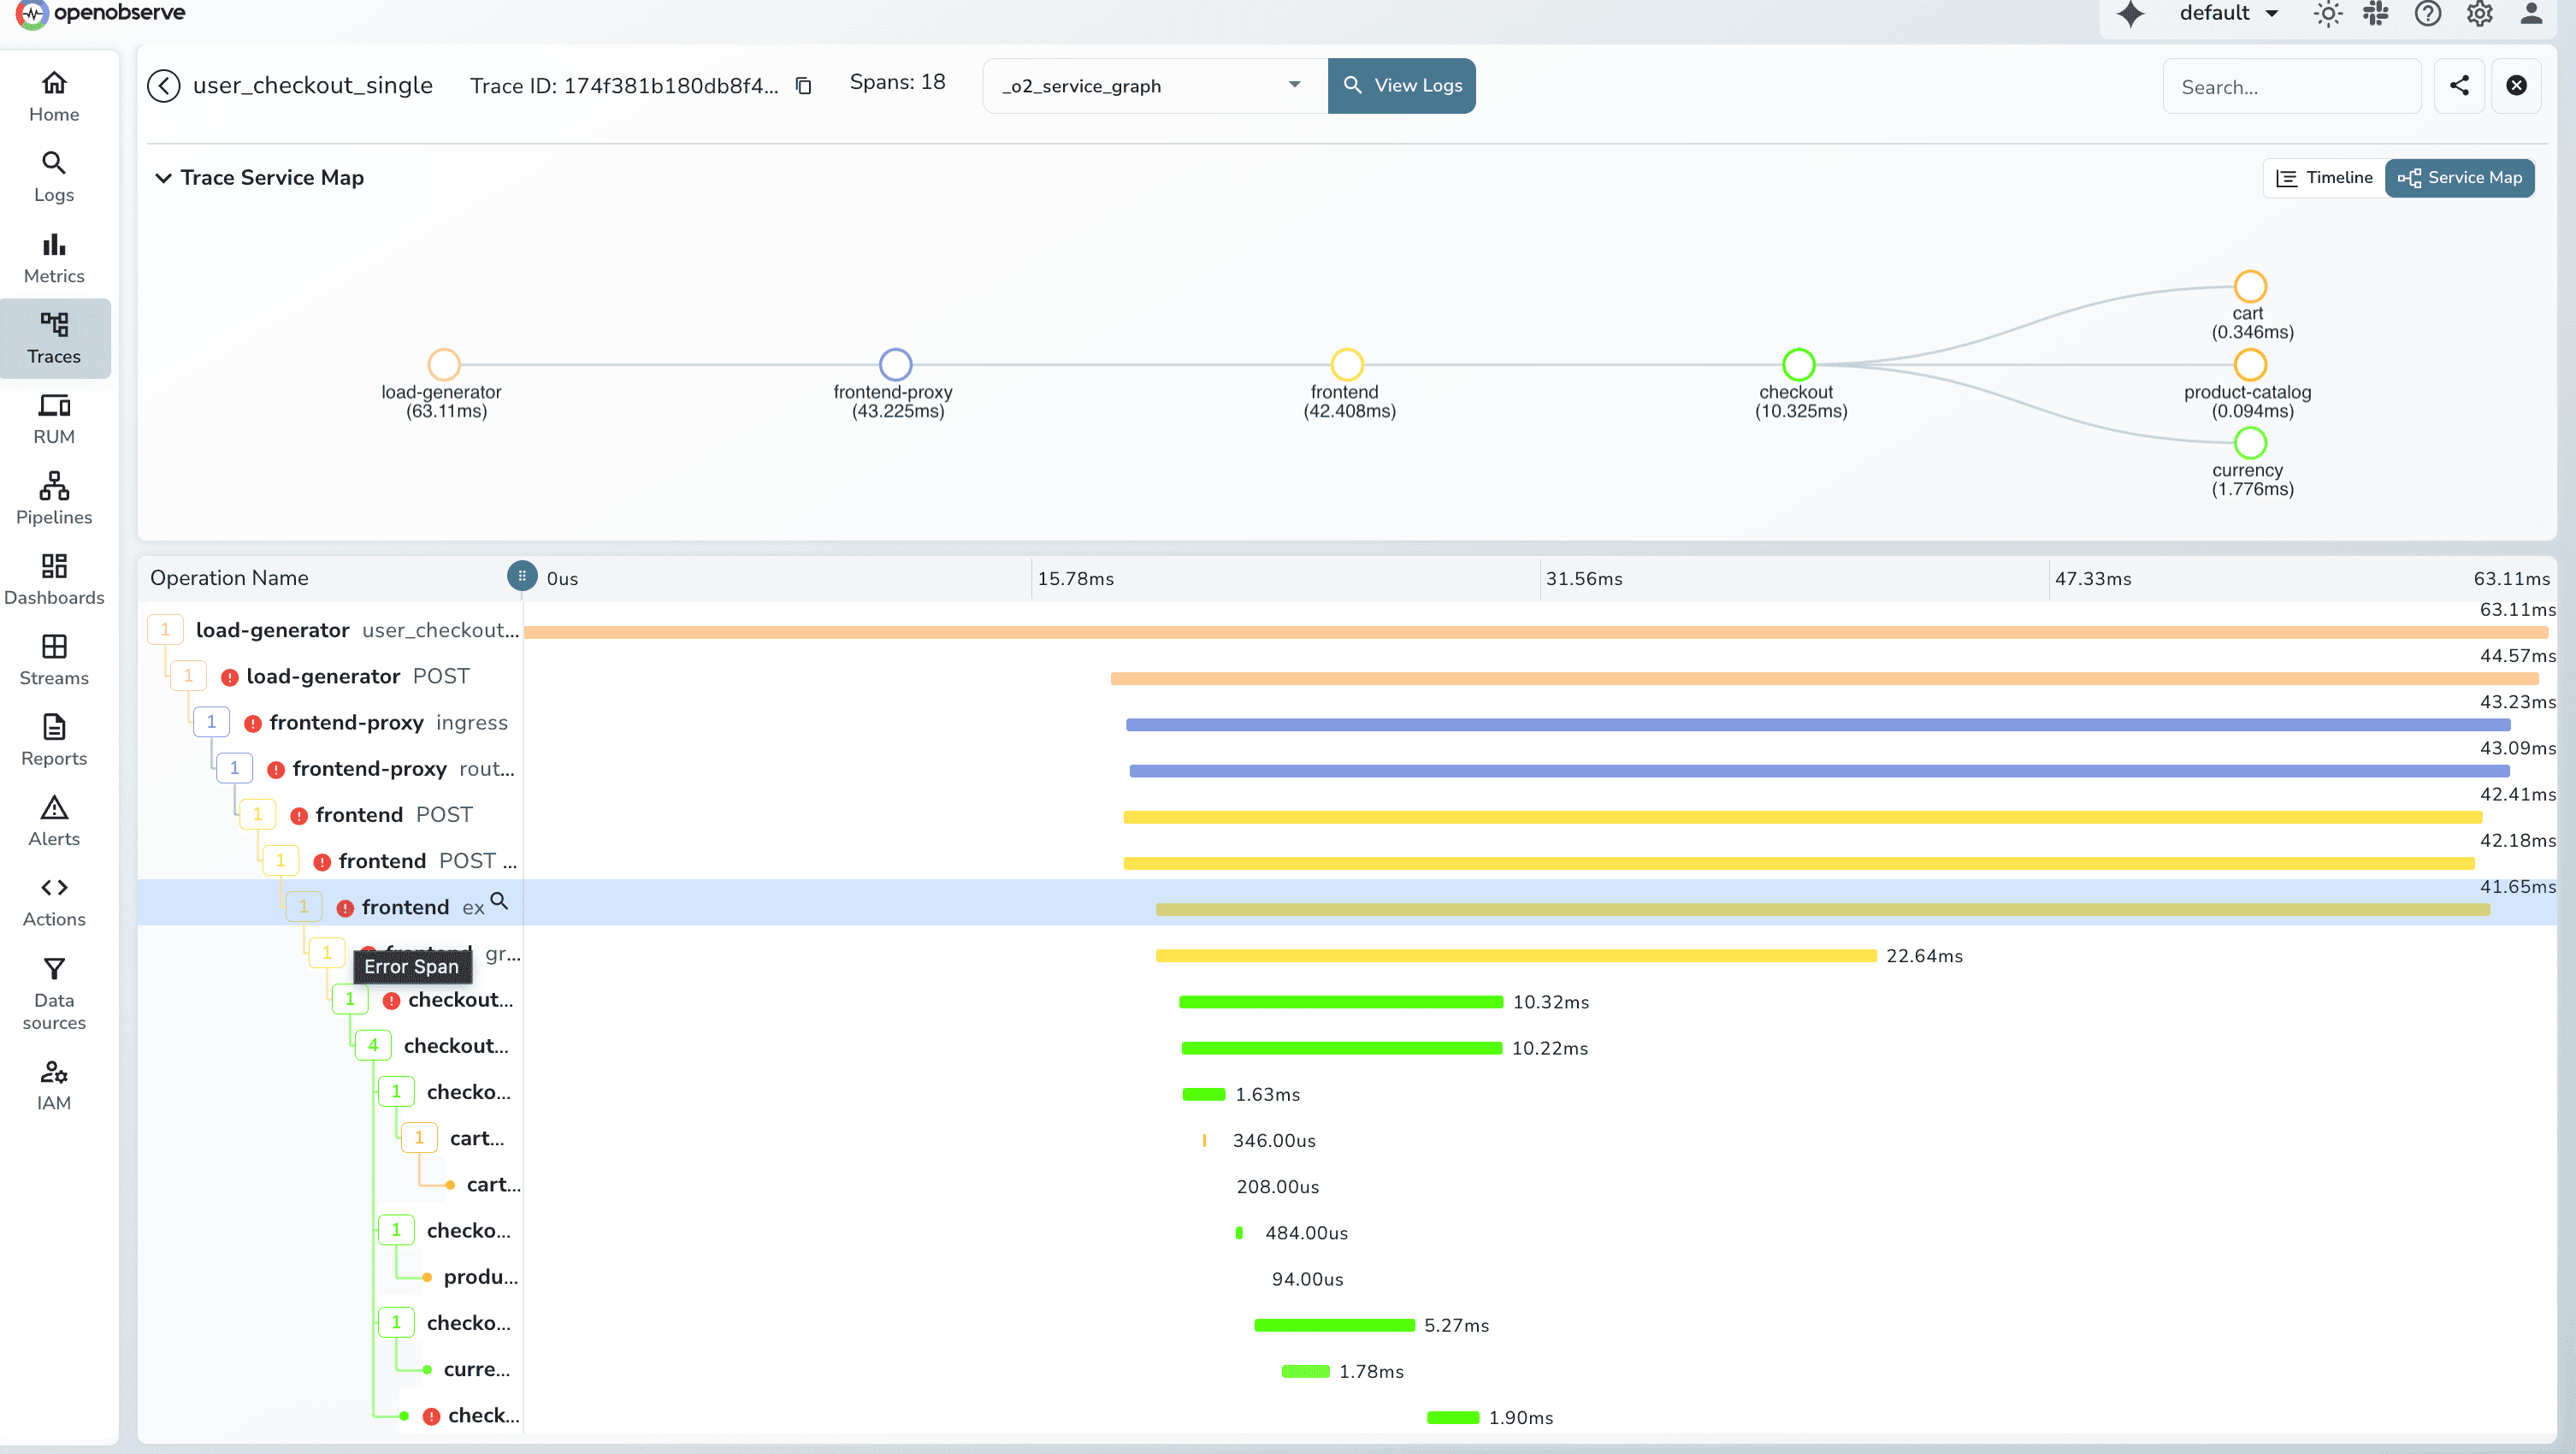
OpenObserve similarly identifies error spans, aggregates by service/operation, and provides drill-down to error correlated logs and metrics and Gantt chart views show error spans in request flow context.
Quick Comparison
| Capability | DataDog | OpenObserve |
|---|---|---|
| LLM Observability | $120/day premium tier (232 LLM spans triggered automatic charge) | Standard traces, no premium pricing |
| Span Indexing | Retention filters, per-host charges ($36/day per host, 137 of ~49,100 spans indexed) | Flat $0.50/GB, all spans indexed |
| Service Dependency Mapping | Auto-generated topology | Service Graph + Service Map |
| Trace Search | Tag-based proprietary syntax | Quick Mode UI filters + attribute-based filtering |
| Trace Dashboards | Proprietary query syntax | SQL for trace visualizations |
| Error Tracking | Aggregated errors, drill-down | Aggregated errors, Gantt views |
| APM Host Charges | $36/day per APM host (1 host = $36/day) | No per-host charges |
| OpenTelemetry Native | Supported, DD Agent preferred for full functionality | Full OTel compatibility, no proprietary agents |
| Total Test Cost | $174/day (all observability: LLM $120 + APM $36 + Infrastructure $18) | $3.00/day (all observability) |
Cost Breakdown: DataDog vs OpenObserve for APM
DataDog's APM pricing combines per-host charges, indexed span fees, and premium feature tiers.
DataDog APM Costs
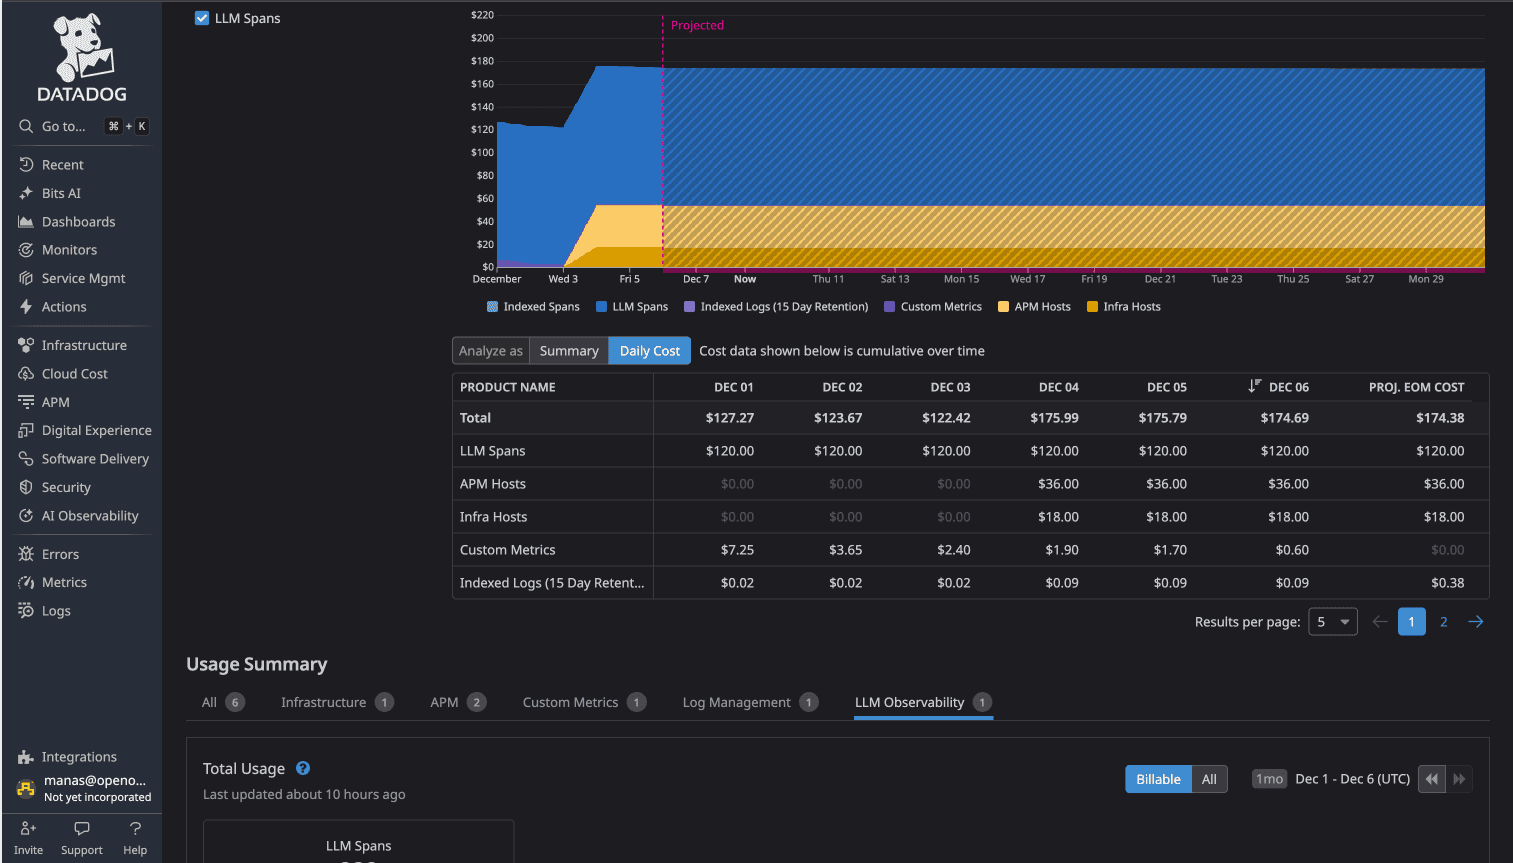
LLM Observability: $120/day (triggered by 232 LLM spans)
APM Hosts: $36/day (1 host sending traces)
Indexed Spans: 137 spans from ~49,100 total
Total DataDog (all observability): $174/day
- LLM Observability: $120/day
- APM Hosts: $36/day
- Infrastructure Hosts: $18/day
- Indexed Logs: $0.09/day
OpenObserve APM Costs
Flat rate: $0.50 per GB ingested for all traces. No APM host charges. No premium tiers. No separate billing for LLM spans.
Total OpenObserve (all observability): $3.00/day
The Difference
58x cost difference (more than 98% cost savings) for identical observability data.
Why This Matters
- No Feature Tier Surprises: All traces priced at $0.50/GB (HTTP, database, RPC, LLM, message queue)
- No Per-Host Multipliers: Costs scale with data volume, not infrastructure count
- Full Trace Retention: All spans indexed and searchable, not sampled subsets
- Predictable Scaling: Adding AI features increases costs linearly with data, not exponentially through feature tiers
The 90% savings Evereve achieved extends to APM and distributed tracing.
The Bottom Line
If evaluating APM platforms, open-source DataDog alternatives for distributed tracing, or OpenTelemetry-native observability, OpenObserve delivers:
- No premium feature tiers: LLM traces, database spans, HTTP requests all priced at $0.50/GB
- SQL trace search: complex filters, joins, aggregations
- OpenTelemetry native: full OTel compatibility without proprietary agents
- No per-host APM charges: costs scale with data, not infrastructure
- Up to 90% cost savings
For platform engineers managing OpenTelemetry-instrumented microservices, these differences matter. No cost anxiety about AI features. No host-based multipliers. No sampling that sacrifices visibility.
- Full comparison
- Part 1: Logs - Automatic Field Discovery, SQL Queries, and 90% Cost Savings
- Part 2: Metrics - Drag & Drop, SQL, PromQL, High Cardinality
- Part 3: Traces/APM- OTel Native, No Hidden Tiers
- Part 4: Dashboards- Prebuilt, Drag & Drop, Custom
- Part 5: Alerts, Monitors, Destinations
- Part 6: Real User Monitoring
- Part 7: Pipelines
- Part 8: IAM (SSO, RBAC)
- Part 9: Cost
Prefer to try it locally first? The entire OpenObserve install is one command:
Sign up for a free cloud trial or schedule a demo to test OpenObserve with your traces.
About the Author
Manas Sharma


Manas is a passionate Dev and Cloud Advocate with a strong focus on cloud-native technologies, including observability, cloud, kubernetes, and opensource. building bridges between tech and community.
Follow OpenObserve on Google
Add OpenObserve as a preferred source to see more of our articles in Google Search and Top Stories.













