“OpenObserve helped us migrate from Datadog in under an hour... reducing observability costs by 4x.”

4x
Lower observability cost

< 1 hour
Migrated off Datadog

Flat pricing
No month-end surprises
No SQL required. Answers in seconds.
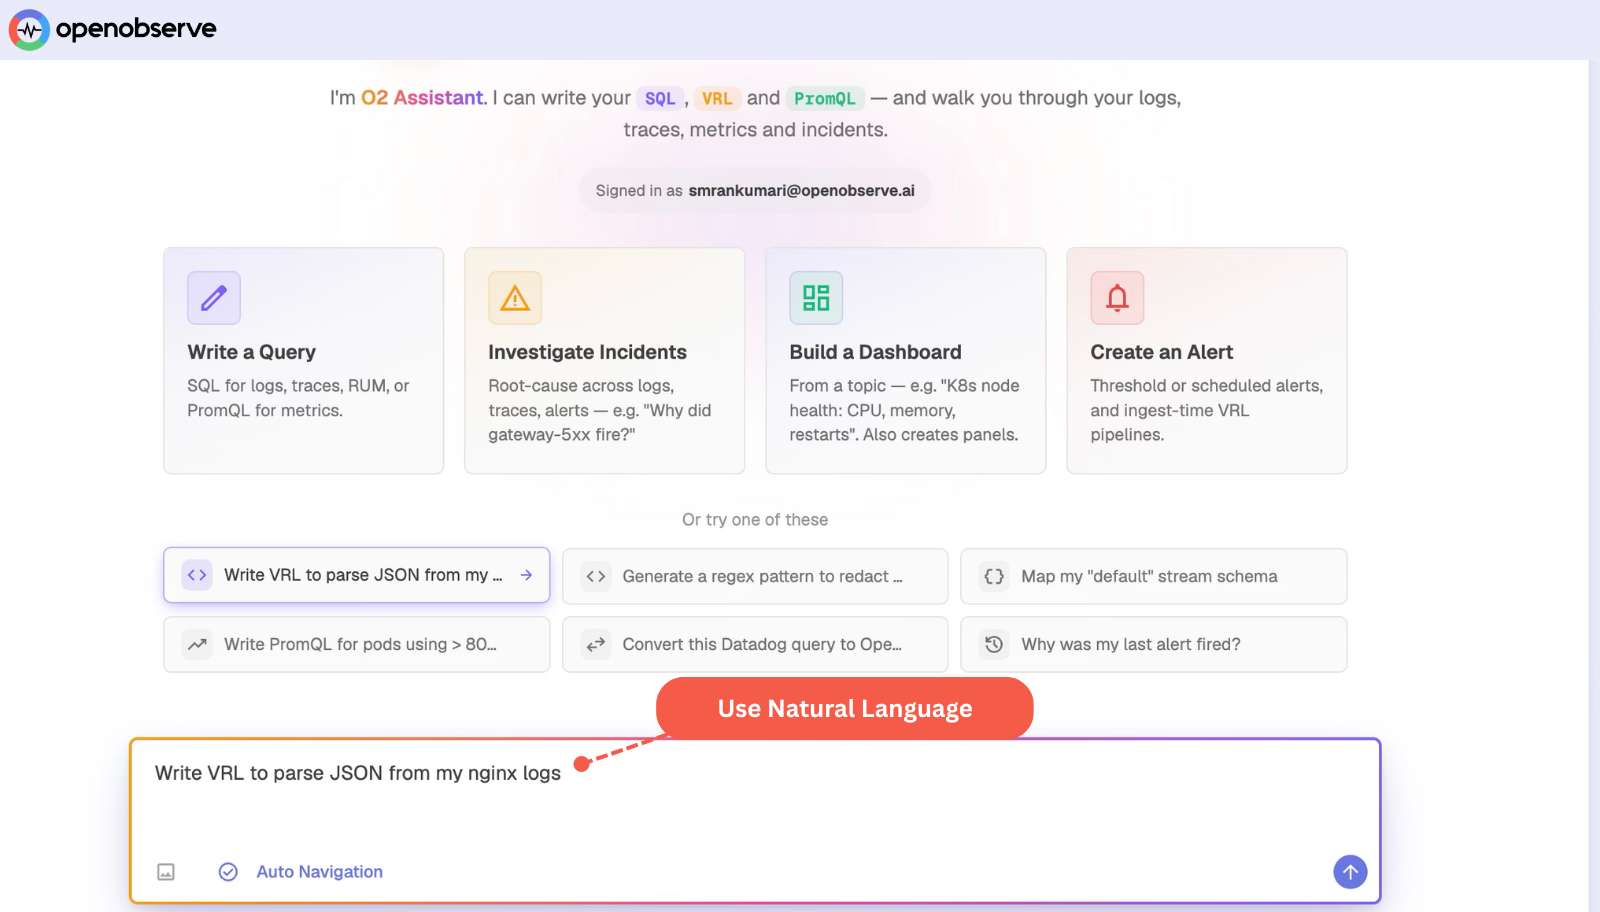
Explore observability data, build dashboards, and set alerts in plain English, no SQL required.
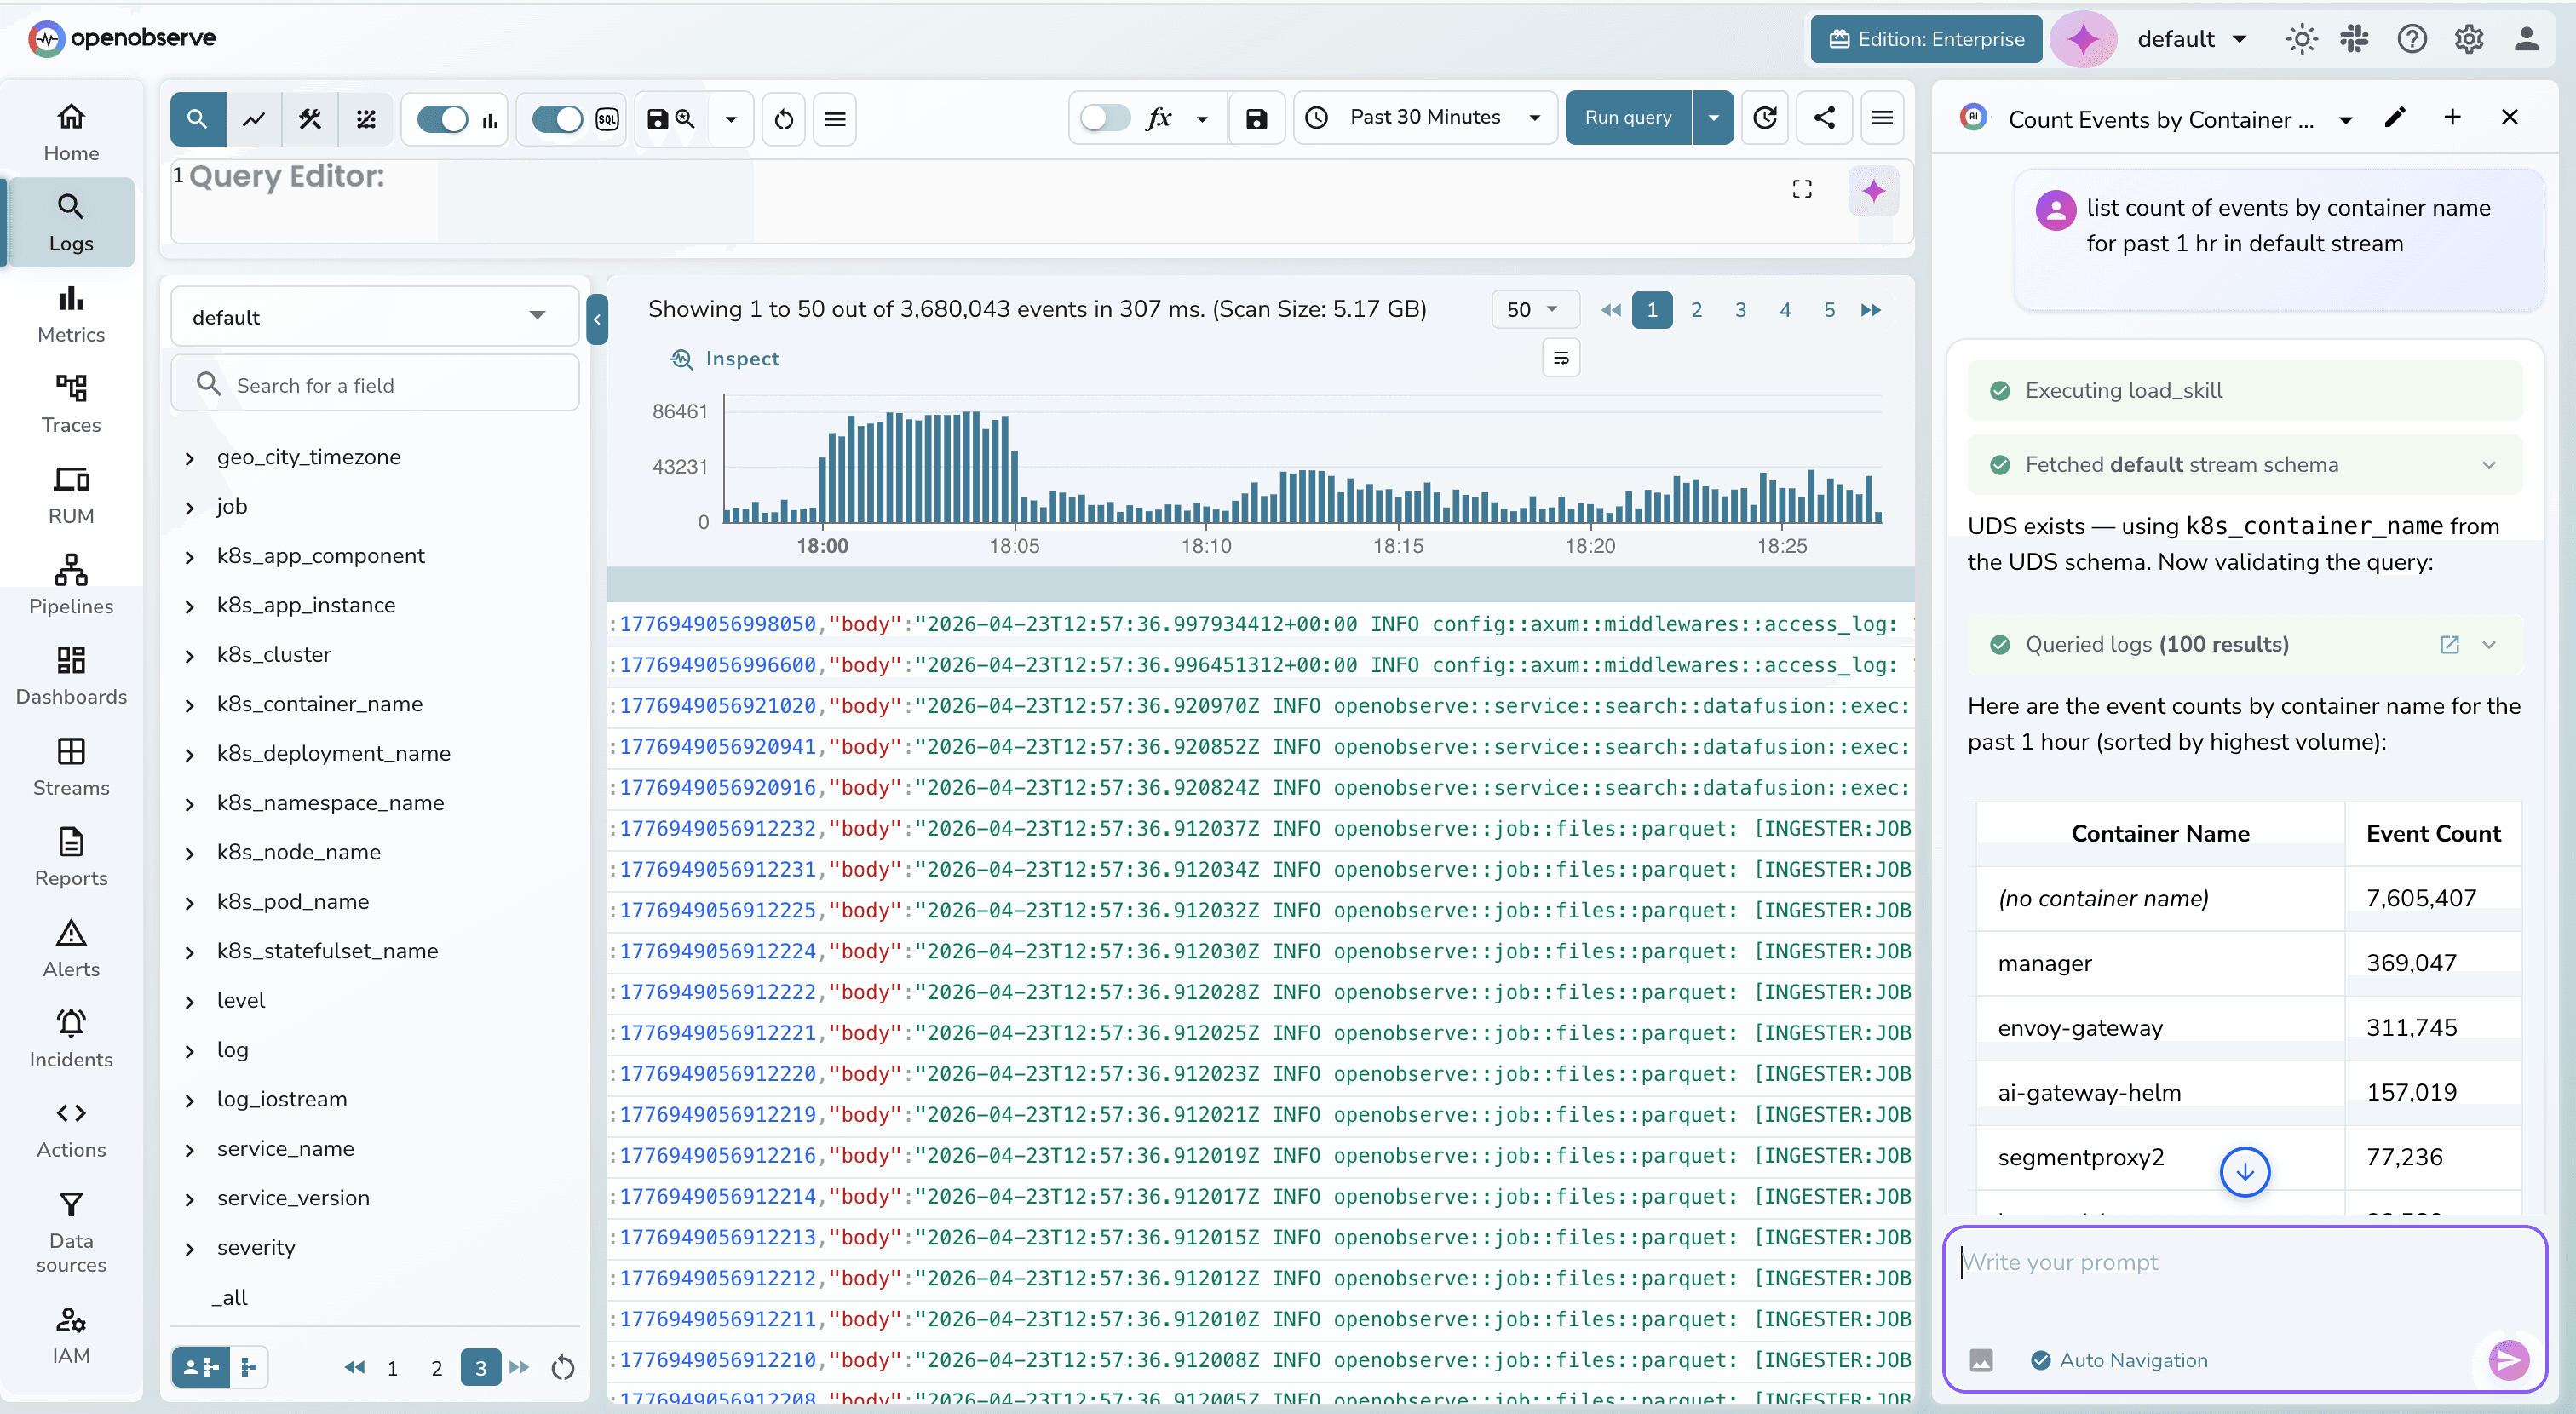
Ask a question in plain English, get a ready-to-run query.
Summarize errors and surface patterns without scanning logs by hand.
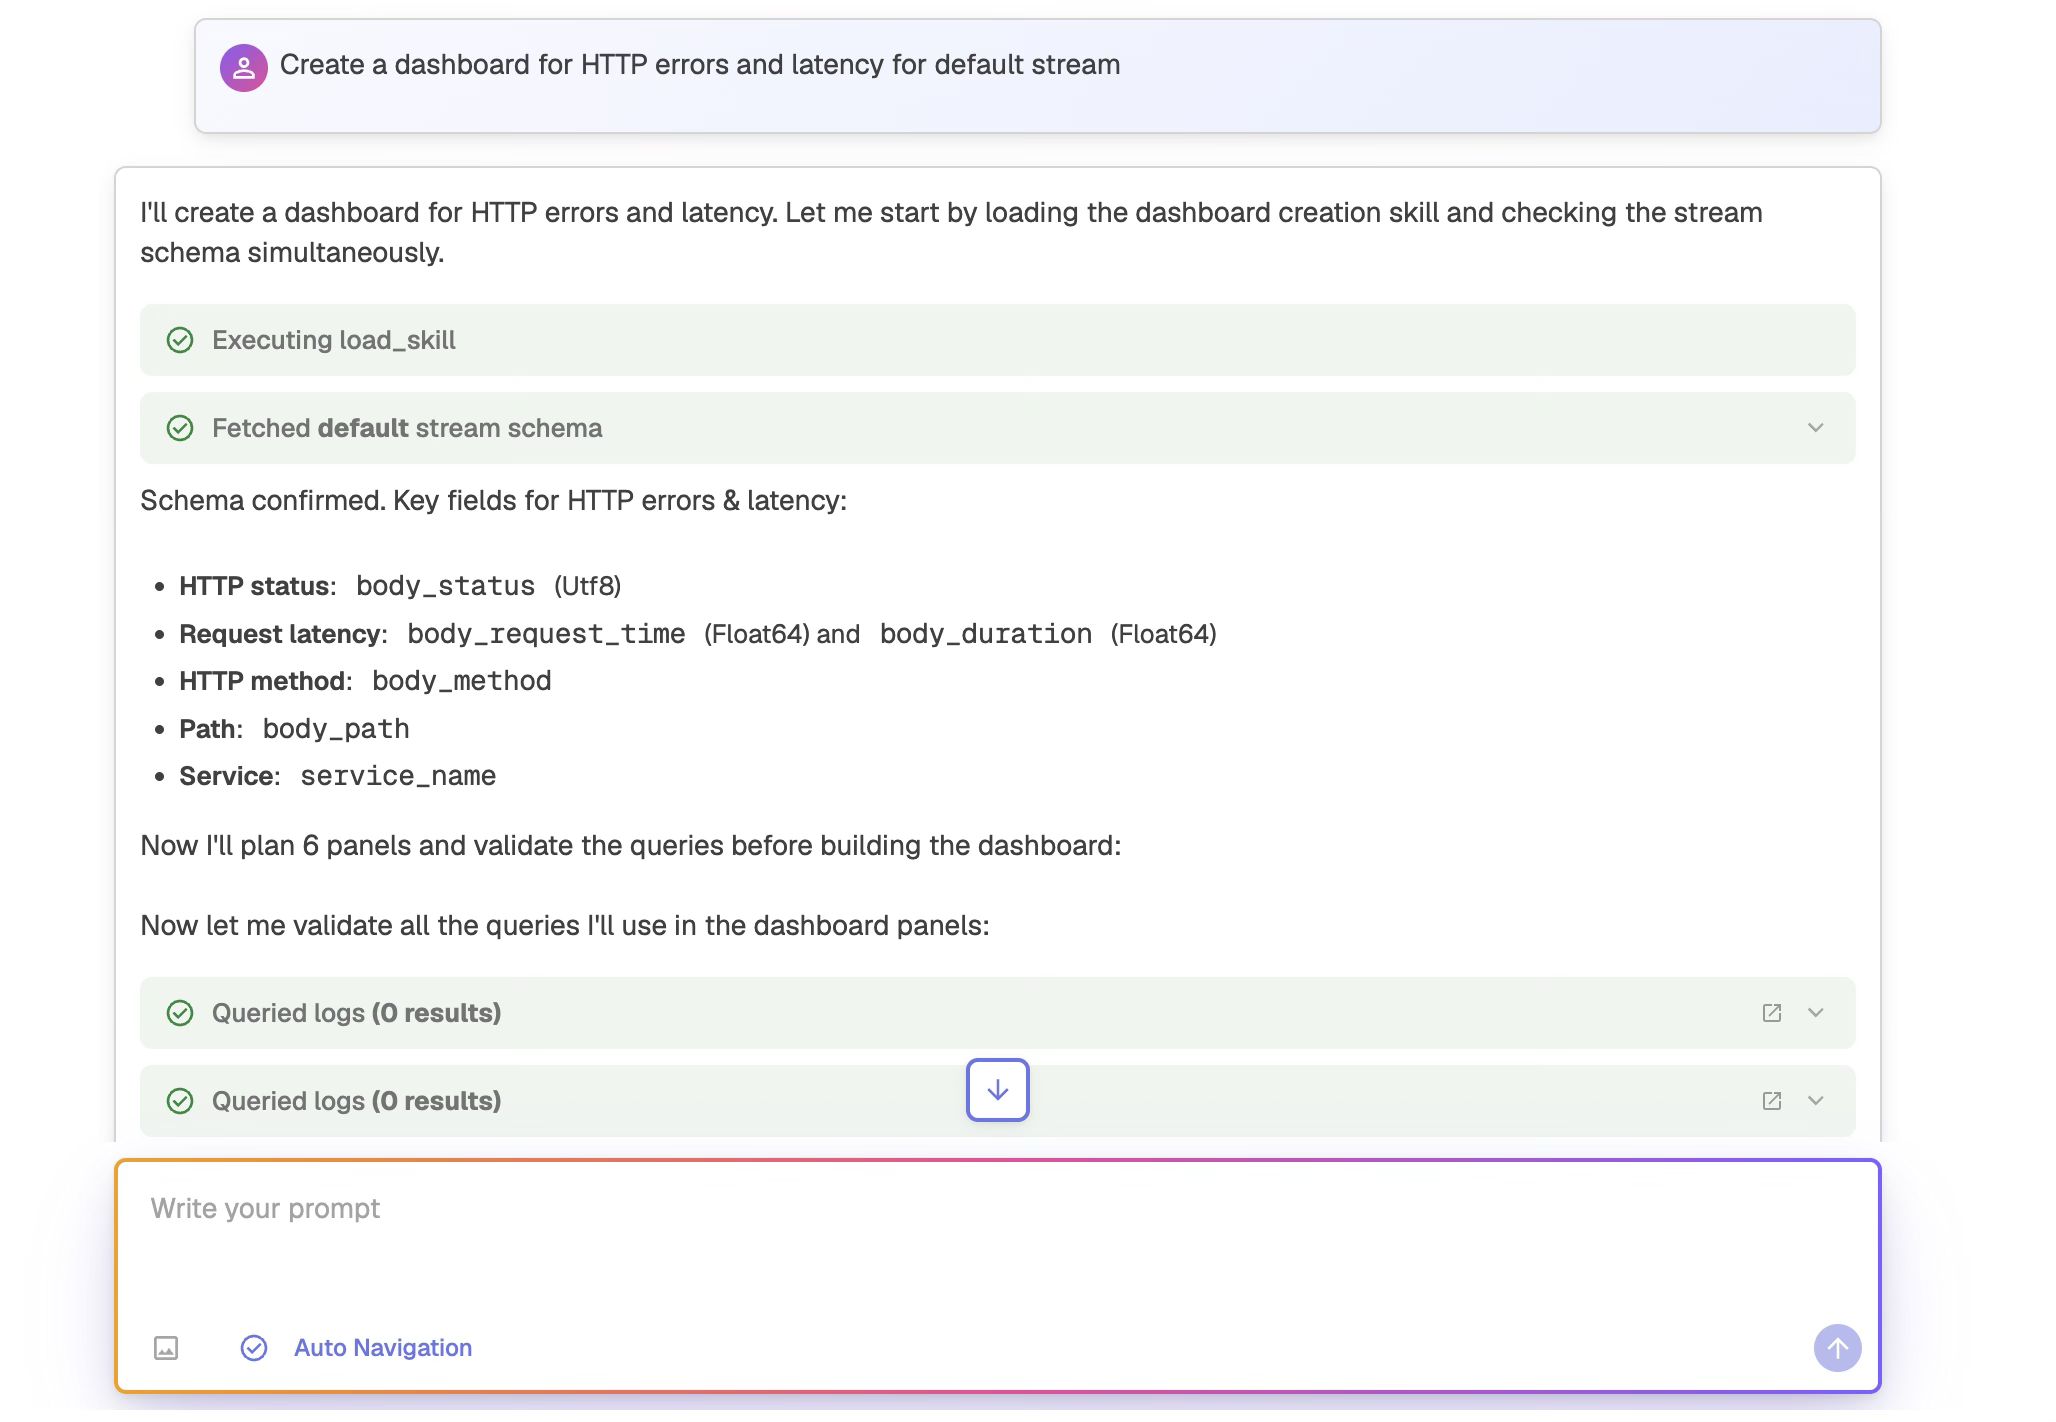
Describe what you want to see, get panels generated in seconds.
Type a question and the assistant generates the correct OpenObserve SQL query, ready to run, no editing required.
Ask the assistant about an anomaly and it surfaces key fields, patterns, and top values instantly.
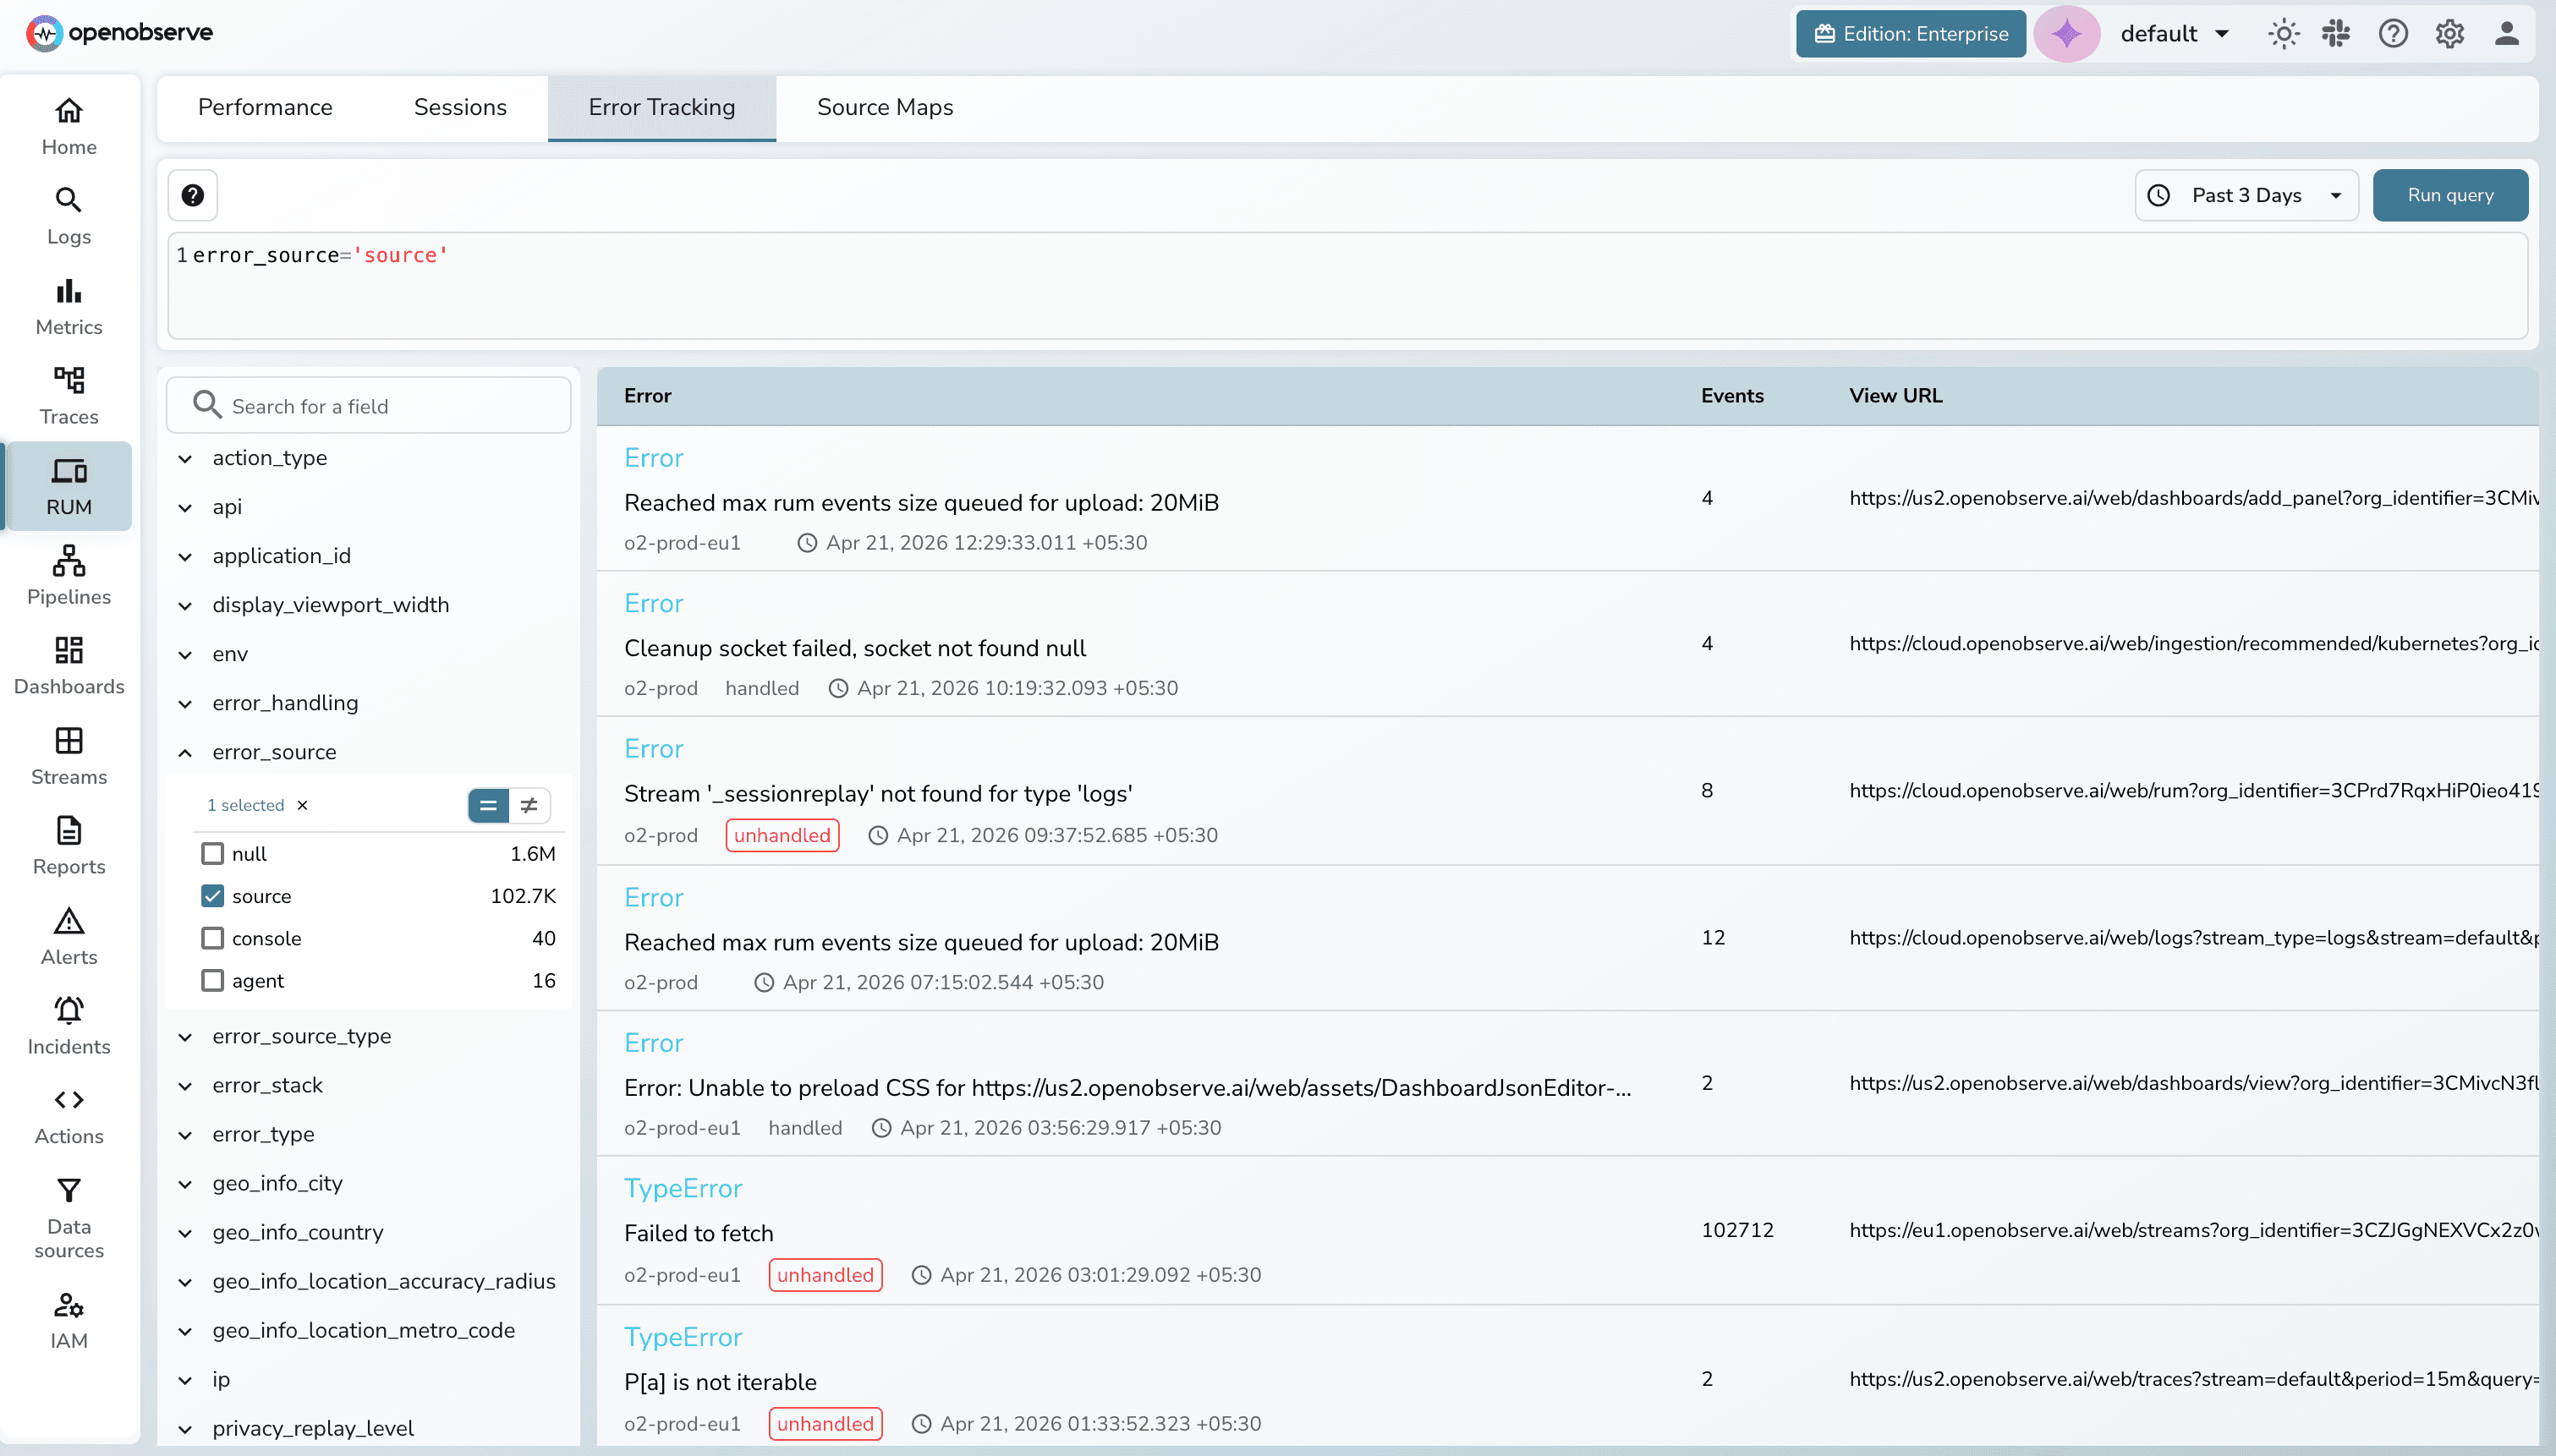
Ask for a summary of top errors and get a structured breakdown highlighting recurring patterns, spikes, and anomalies.
Ask what changed in the last deployment and the assistant compares log behavior across time windows to surface regressions.
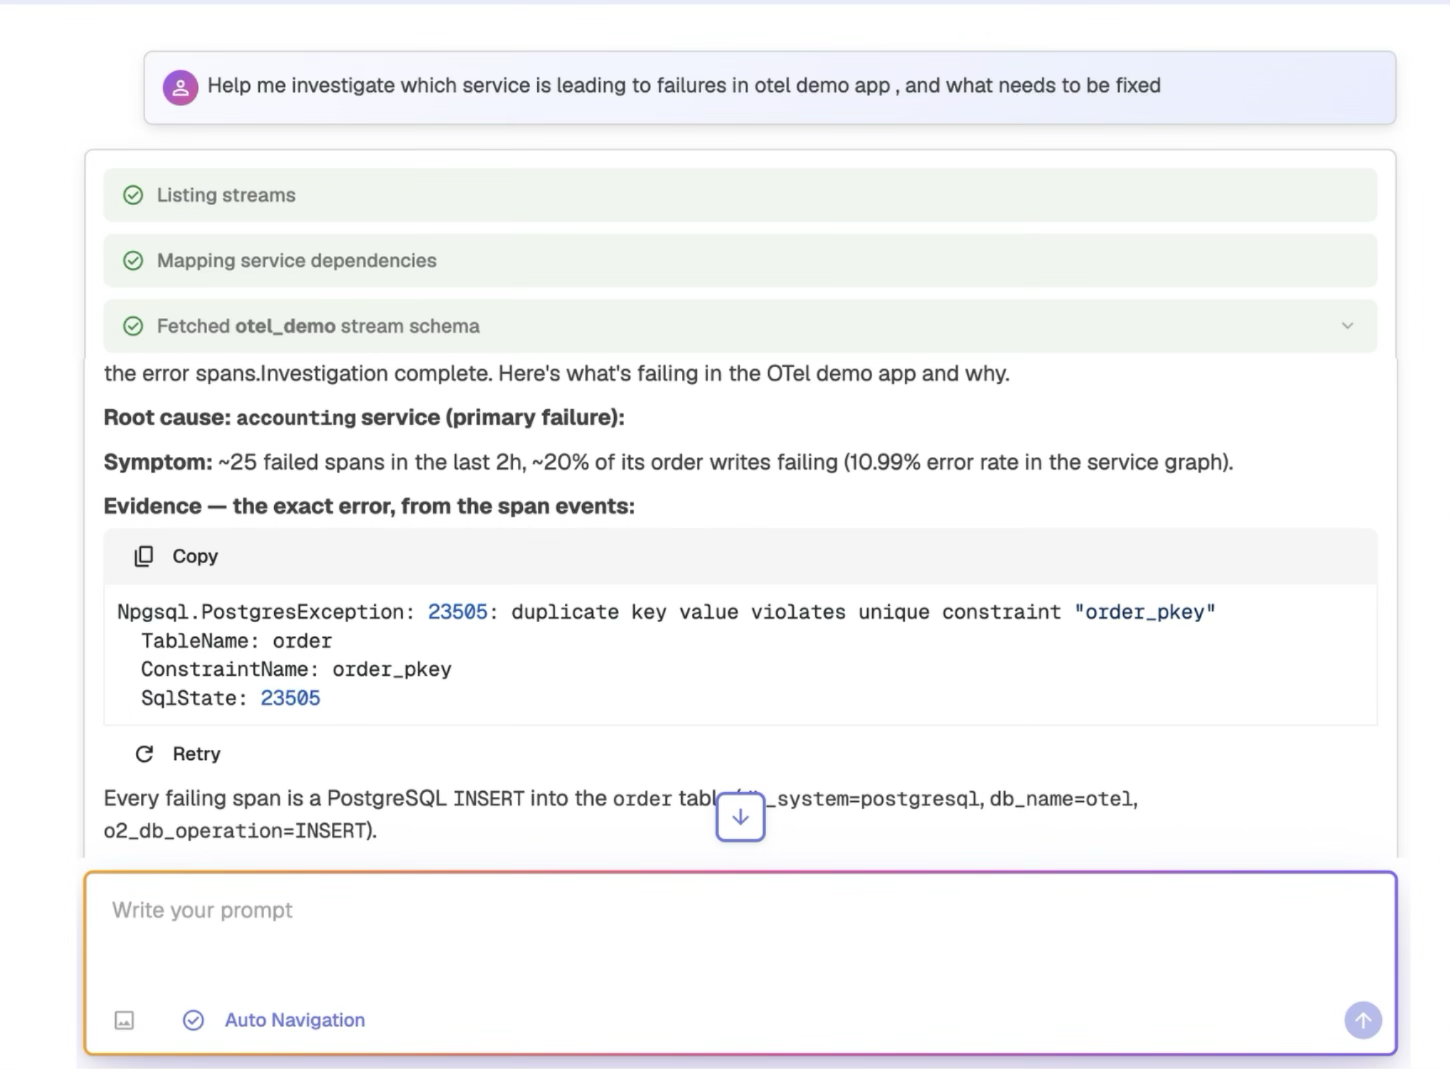
Generate SLO-specific views instantly, the assistant handles queries, burn rate calculations, and error budget panels.
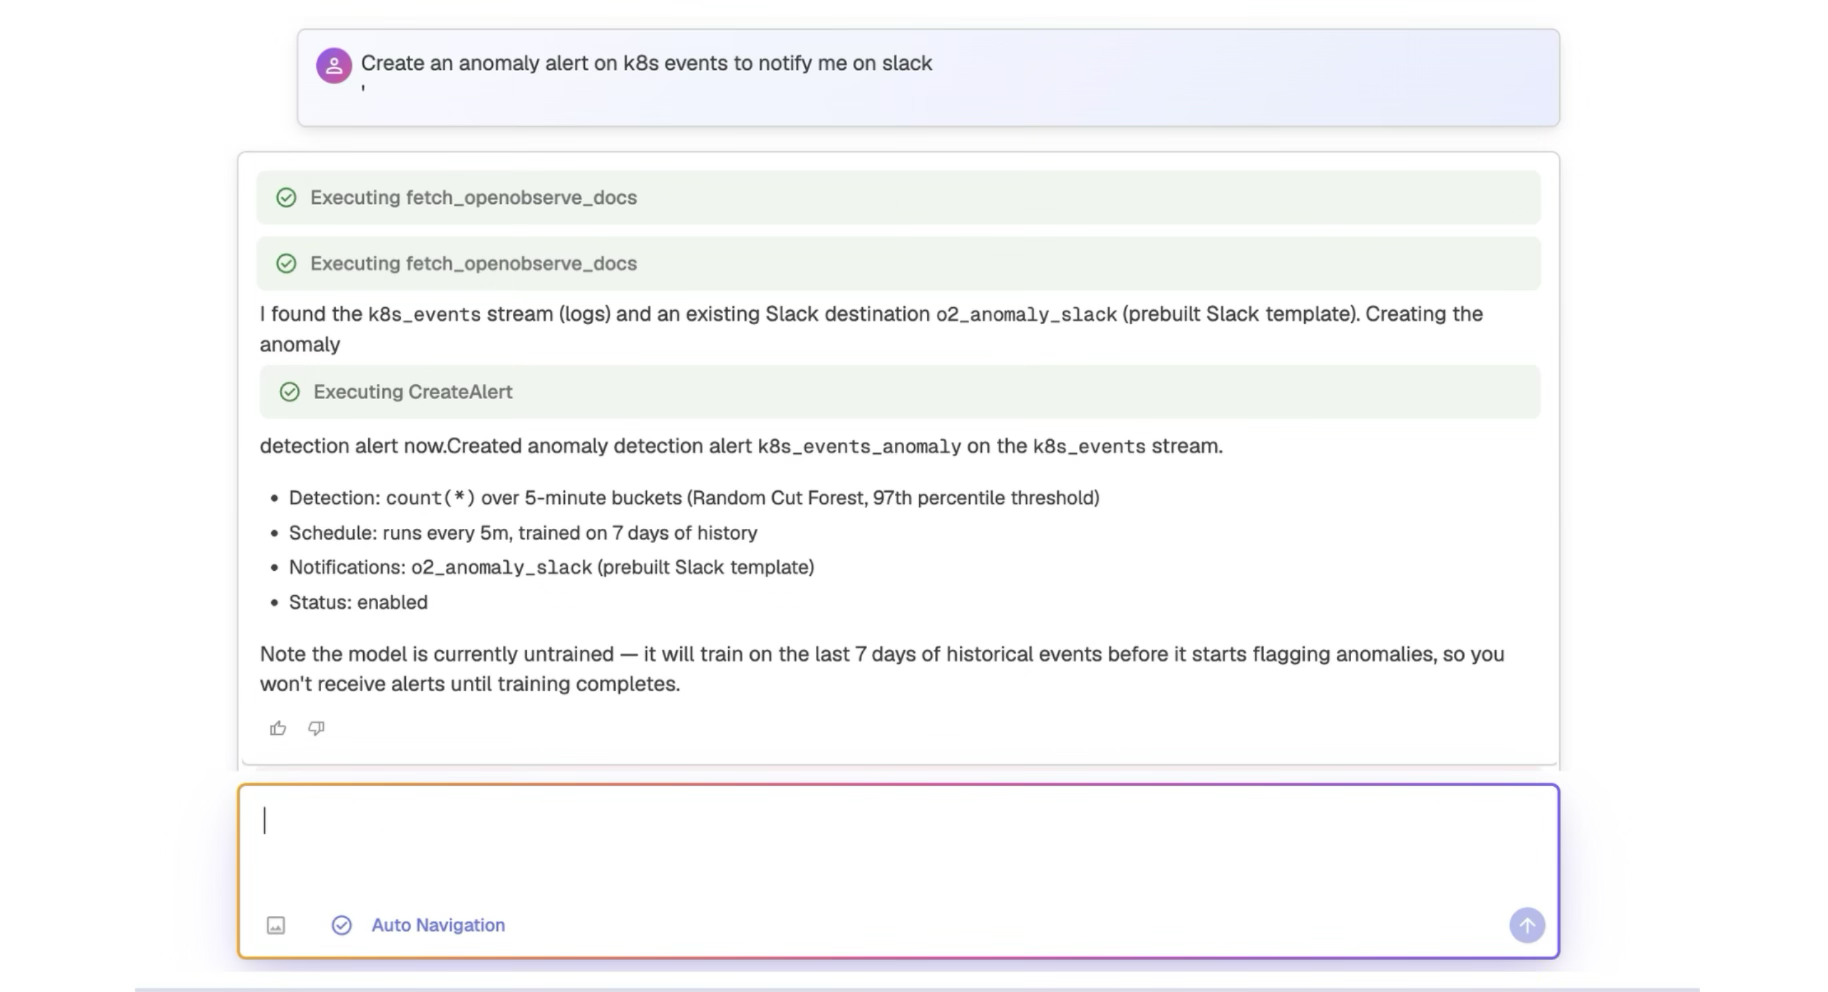
Describe the alert condition you want and the assistant takes it from there.
Explore unfamiliar data structures and build alerts against them without prior knowledge.
Same telemetry, same workloads, one platform. Every number is OpenObserve against a named vendor - not an industry average.
vs. Datadog
8×
more cost-effective
8x cost reduction means you can unify your observability into a single platform.
Read case studyvs. Elastic
140×
storage efficiency
140x storage means longer retention doesn't necessarily mean expensive bills.
Read case studyvs. Grafana stack
5–15×
faster performance
5x to 15x faster queries mean dashboards load in milliseconds, not minutes.
Read case studySee how much you would save switching today.
Correlate between the environments and signals across various sources with OpenObserve built-in correlation engine.
“OpenObserve helped us migrate from Datadog in under an hour... reducing observability costs by 4x.”
4x
Lower observability cost
< 1 hour
Migrated off Datadog
Flat pricing
No month-end surprises
to help you get the most out of the AI Assistant.
Try OpenObserve today for more efficient and performant observability.

AI Observability by OpenObserve
OpenTelemetry-native observability for agents and LLMs.