












“OpenObserve helped us migrate from Datadog in under an hour... reducing observability costs by 4x.”

4x
Lower observability cost

< 1 hour
Migrated off Datadog

Flat pricing
No month-end surprises
Correlate queries, logs, and traces at 140x lower storage cost than Elasticsearch.
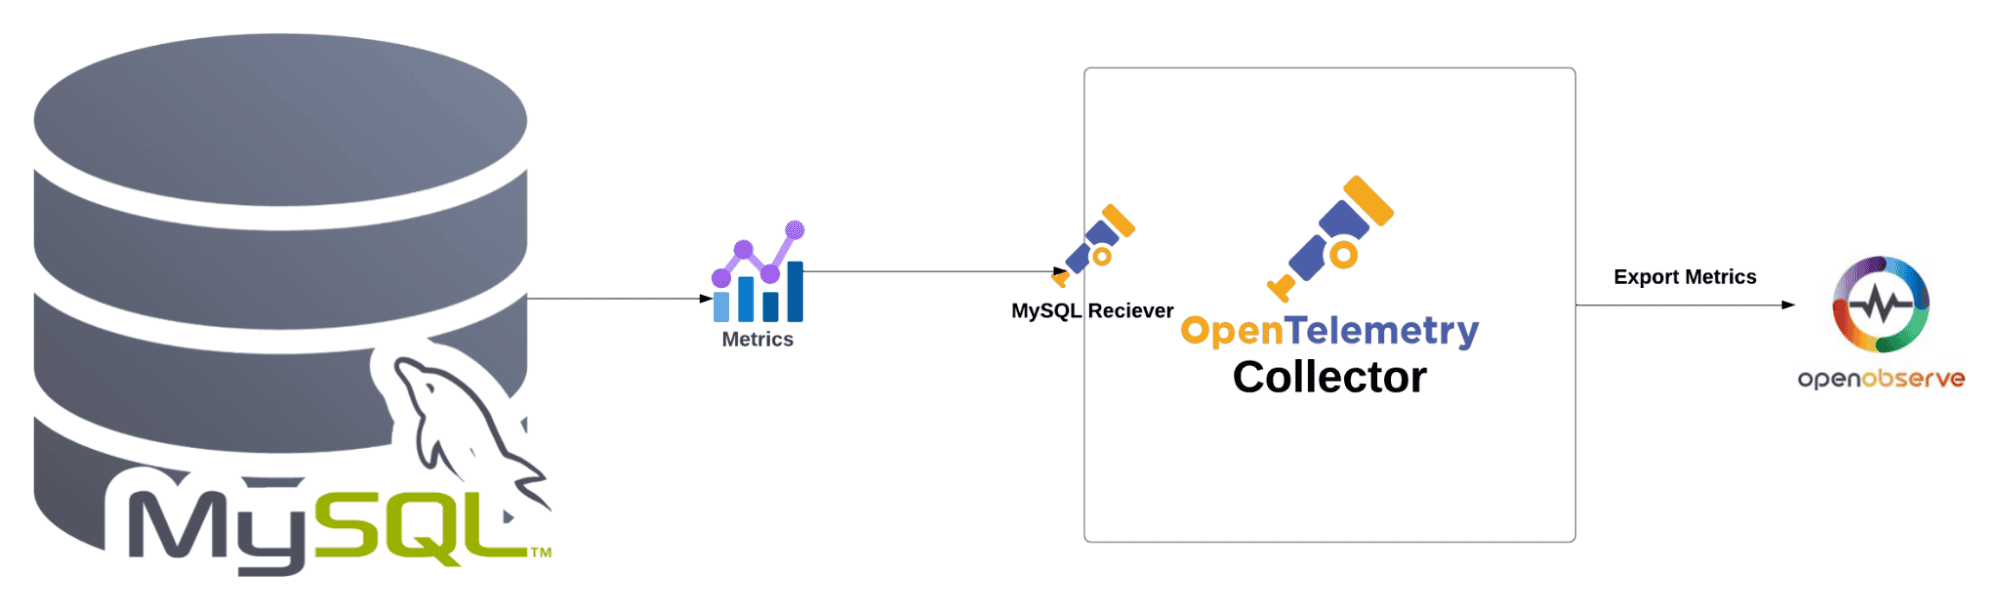
Collect SQL Server metrics with the OpenTelemetry Collector and ship them to OpenObserve.
sqlcmd -S localhost,1433 -U sa -C -Q "CREATE LOGIN otel WITH PASSWORD = '••••••';GRANT VIEW SERVER PERFORMANCE STATE TO otel;GRANT VIEW ANY DATABASE TO otel;"
Step 2 installs the Collector Contrib build - the receiver ships only in Contrib.
Thirteen engines, each with its own receiver and dashboard.
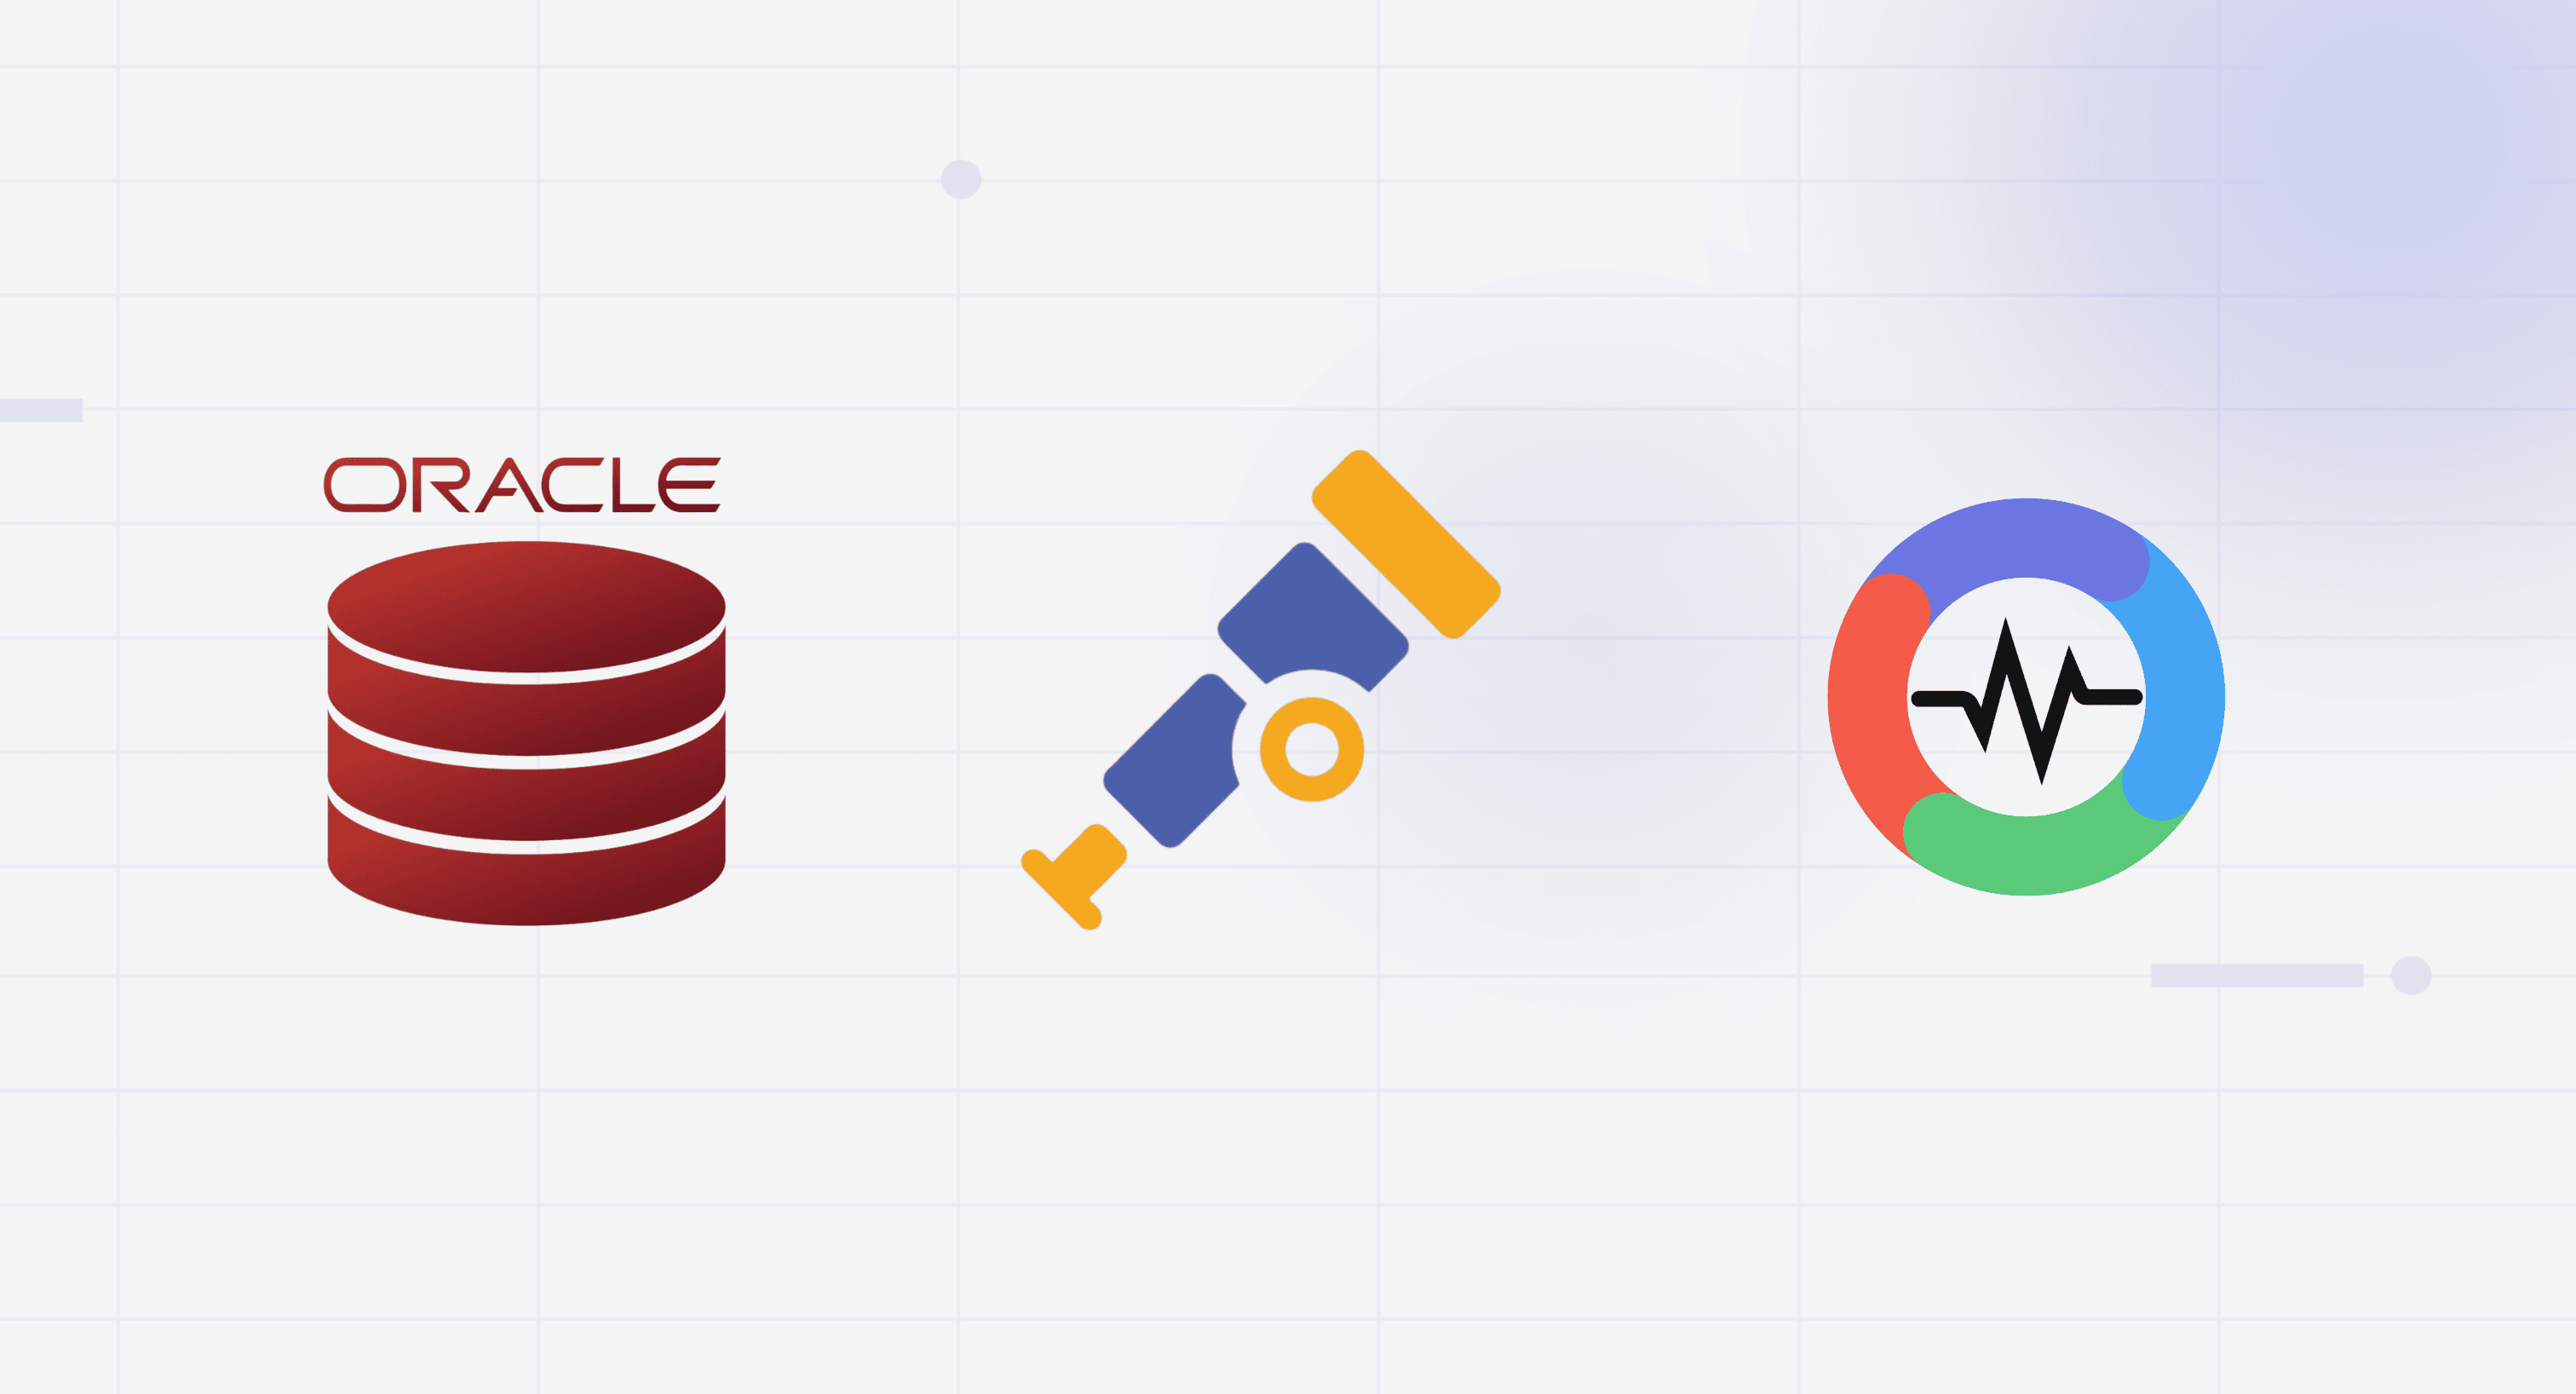
Native integrations or OpenTelemetry. Zero agents. Zero glue code.















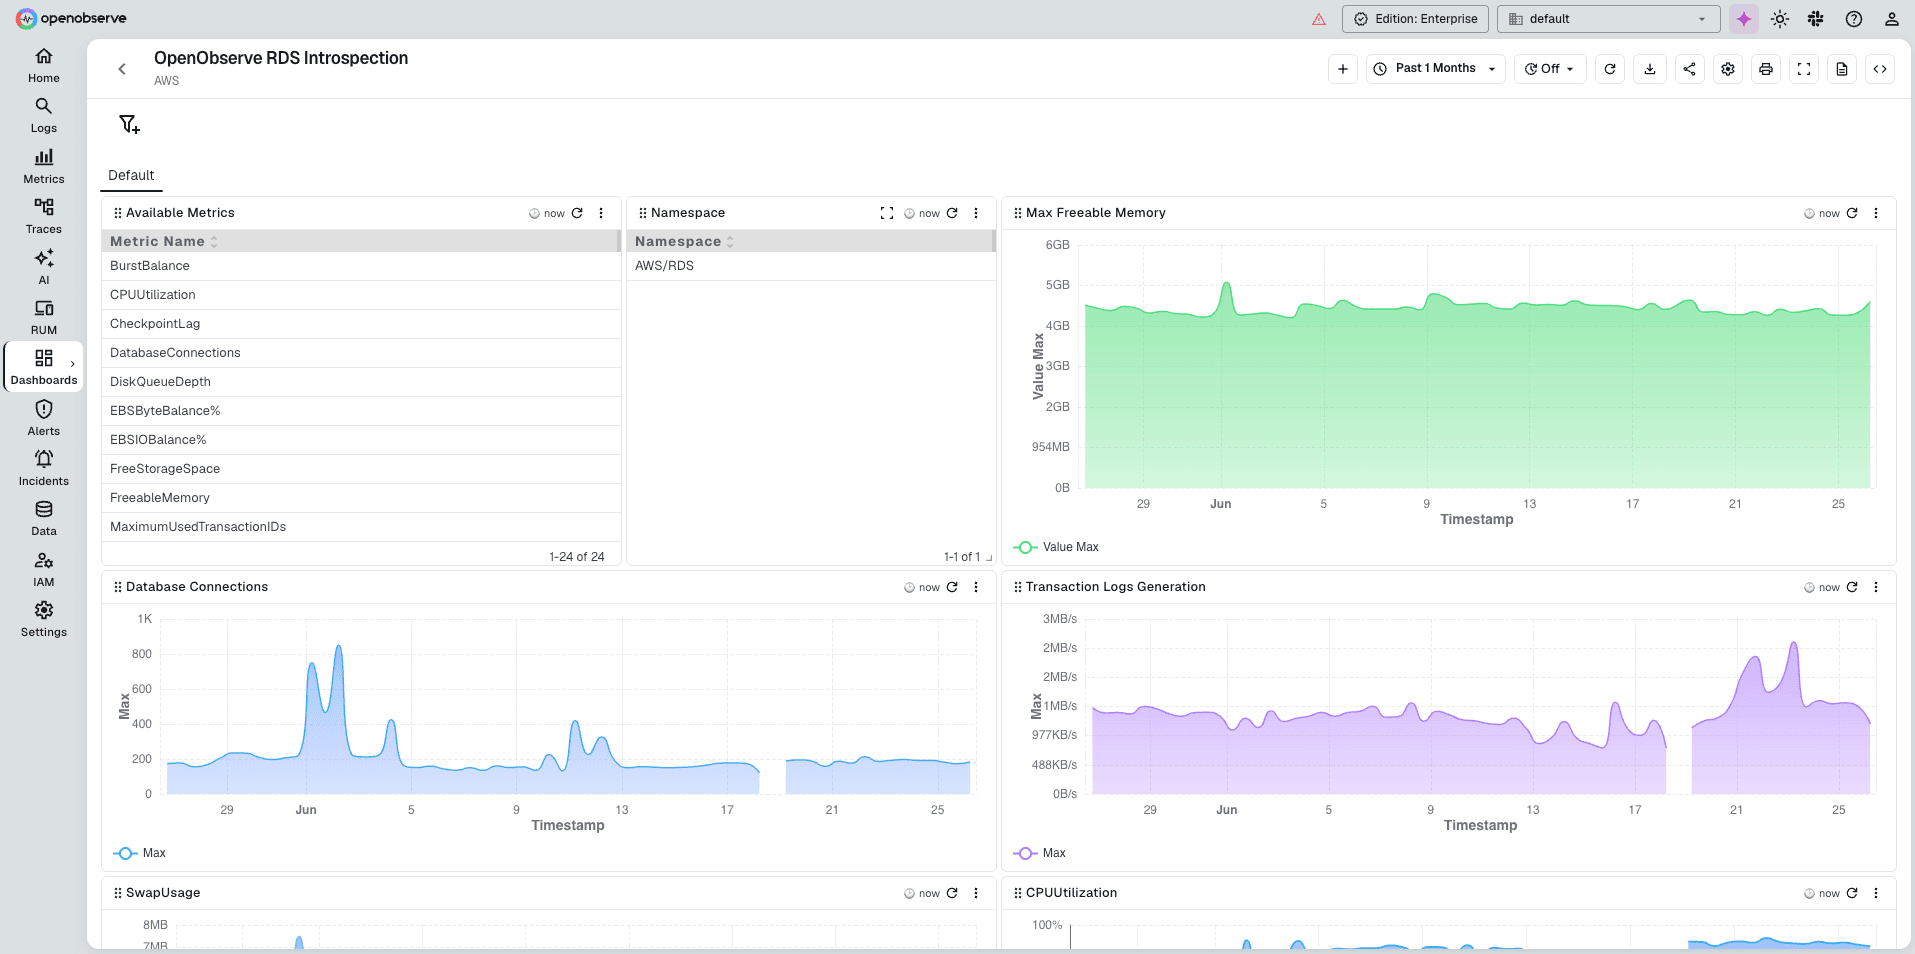
See all your databases in a single pane of glass. Track performance, health metrics, and capacity.
Capture critical database metrics, from query response times to resource utilization patterns, with minimal overhead.
Spot issues before they impact users with dynamic dashboards and instant alerts that keep your databases performing at their peak.
Know exactly where database load is coming from. Track request volumes by user and application alongside hardware and software resource utilization.
Find the queries actually slowing you down. Performance metrics surface bottlenecks and optimization opportunities directly.
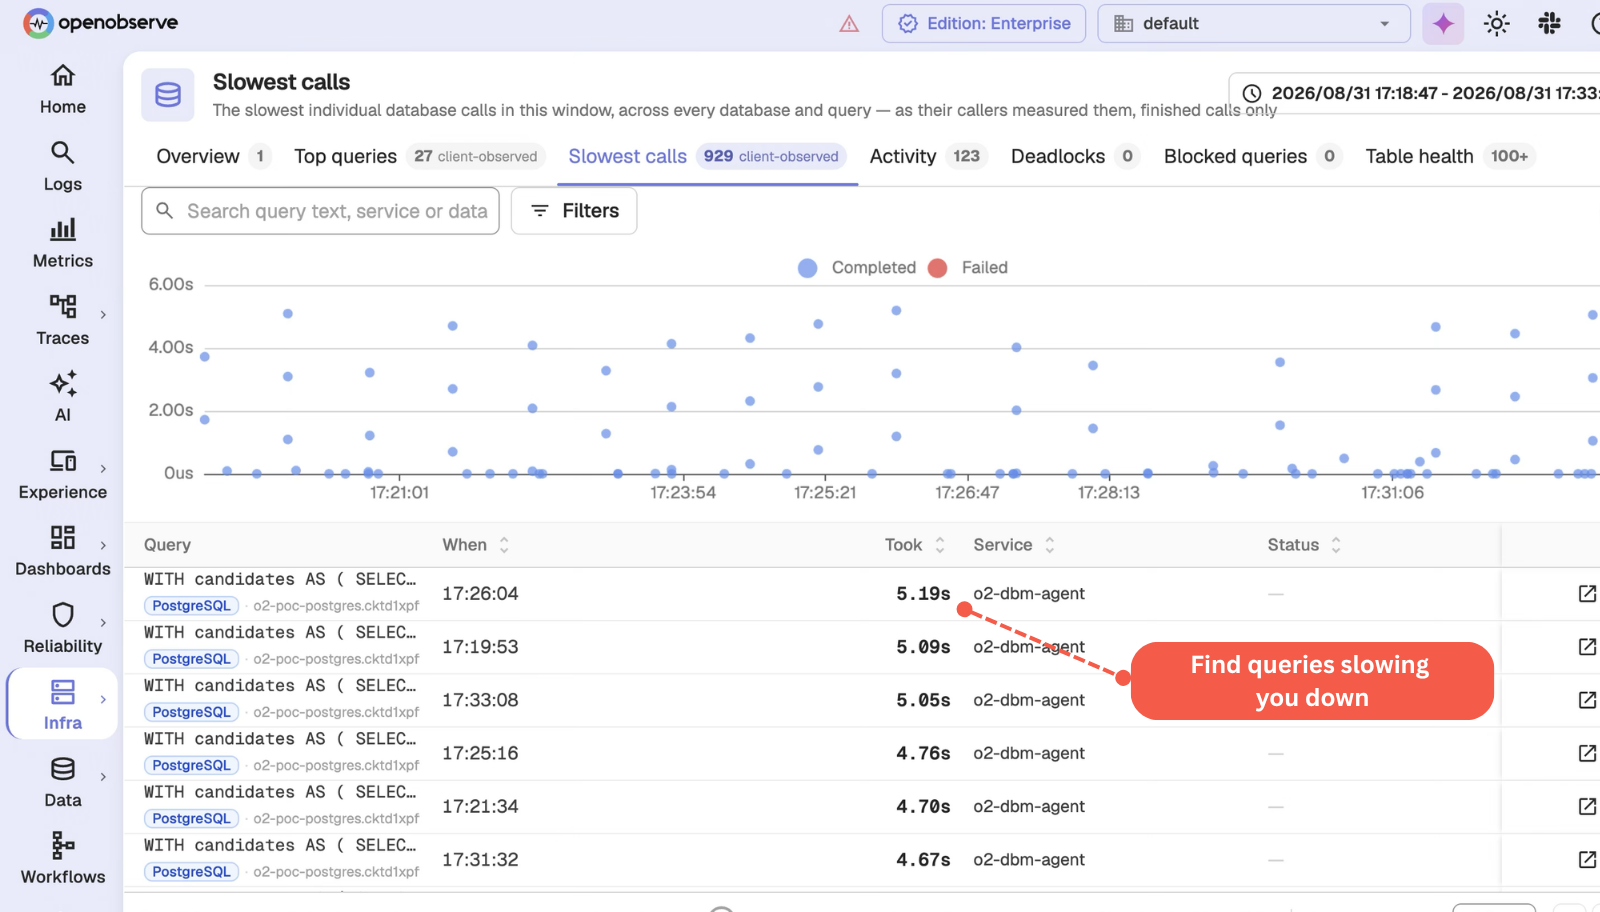
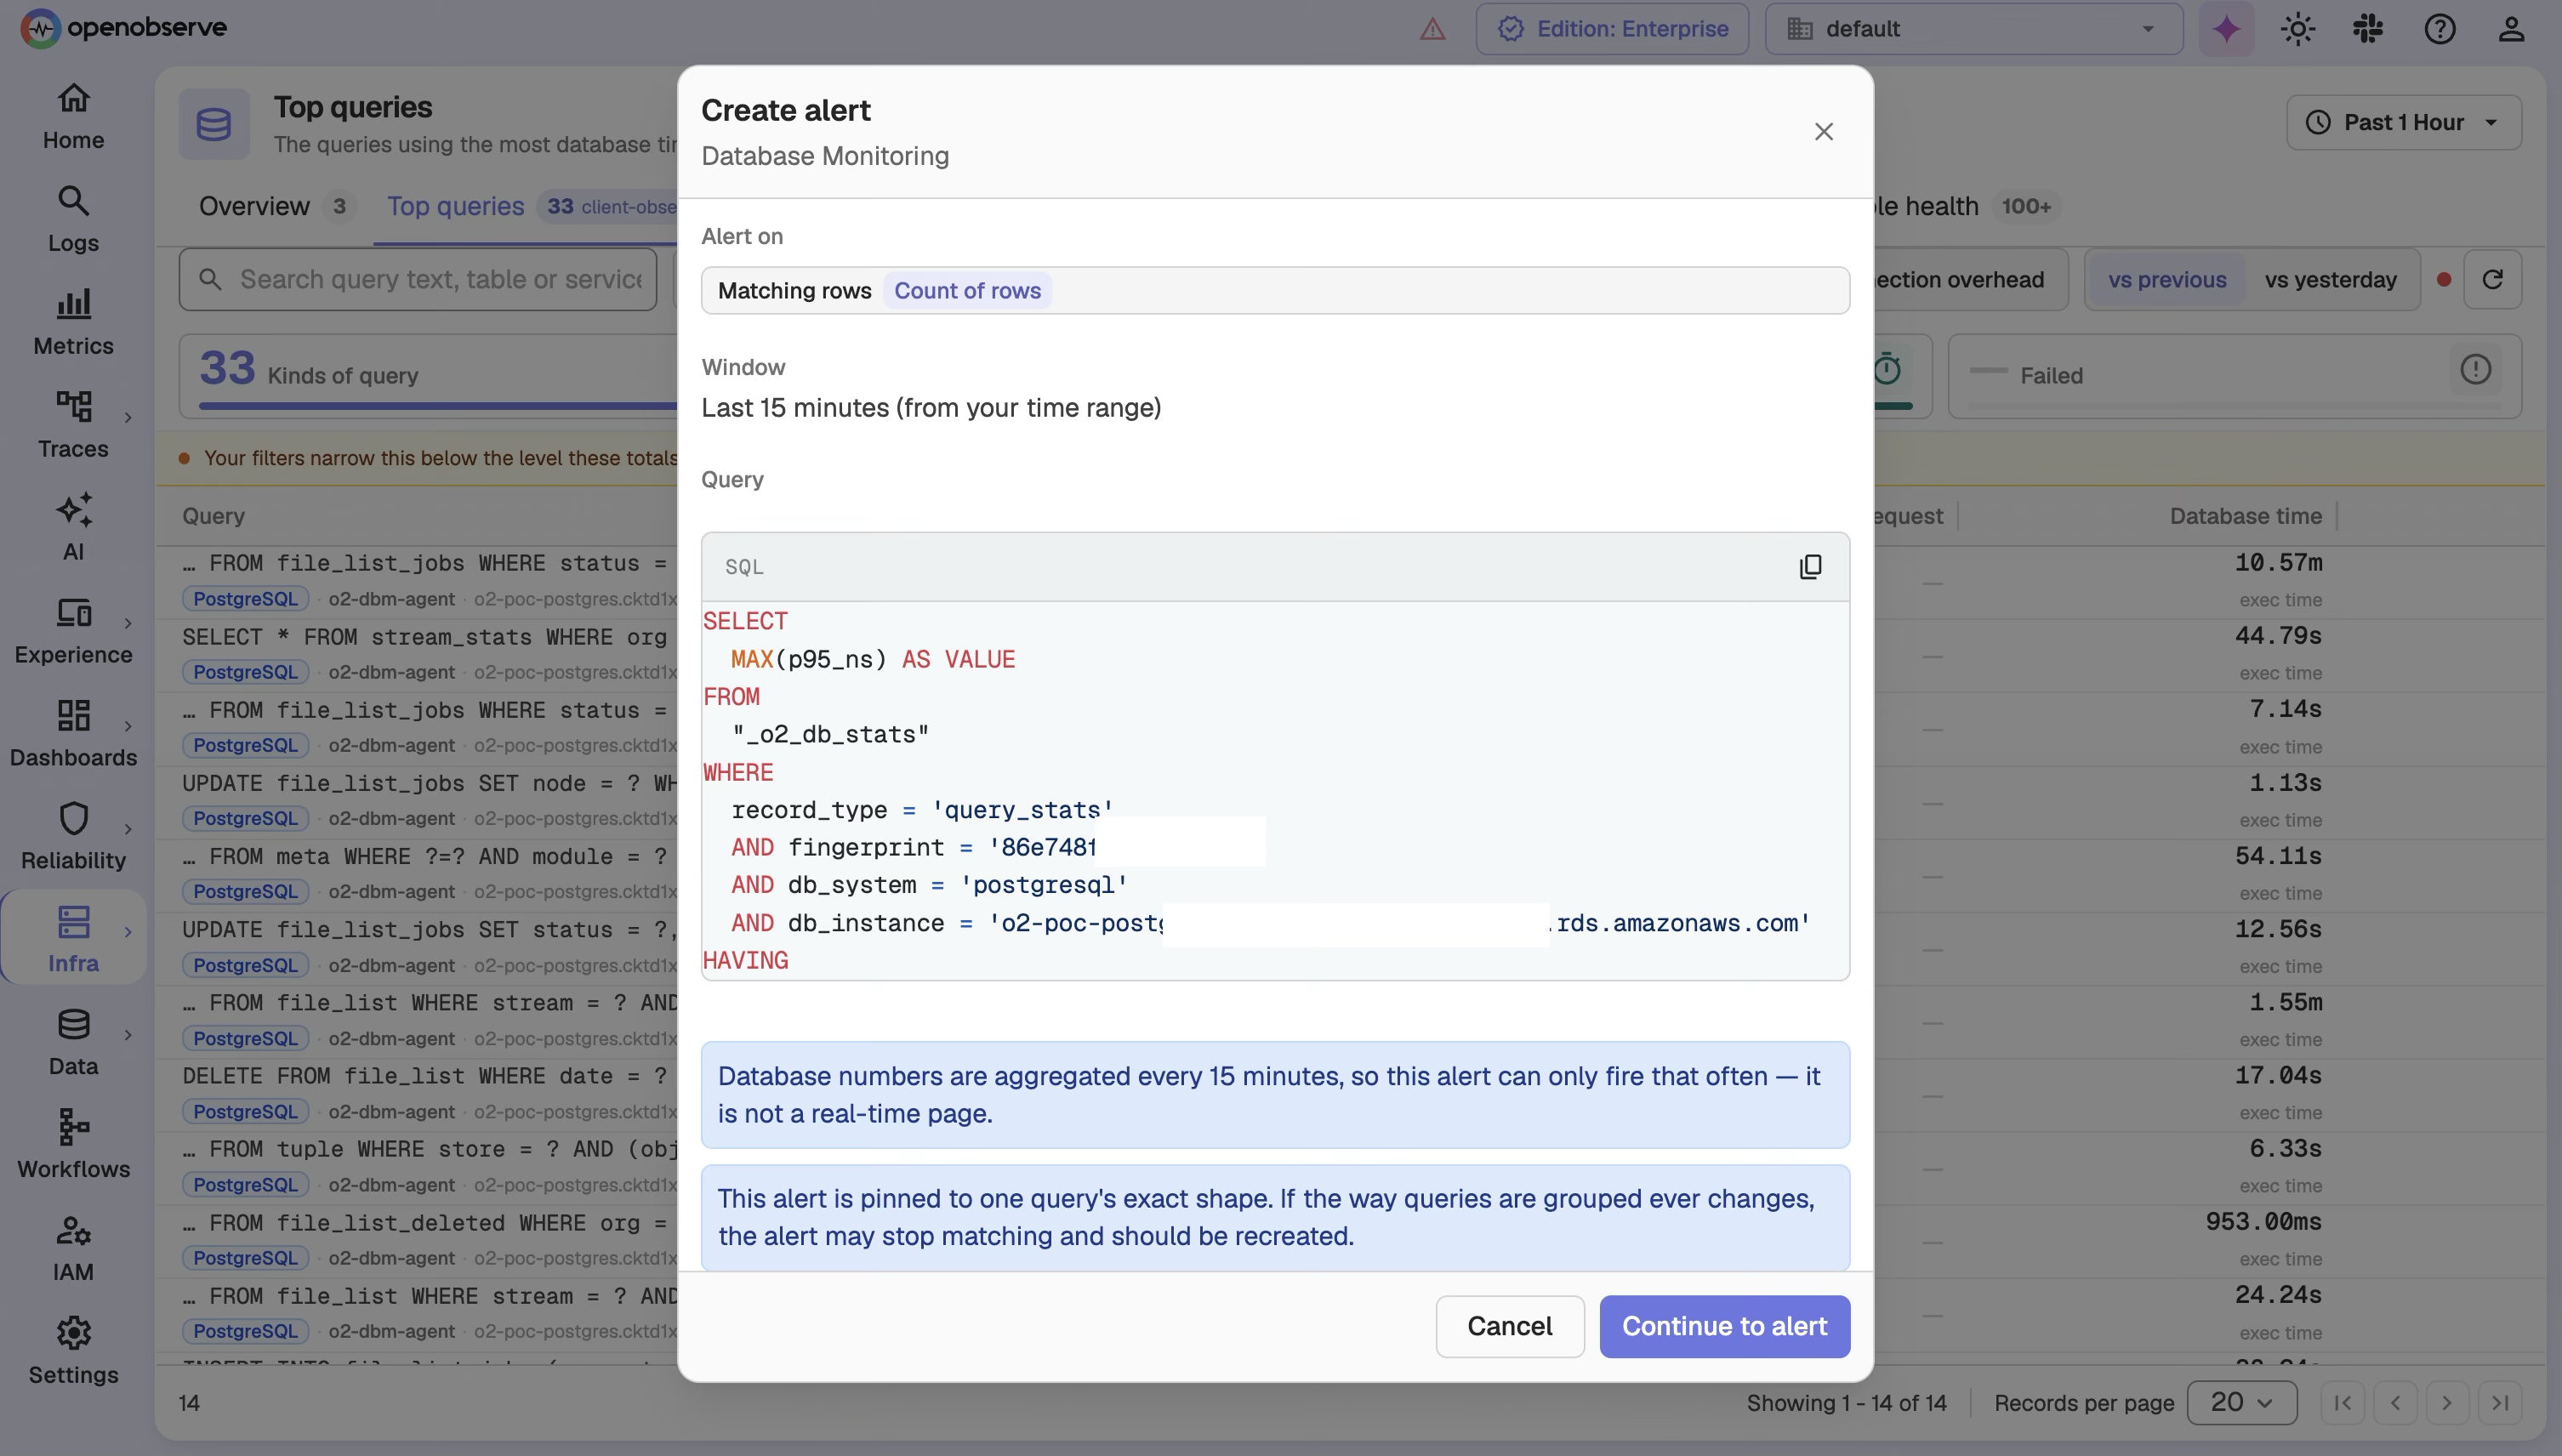
Catch degrading query performance before users notice. Real-time monitoring and alerting flag issues as they develop.
Fix the actual cause, not the symptom. Detailed diagnostics trace error patterns back to the query or configuration behind them.
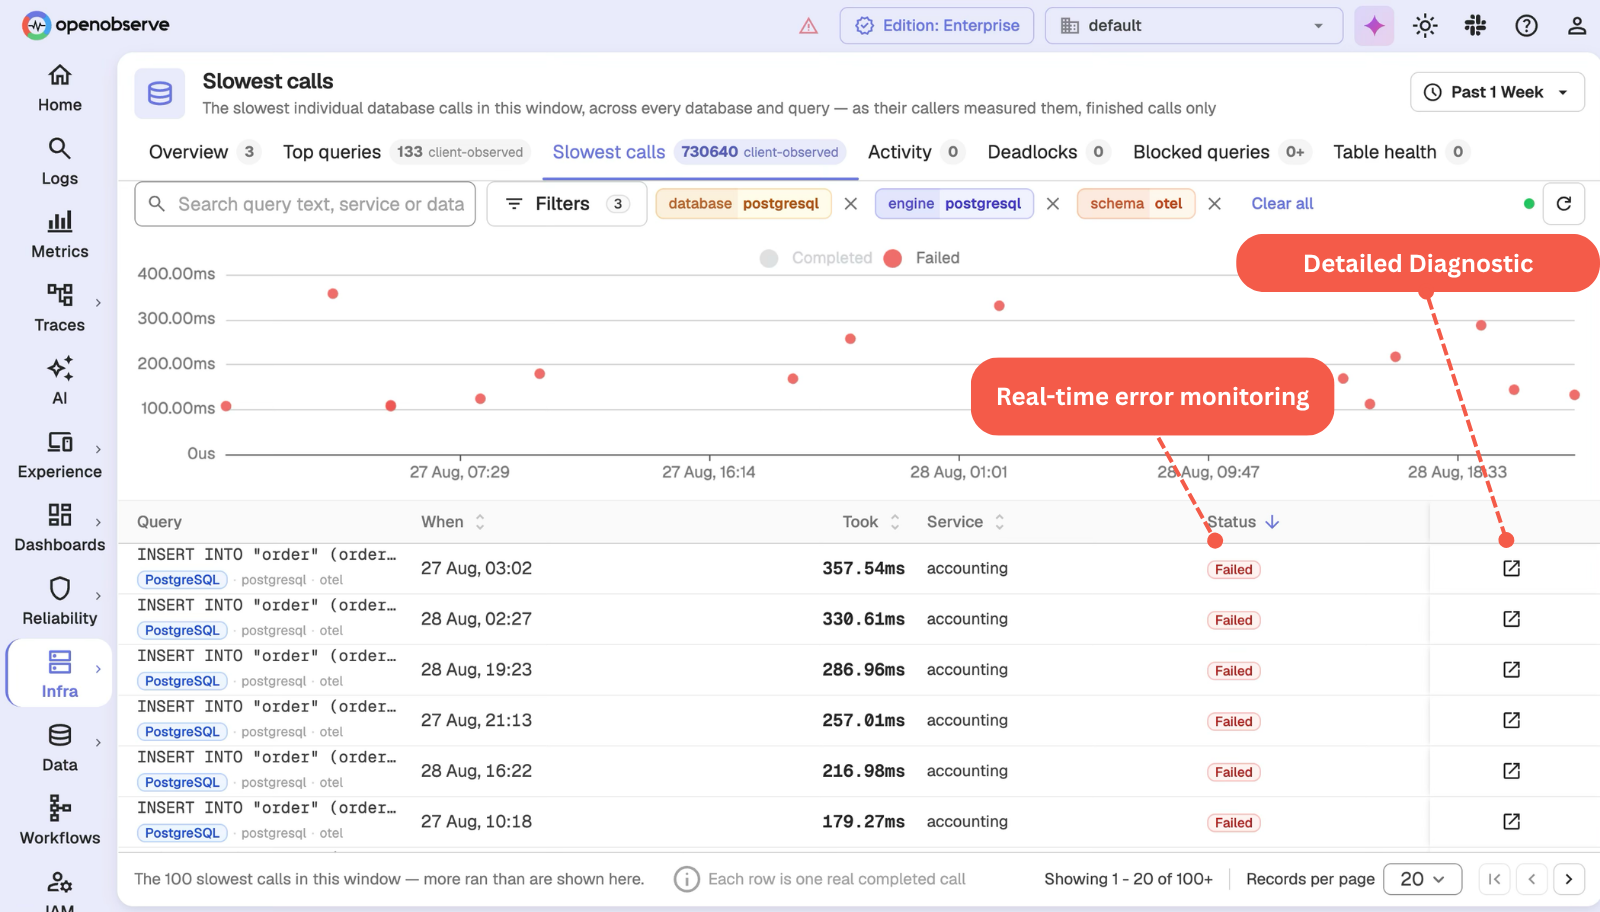
Find slow queries based on how your database is actually used, not assumptions. Response times and resource consumption are tracked per query.
Plan scaling before you need it. Historical trends forecast capacity needs ahead of time.
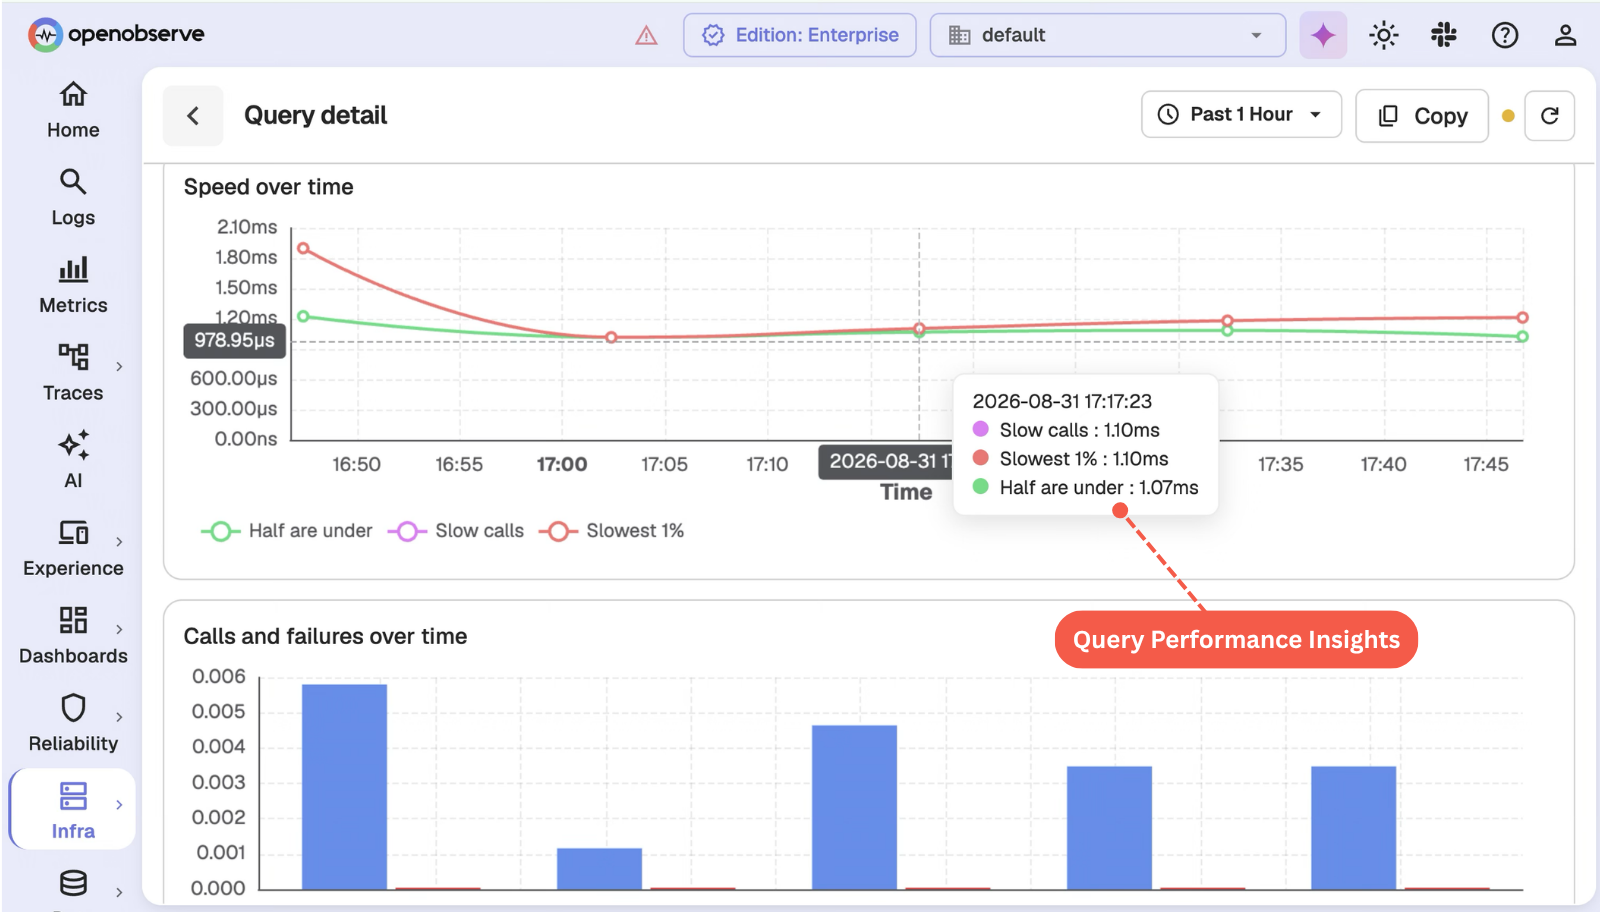
See a database issue in the context of the infrastructure around it, not in isolation.
Get notified before performance drops affect users. Alerts trigger on the thresholds and trends that matter to you.
Same telemetry, same workloads, one platform. Every number is OpenObserve against a named vendor - not an industry average.
vs. Datadog
8×
more cost-effective
8x cost reduction means you can unify your observability into a single platform.
vs. Elastic
140×
storage efficiency
140x storage means longer retention doesn't necessarily mean expensive bills.
vs. Grafana stack
5–15×
faster performance
5x to 15x faster queries mean dashboards load in milliseconds, not minutes.
See how much you'd save switching today.
Correlate between the environments and signals across various sources with OpenObserve built-in correlation engine.
“OpenObserve helped us migrate from Datadog in under an hour... reducing observability costs by 4x.”
4x
Lower observability cost
< 1 hour
Migrated off Datadog
Flat pricing
No month-end surprises
From zero to database dashboards in minutes - no agents to babysit, no pipelines to wire by hand.
See the guideSpin up a in the region closest to you.
Point your slow query logs and metrics at OpenObserve and load prebuilt database dashboards in a couple of clicks.
Watch logs, metrics, and traces stream in - correlated and query-ready from the first event.
to help you get the most out of database monitoring.
Monitor every database you run with prebuilt dashboards, query metrics, logs, and alerting rules. Pick the plan that fits your team.
Self-hosted Enterprise, free up to 50GB. Advanced features for growing teams.
Fully managed OpenObserve in the cloud. Start with a free trial - no infrastructure to run.
Enterprise-grade support, SSO, and SLAs for large-scale, multi-region deployments.

AI Observability by OpenObserve
OpenTelemetry-native observability for agents and LLMs.