“OpenObserve helped us migrate from Datadog in under an hour... reducing observability costs by 4x.”

4x
Lower observability cost

< 1 hour
Migrated off Datadog

Flat pricing
No month-end surprises
OpenTelemetry-native. No sampling.
Gain end-to-end visibility into your distributed systems, powered by OpenTelemetry.
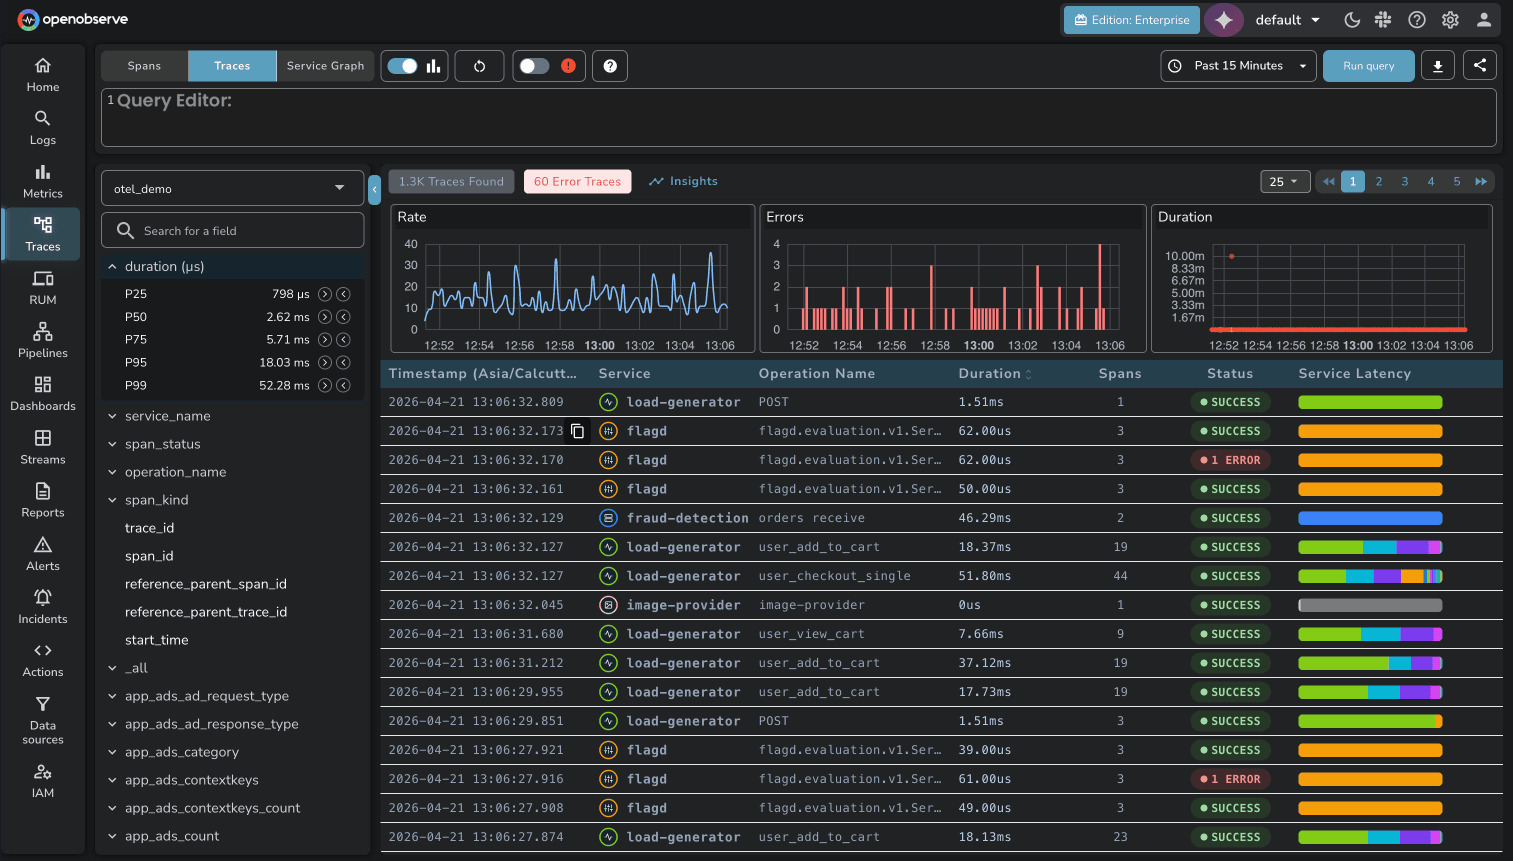
Visualize and troubleshoot metrics, logs, and traces in a single pane of glass.
Apache Parquet compression without losing query speed.
Standardized collection with zero vendor lock-in.
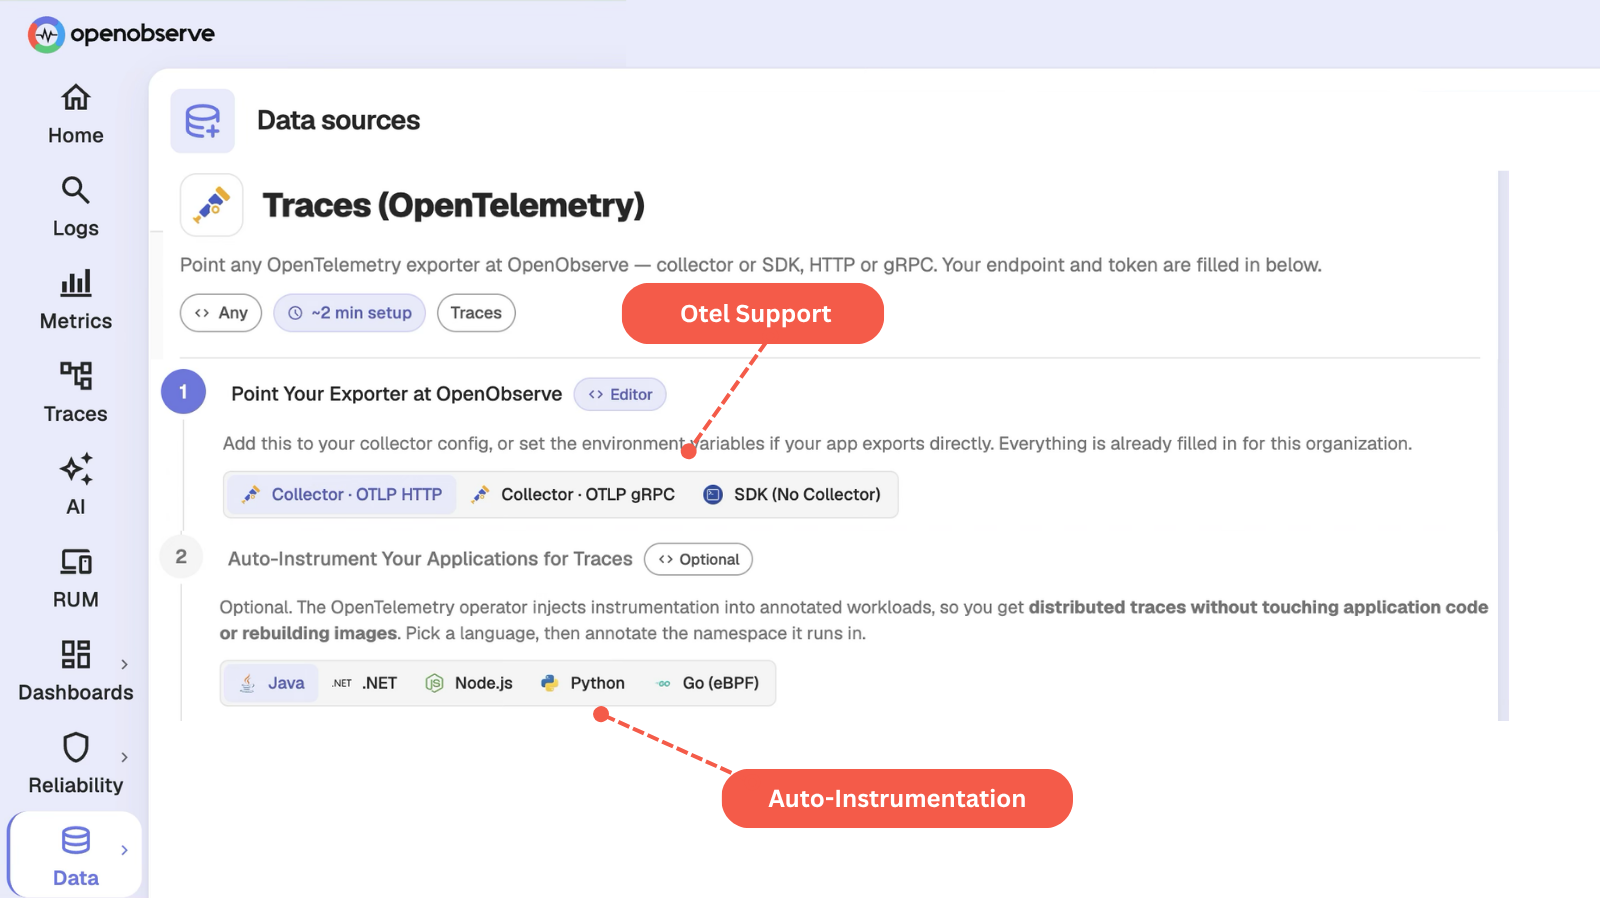
Collect traces through native OTLP. Instrument applications once and export traces directly to OpenObserve, no vendor lock-in.
Capture distributed traces using zero-code auto-instrumentation configured by the OpenObserve collector.
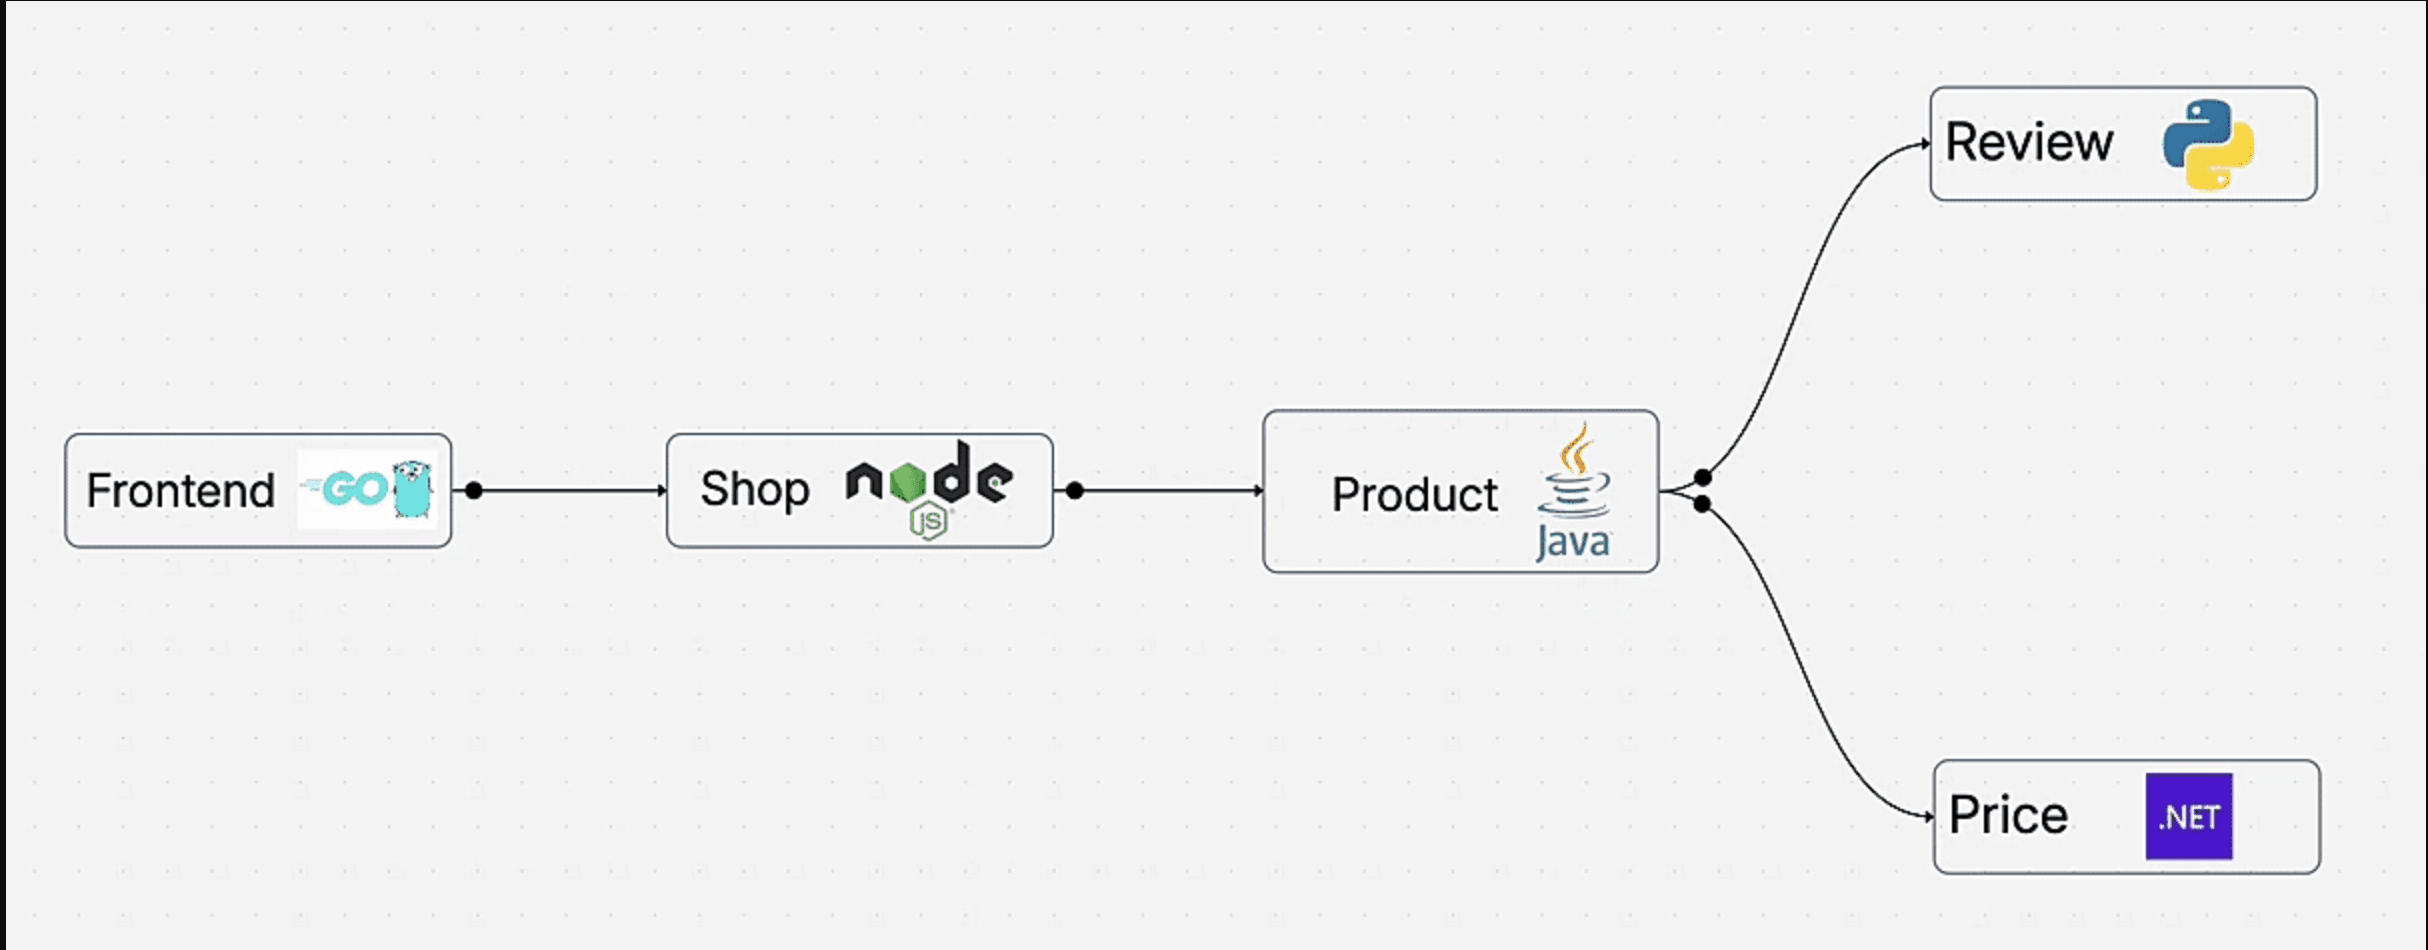
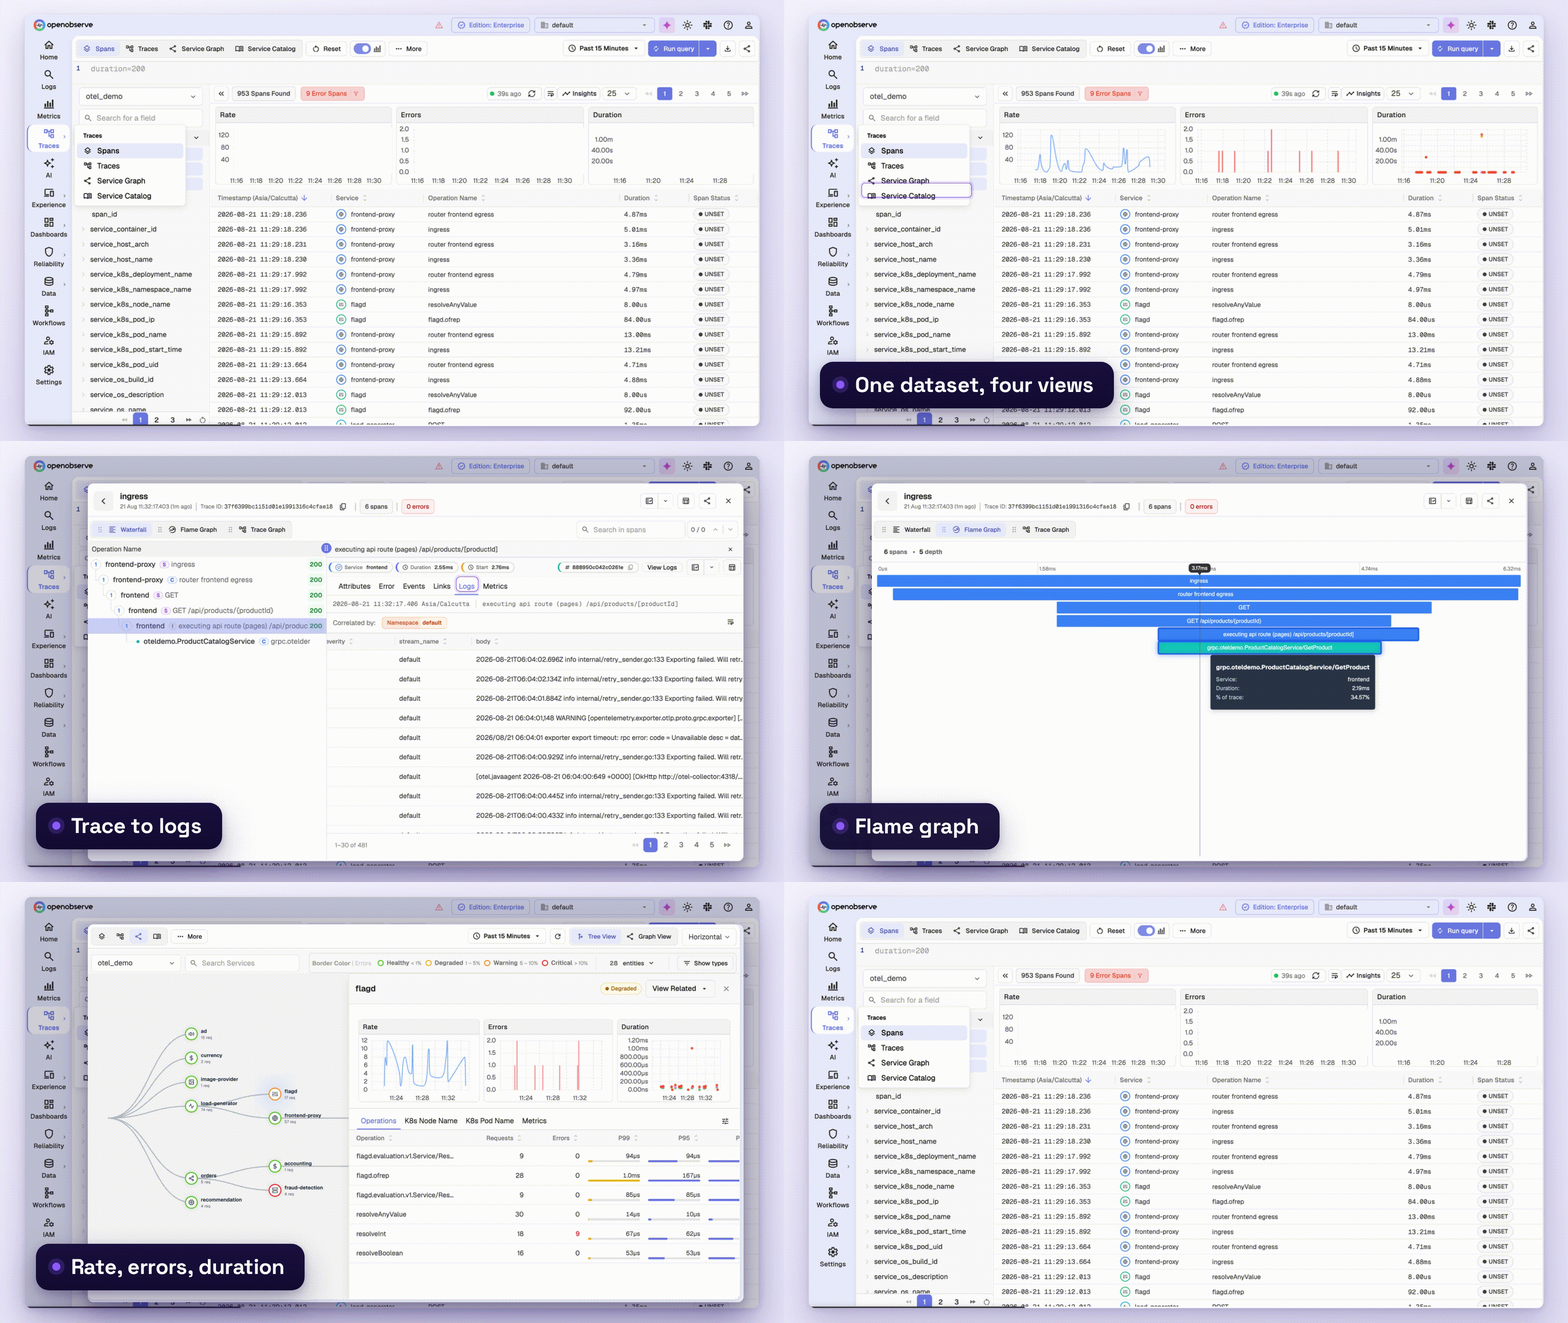
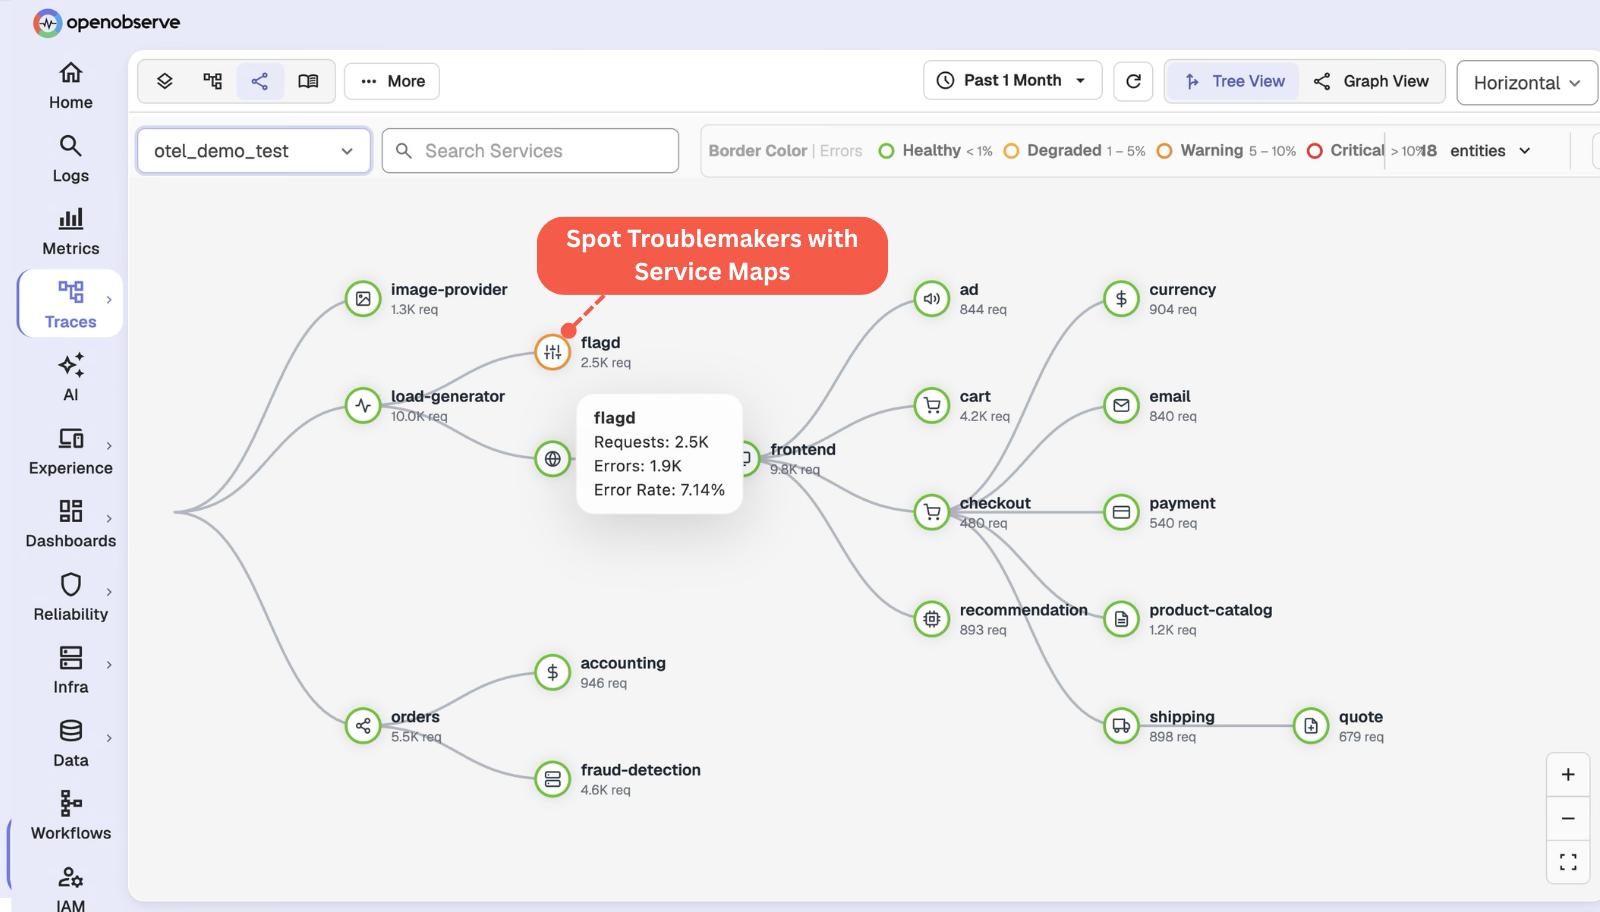
See your microservices in action. Real-time service maps reveal how your systems truly connect.
Spot troublemakers instantly with latency heatmaps and error trend analysis. Compare trace durations across versions to catch performance drops before users do.
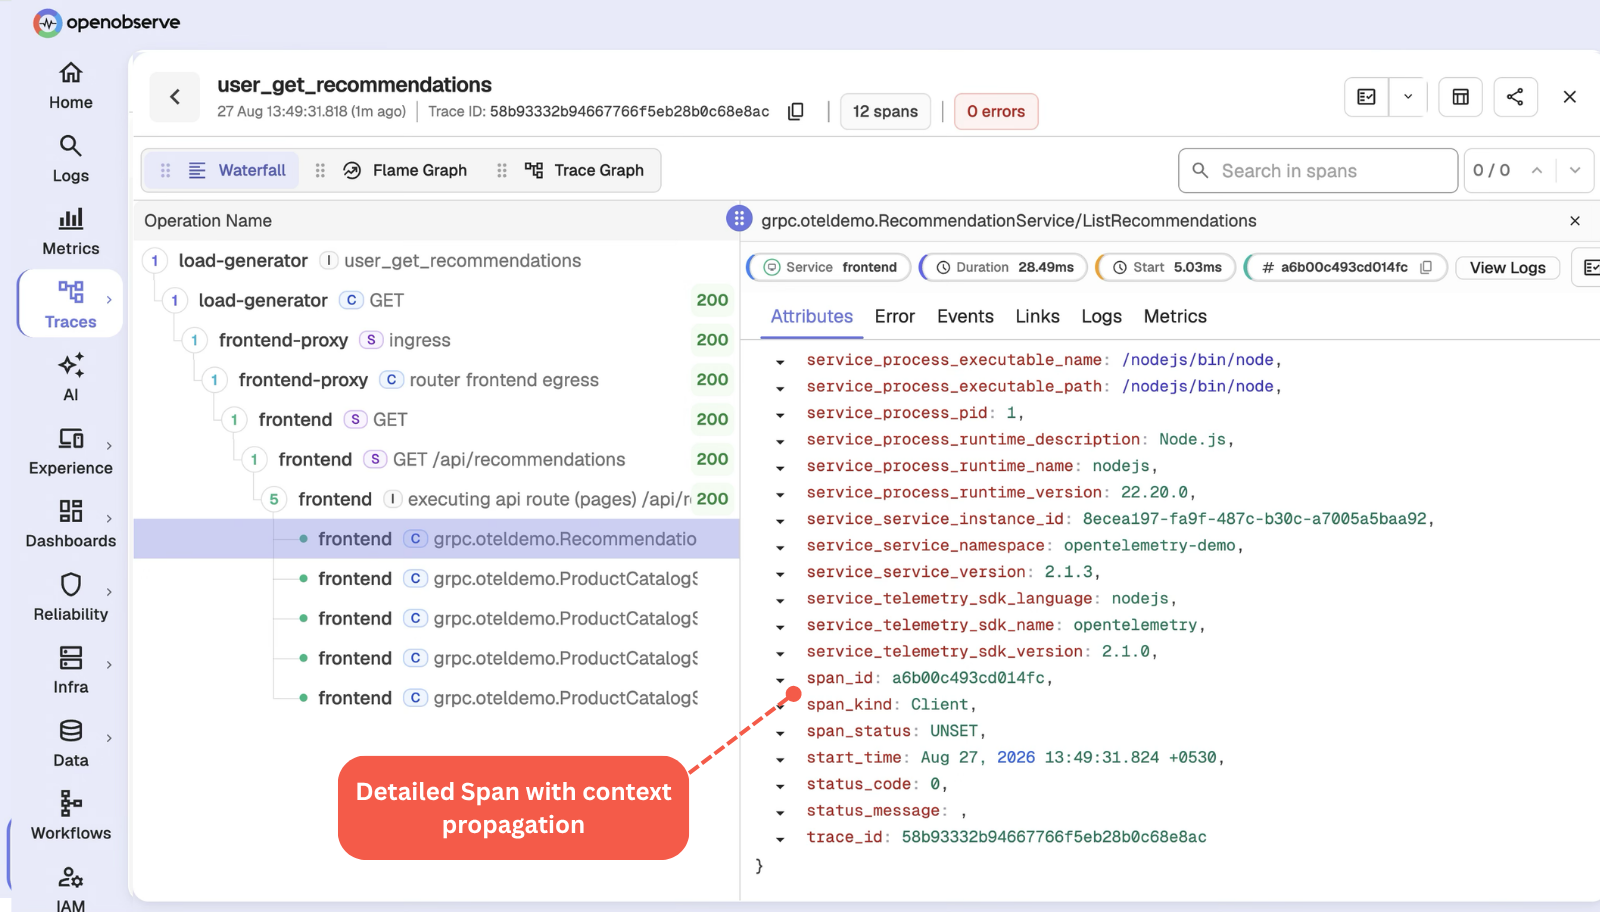
Dive deep into every operation, examine spans with precise timing, tags, and logs. One click takes you from overview metrics to the exact problematic trace span.
Follow requests anywhere with W3C trace context support. Visualize complete transaction journeys through your stack with flame graphs and waterfall diagrams.
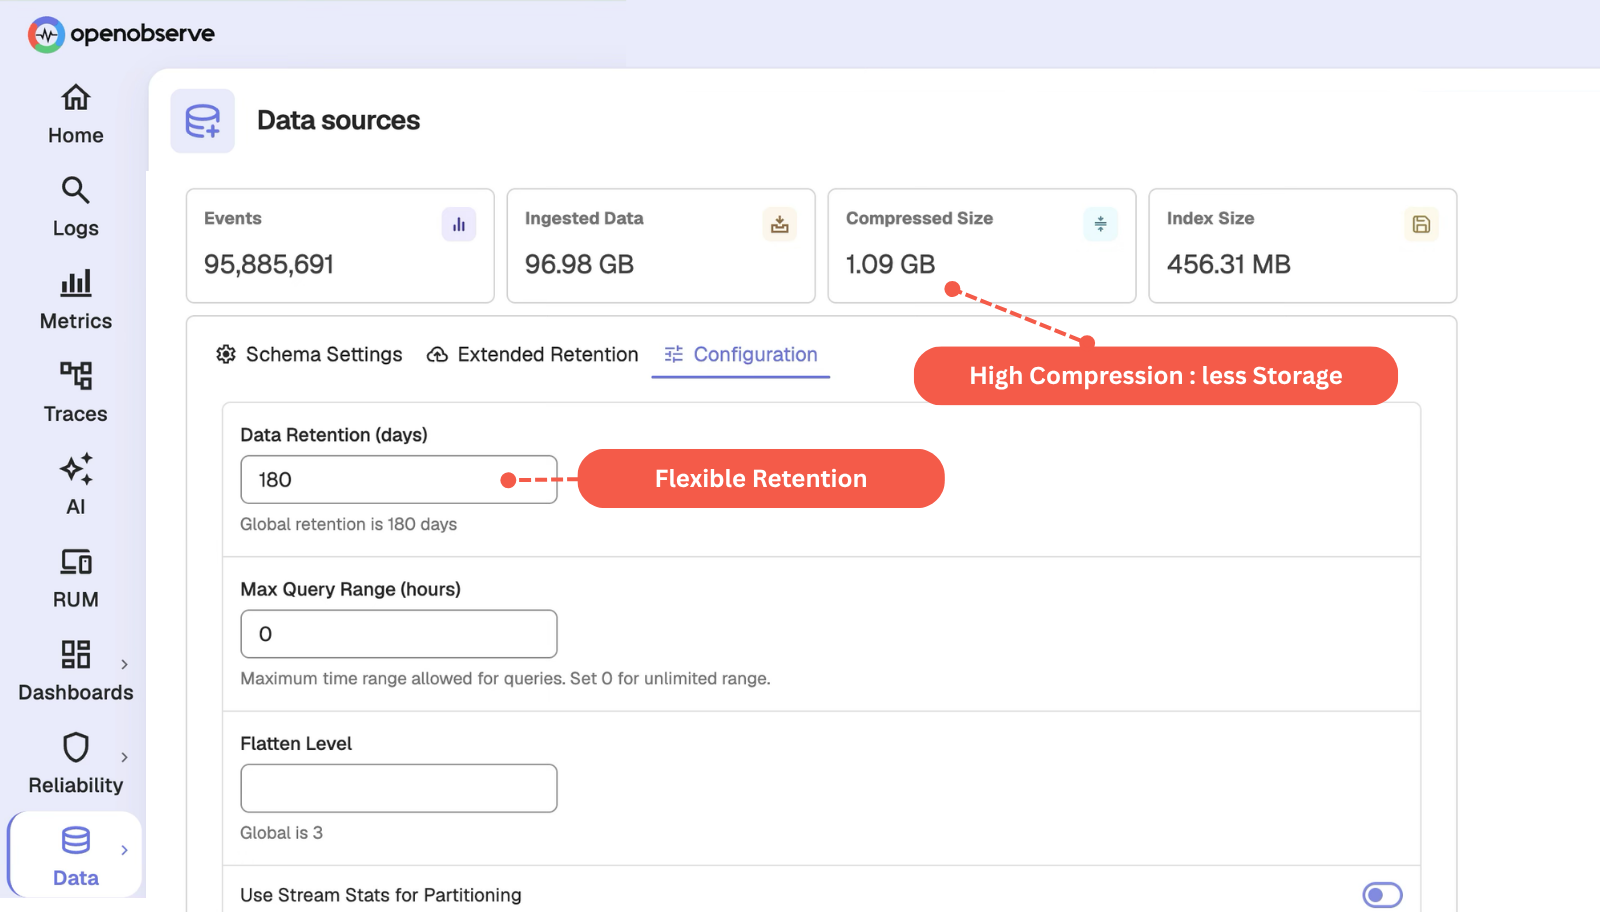
Slash storage costs to 1/140th of Elasticsearch with Apache Parquet’s columnar format, exceptional compression without sacrificing query performance.
Set retention policies your way, no complex tiered storage needed. OpenObserve leverages object storage as your hot tier.
Same telemetry, same workloads, one platform. Every number is OpenObserve against a named vendor - not an industry average.
vs. Datadog
8×
more cost-effective
8x cost reduction means you can unify your observability into a single platform.
Read case studyvs. Elastic
140×
storage efficiency
140x storage means longer retention doesn't necessarily mean expensive bills.
Read case studyvs. Grafana stack
5–15×
faster performance
5x to 15x faster queries mean dashboards load in milliseconds, not minutes.
Read case studySee how much you would save switching today.
Correlate between the environments and signals across various sources with OpenObserve built-in correlation engine.
“OpenObserve helped us migrate from Datadog in under an hour... reducing observability costs by 4x.”
4x
Lower observability cost
< 1 hour
Migrated off Datadog
Flat pricing
No month-end surprises
to help you get the most out of Traces.
Try OpenObserve today for more efficient and performant observability.

AI Observability by OpenObserve
OpenTelemetry-native observability for agents and LLMs.