DataDog vs OpenObserve Part 4: Dashboards - Prebuilt, Drag & Drop, Custom Visualizations, Up to 98% Cost Savings




Ready to get started?
Try OpenObserve Cloud today for more efficient and performant observability.
DataDog vs OpenObserve Part 4: Dashboards - Prebuilt, Drag & Drop, Custom Visualizations
Your DataDog bill jumped 40% last month. Again. You didn't change anything significant, yet costs escalated. Now you're choosing between full observability and budget predictability.
This is the reality for teams using DataDog: multi-dimensional pricing (hosts, custom metrics, indexed spans, feature tiers) makes cost forecasting nearly impossible. The fundamental question shifts from "what should we monitor?" to "what can we afford to monitor?" Engineers hesitate before adding instrumentation. Architects design around billing optimization, not operational needs.
This hands-on comparison tests DataDog and OpenObserve as OpenTelemetry-native observability platforms, sending identical production-like data to both platforms simultaneously. The results show how these platforms handle dashboard creation, custom visualizations, and operational flexibility with the same production-like data.
OpenObserve transforms the fundamental question from "can we afford to monitor this?" to "what do we need to monitor?" The platform provides comprehensive system visibility without cost-driven compromises.
This is Part 4 in a series comparing DataDog and OpenObserve for observability (security use cases excluded):
- Full comparison
- Part 1: Logs - Automatic Field Discovery, SQL Queries, and 90% Cost Savings
- Part 2: Metrics - Drag & Drop, SQL, PromQL, High Cardinality
- Part 3: Traces/APM - OTel Native, No Hidden Tiers
- Part 4: Dashboards - Prebuilt, Drag & Drop, Custom
- Part 5: Alerts, Monitors, Destinations
- Part 6: Real User Monitoring
- Part 7: Pipelines
- Part 8: IAM SSO, RBAC
- Part 9: Cost
TL;DR: 7 Key Findings
- Cost Reality: Same dashboard capabilities at 98% lower cost ($174/day DataDog vs $3/day OpenObserve from identical test data)
- Dual Mode: Builder (auto) for drag-drop + Custom mode for SQL/PromQL vs DataDog's widgets with proprietary syntax
- Custom Charts: SQL + JavaScript + ECharts for advanced visualizations (Enterprise). DataDog requires UI Extensions (React/TypeScript development) or Wildcard (Vega-Lite only)
- Community Dashboards: Open GitHub library covering Kubernetes, Docker, PostgreSQL, AWS, Snowflake, LLM observability. DataDog provides vendor-controlled integration dashboards
- Variables & Dependencies: Both platforms support interactive filtering and cascading variables. Feature parity
- LLM Observability Dashboards: DataDog charges $120/day premium for LLM traces. OpenObserve treats as standard data at $0.30/GB flat rate
- OpenTelemetry Native: Full OTel compatibility without vendor lock-in, no proprietary agents required
What We Tested
We built monitoring dashboards covering standard scenarios: container CPU utilization, PostgreSQL metrics, host metrics, request rates, error rates, and latency percentiles using the OpenTelemetry Astronomy Shop demo.
All services were instrumented with OpenTelemetry SDKs sending logs, metrics, and traces to the OTel Collector, which exported to both DataDog and OpenObserve simultaneously. Same data, same timestamps, same volumes.
Dashboard Creation: Builder vs Custom Mode
Creating operational dashboards requires balancing simplicity for common cases with flexibility for complex analysis.
DataDog offers drag-and-drop widgets, extensive visualizations (timeseries, heatmaps, top lists), and pre-built templates. The UI is polished. After selecting a widget type, you can either build the panel through UI interactions (dropdowns, buttons) or write queries yourself using DataDog's proprietary syntax.
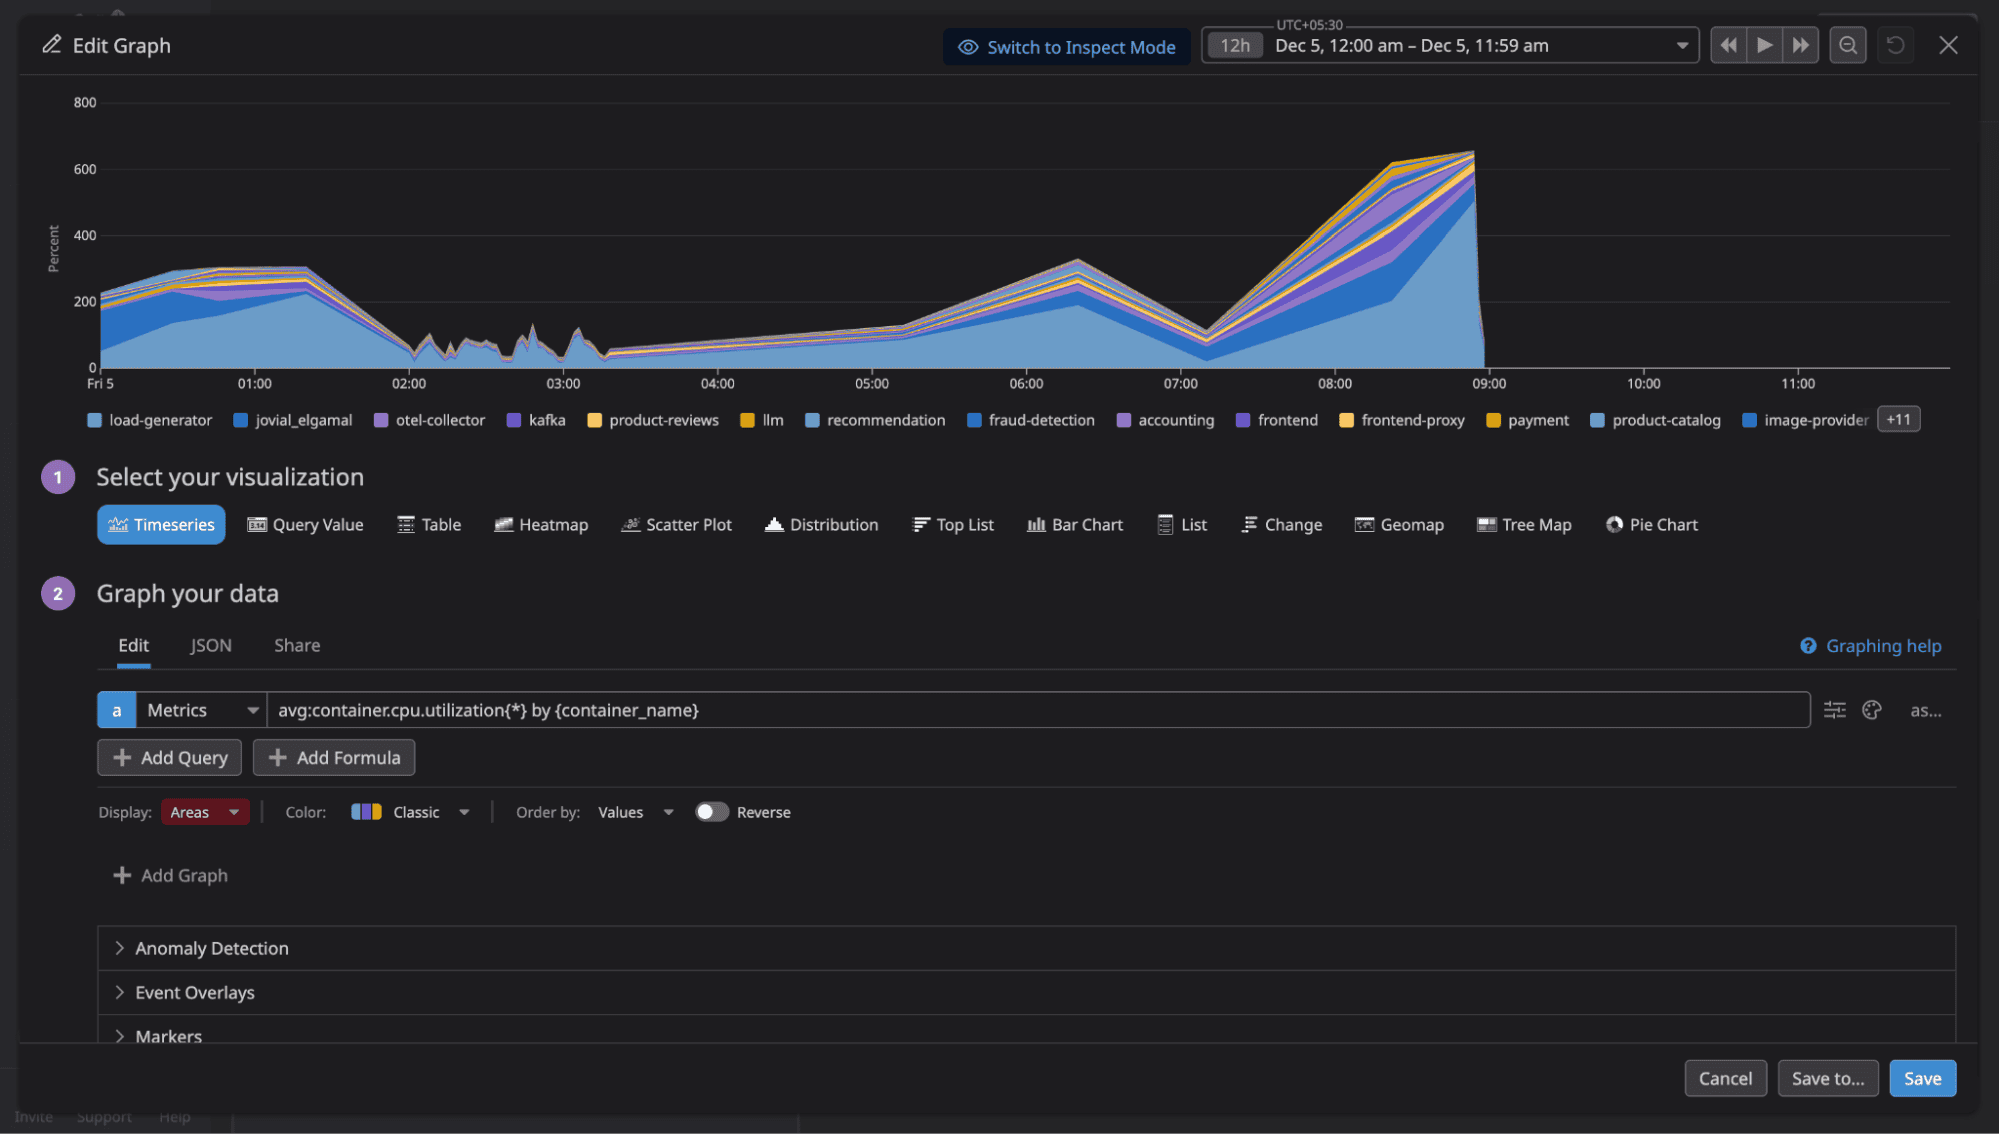
OpenObserve provides two modes for dashboard creation:
Builder (auto mode): Intuitive UI controls for basic visualizations. Add axis, filters, variables, and aggregations through dropdown menus. Drag-and-drop simplicity for standard monitoring scenarios.
Custom mode: Write SQL or PromQL queries for complex analysis. Full query language power when you need joins, subqueries, window functions, or advanced aggregations.
You can switch between modes for the same panel. Start with Builder for quick setup, switch to Custom when you need query complexity.
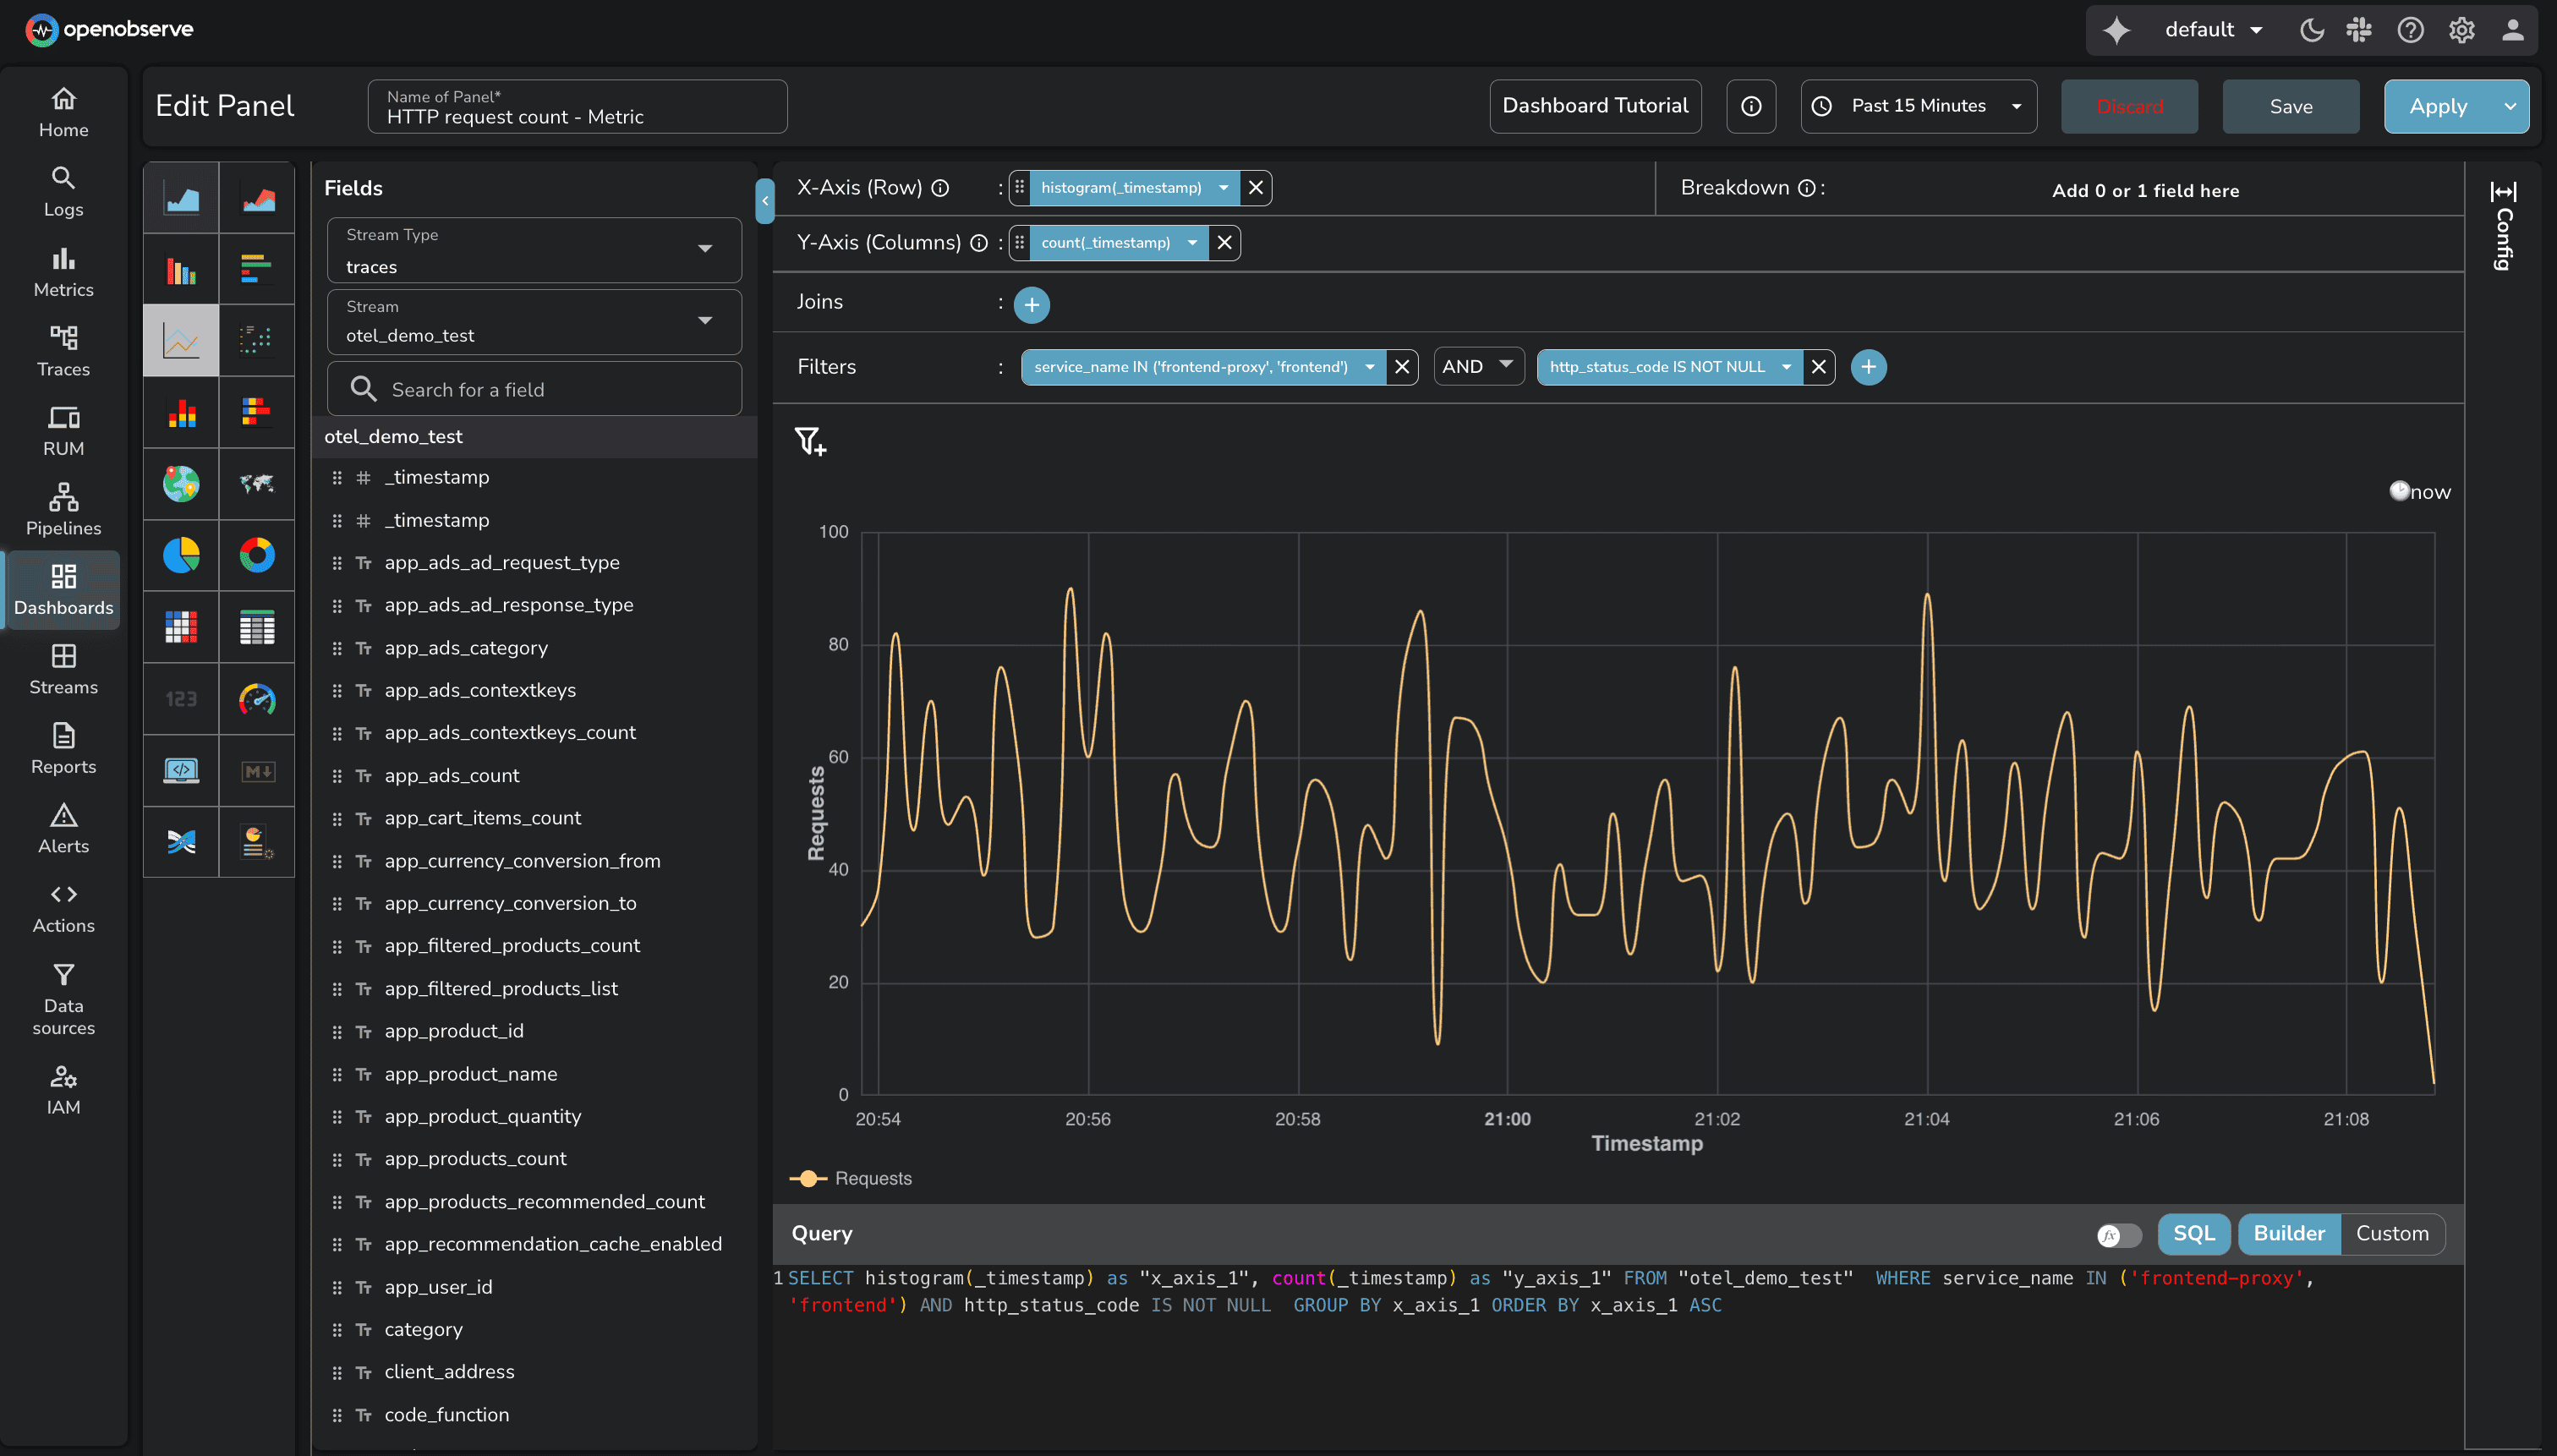
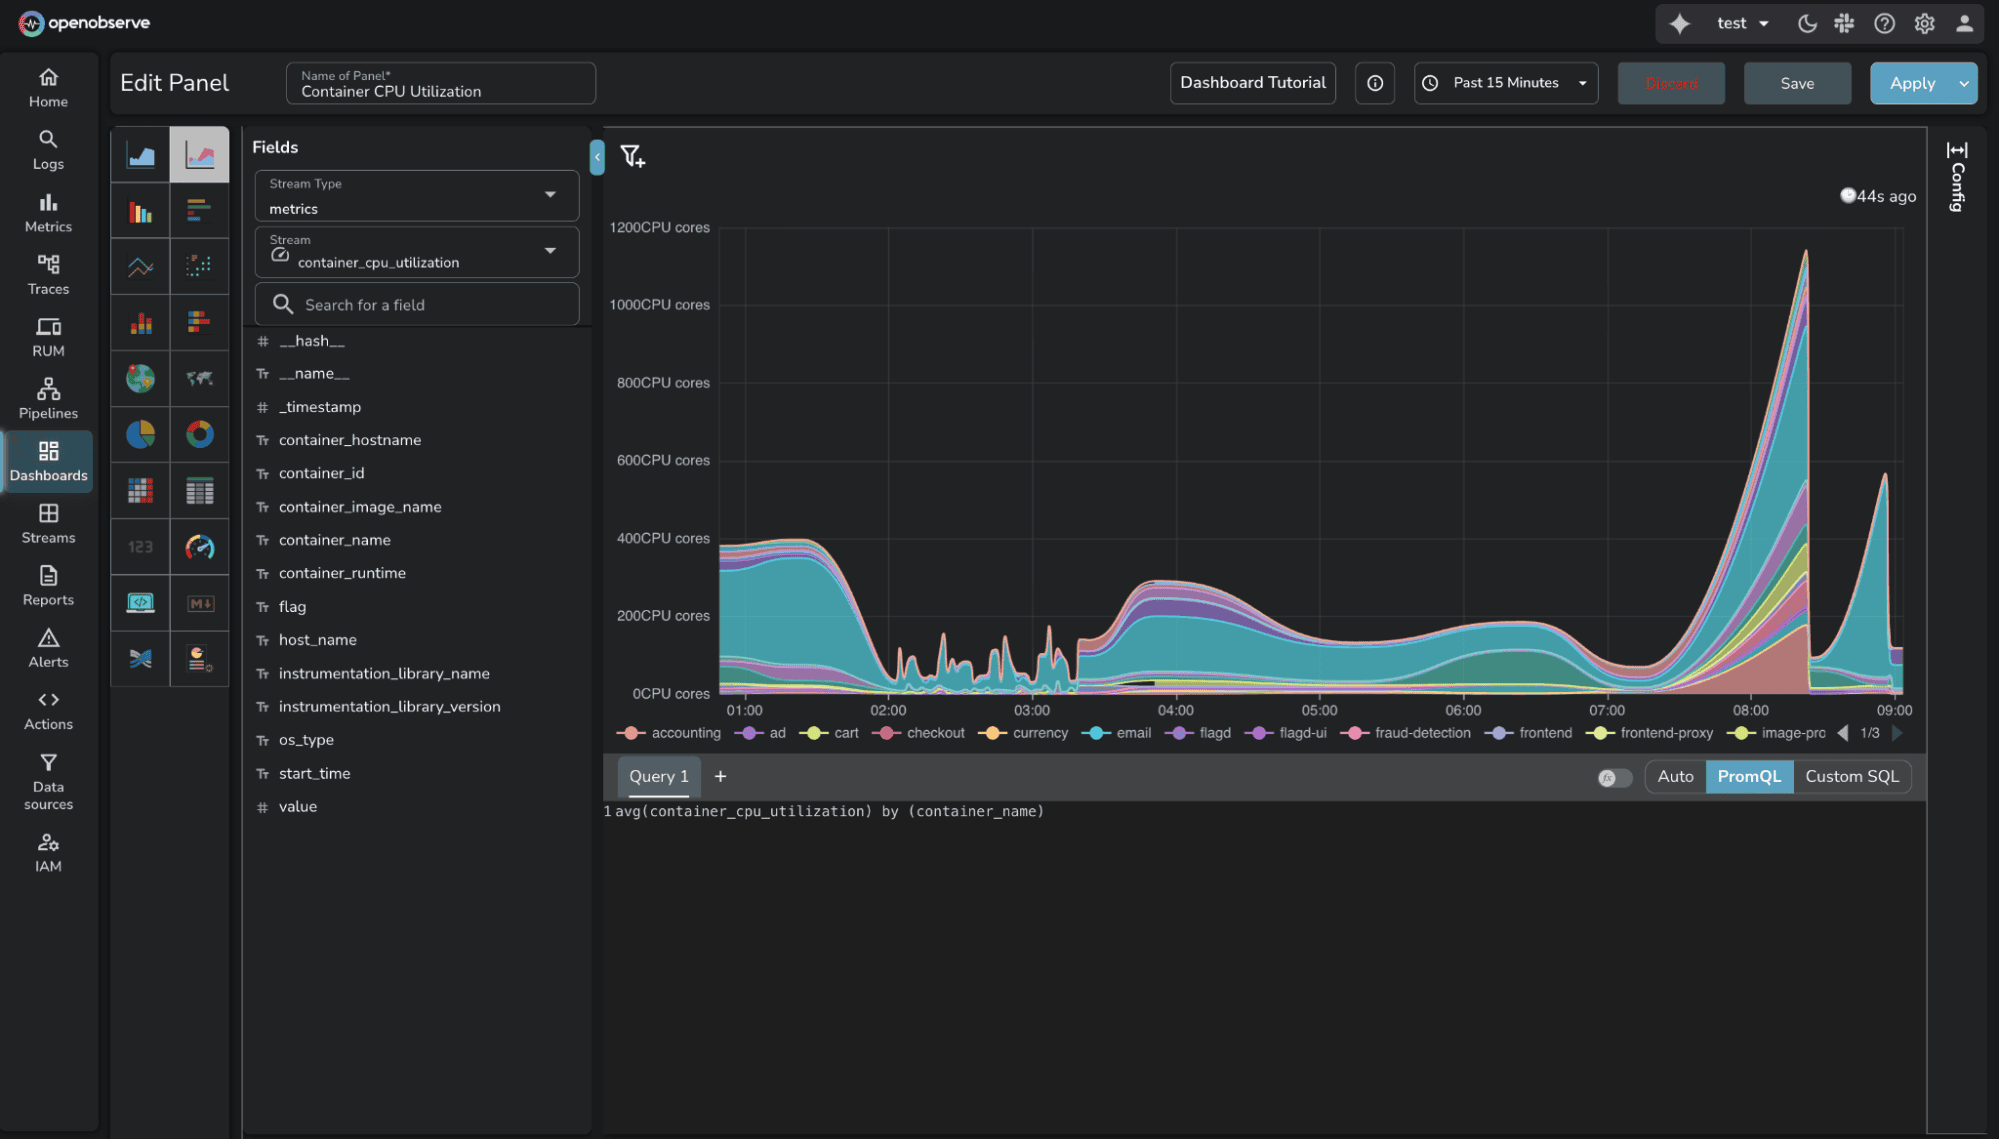
The key difference: OpenObserve supports SQL and PromQL (industry standards) for custom queries, while DataDog requires learning proprietary syntax. For teams already using Prometheus or familiar with SQL, OpenObserve removes the query language learning curve.
Both platforms deliver what teams need for operational visibility. The difference is query flexibility and cost structure.
Custom Charts: Advanced Visualizations
Available in Enterprise Edition and OpenObserve Cloud.
Standard chart types (timeseries, bar charts, pie charts) cover most monitoring scenarios. But specialized use cases require custom visualizations: network topology maps, sankey diagrams, gauge clusters, heatmap calendars, or domain-specific visual representations.
OpenObserve Custom Charts let you create visualizations by using SQL to query the data and JavaScript to define how the chart appears. Custom Charts are powered by Apache ECharts, giving you access to 100+ chart examples and the full ECharts API.
The workflow is straightforward:
- Write SQL query to fetch and transform data
- Use JavaScript to map query results to ECharts configuration
- Preview and iterate
DataDog provides two approaches for custom visualizations:
- UI Extensions: Extend DataDog with custom widgets using React and TypeScript. Requires development environment setup (local dev server, build process). Custom widgets appear at bottom of sidebar after deployment.
Source: DataDog UI Extensions
- Wildcard Widget: Code-defined visualizations using Vega-Lite grammar. Declarative language for building graphics, but limited to Vega-Lite capabilities.
Source: DataDog Wildcard Widget
The comparison:
- OpenObserve: SQL + JavaScript + ECharts (direct access to 100+ chart examples)
- DataDog: UI Extensions (React/TypeScript development overhead) OR Wildcard (Vega-Lite only, narrower scope)
For teams needing custom visualizations without complex development workflows, OpenObserve's approach is more direct.
Community Dashboards Library
Pre-built dashboards accelerate initial setup. Instead of building monitoring from scratch, start with proven templates for common use cases.
OpenObserve Community Dashboards, the library is community-driven: users contribute dashboards for common infrastructure and application scenarios.
The library covers:
- Container orchestration: Kubernetes, Docker
- Databases: PostgreSQL, MySQL, MongoDB
- Infrastructure: Host metrics, AWS services, Azure, GCP
- Applications: NGINX, Jenkins, Snowflake
- Specialized observability: LLM observability (OpenLIT integration)
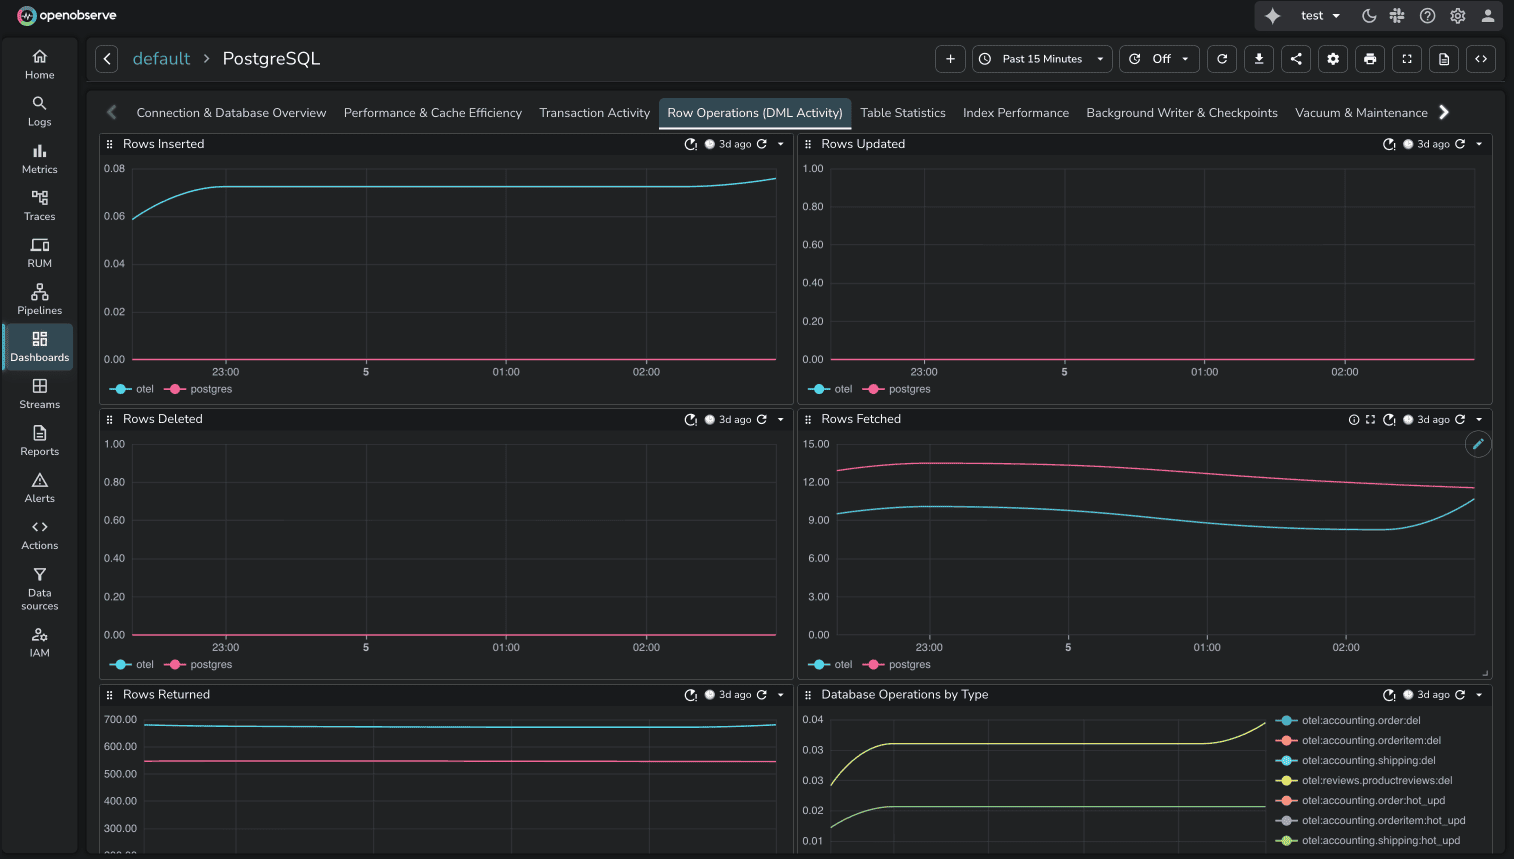
The community model means dashboards reflect real production use cases. Anyone can contribute dashboards for tools they monitor.
DataDog provides integration dashboards tied to specific integrations. When you install an integration (PostgreSQL, Kubernetes, etc.), DataDog includes out-of-the-box dashboards automatically. For example, the PostgreSQL integration includes "Postgres - Metrics" and "Postgres - Overview" dashboards.
The comparison:
- DataDog: Vendor-provided integration dashboards, tied to paid integrations
- OpenObserve: Community-driven GitHub library, open contribution model
Both approaches deliver pre-built dashboards. DataDog's are vendor-controlled. OpenObserve's are community-maintained and freely accessible.
Variables & Dynamic Dashboards
Static dashboards show fixed data. Dynamic dashboards adapt to user selections through variables: filters that adjust what data is displayed without editing queries.
Variables
OpenObserve Variables enable interactive filtering. Define variables like $service, $region, or $environment, and users select values through dropdowns. All panels using those variables update automatically.
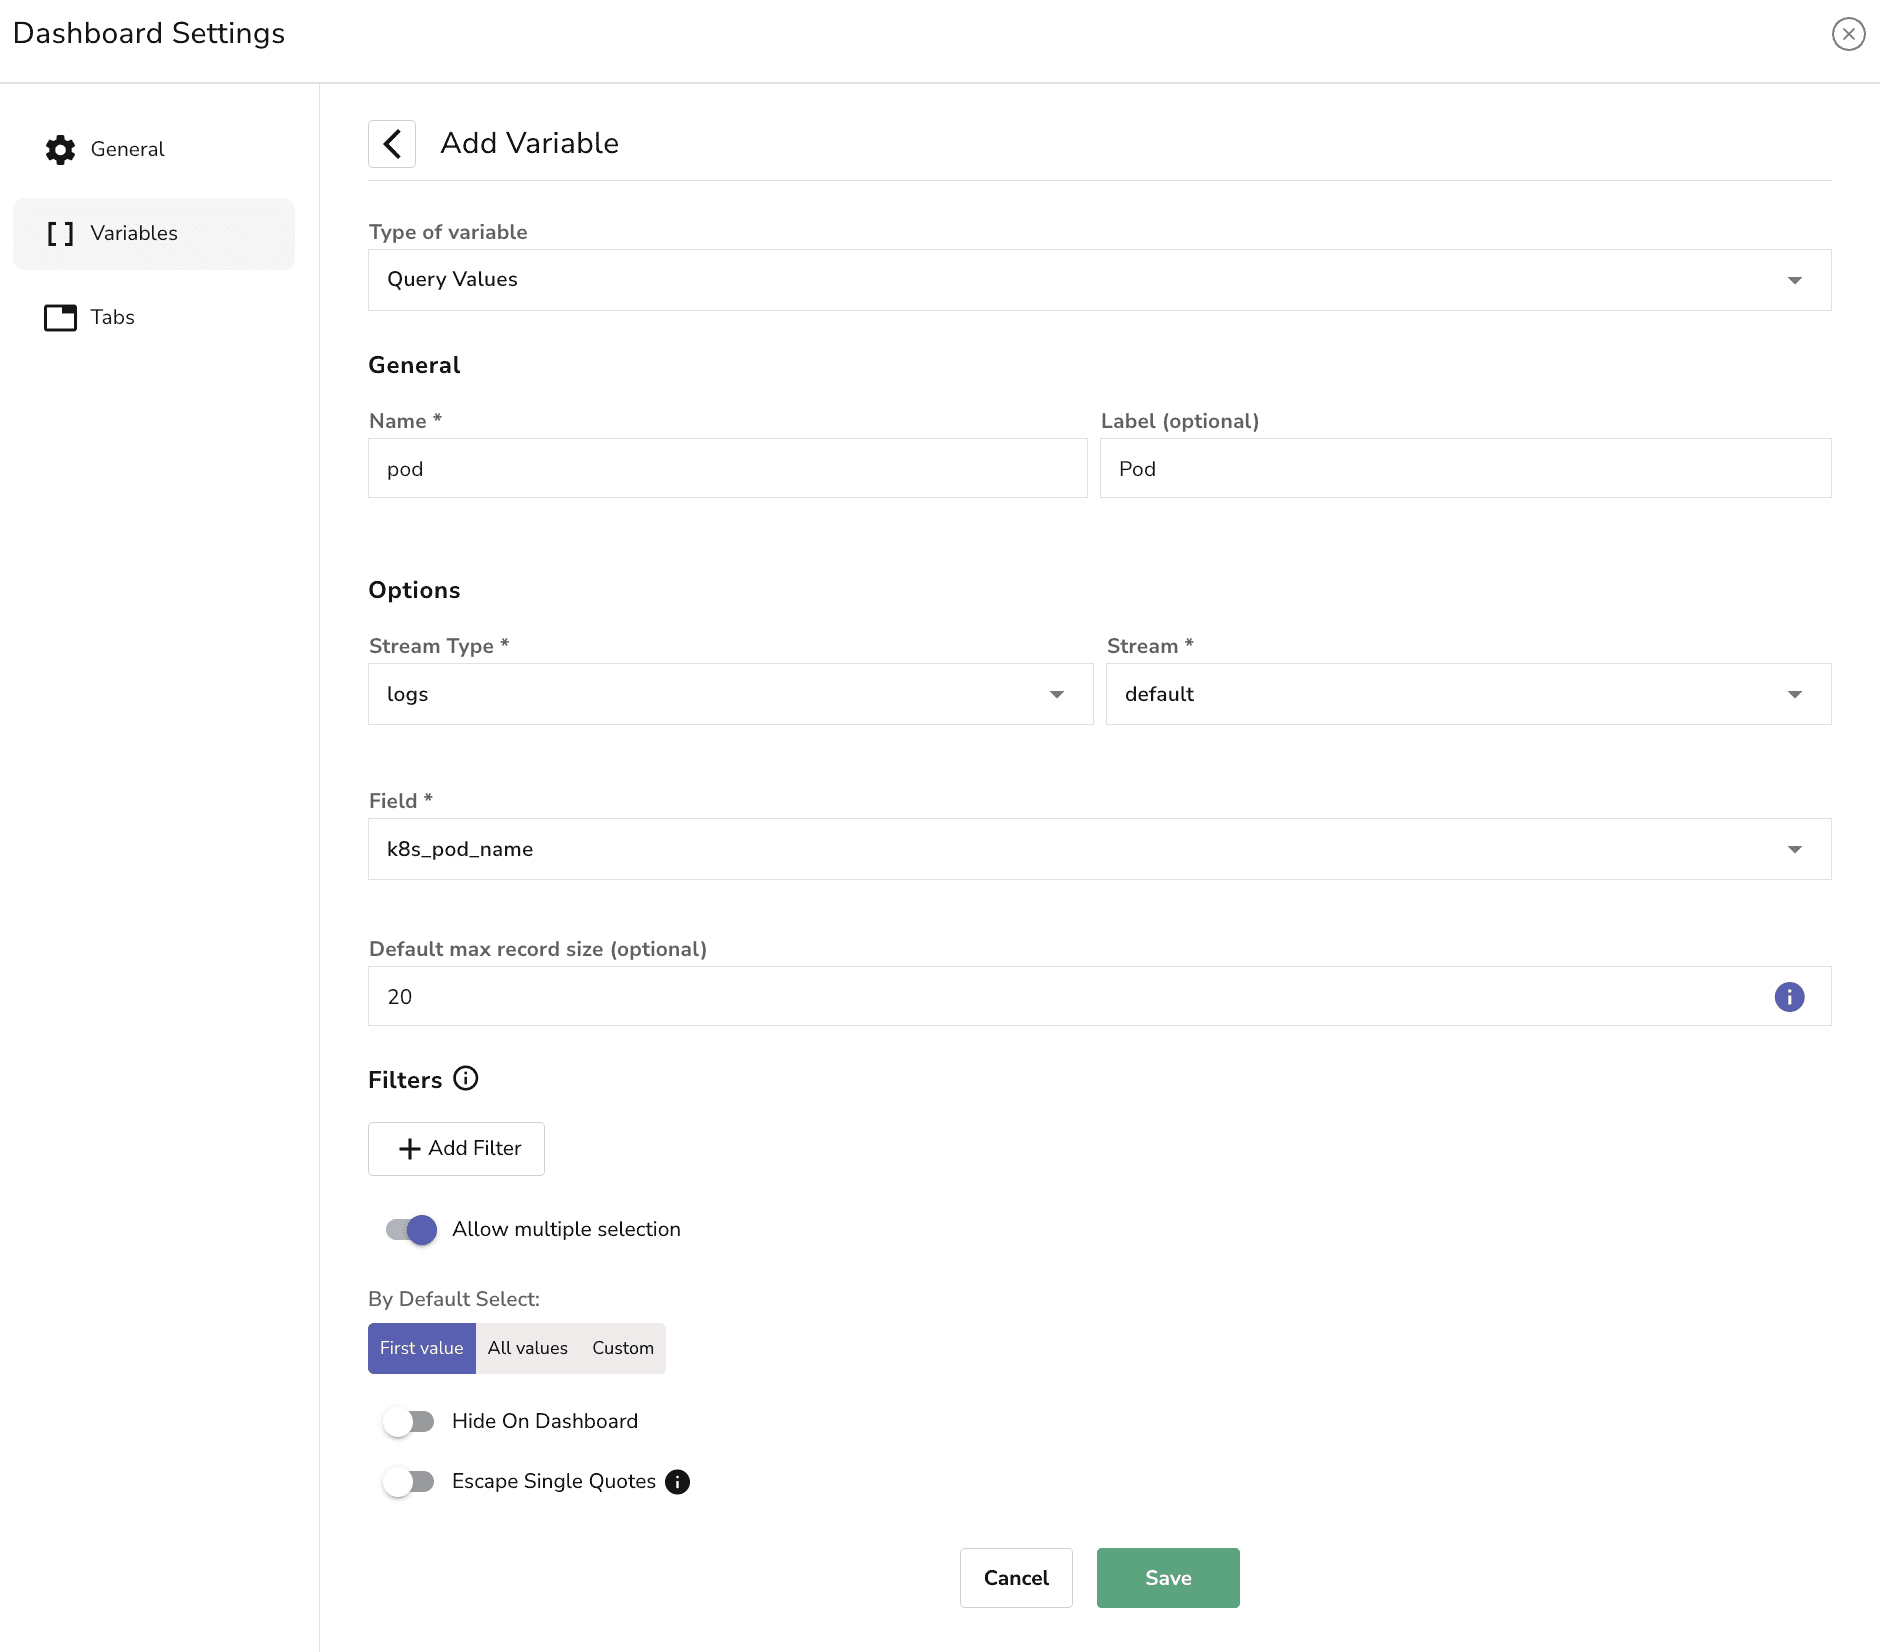
Use variables to:
- Filter data without editing queries
- Pass the same selected value into multiple panel queries
- Switch between values (production vs staging environments)
- Support multi-value selections
DataDog Template Variables provide the same functionality. Select values through dropdowns to filter data across dashboard widgets without manually editing queries.
Source: DataDog Template Variables
Feature parity. Both platforms handle interactive dashboard filtering effectively.
Variable Dependencies
OpenObserve Variable Dependencies allow parent-child relationships between variables. When a user selects a value for the parent variable, the child variable updates to show only relevant options associated with that selection.
This is useful for hierarchical data: Kubernetes resources (namespace → deployment → pod) or application modules (region → cluster → service).
DataDog Associated Template Variables provide automatic cascading. DataDog automatically finds associated values for other template variables as you make selections. When you select a namespace, the deployment dropdown shows only deployments in that namespace. No additional setup required.
Source: DataDog Associated Template Variables
Feature parity. DataDog's approach is automatic. OpenObserve's allows explicit parent-child modeling.
Comparison Against (Time-shift)
OpenObserve Comparison Against allows you to visually compare current data with data from a selected point in time in the past. Useful for trend analysis and identifying patterns over time.
Example: Compare error trends for the last 15 minutes today with error trends for the same time period 2 days ago.
DataDog timeshift function enables temporal data comparison. Overlay current metrics against historical data from previous time periods. Accessible through the dashboard query builder when configuring widgets.
Source: DataDog Timeshift Function
Feature parity. Both platforms support time-shift comparison for trend analysis.
LLM Observability Dashboards: Standard vs Premium
Modern applications integrate AI features: product recommendations, chat interfaces, content generation. These make API calls to LLM providers (OpenAI, Anthropic, Cohere, or self-hosted). Observability platforms need dashboards showing LLM performance: token usage, latency, error rates, costs per request.
In DataDog, LLM traces automatically activate LLM Observability, a premium feature. The cost: $120 per day. This activation happens automatically when DataDog detects LLM span attributes.
Source: See Part 3: Traces/APM for detailed LLM observability comparison
In OpenObserve, LLM traces are standard traces. No special classification. No premium pricing. The flat $0.30/GB rate applies to all observability data.
OpenObserve proivde pre-built LLM observability dashboards through OpenLIT integration. The OpenLIT LLM Observability dashboard visualizes token usage, latency distributions, model performance, and cost tracking across LLM providers.
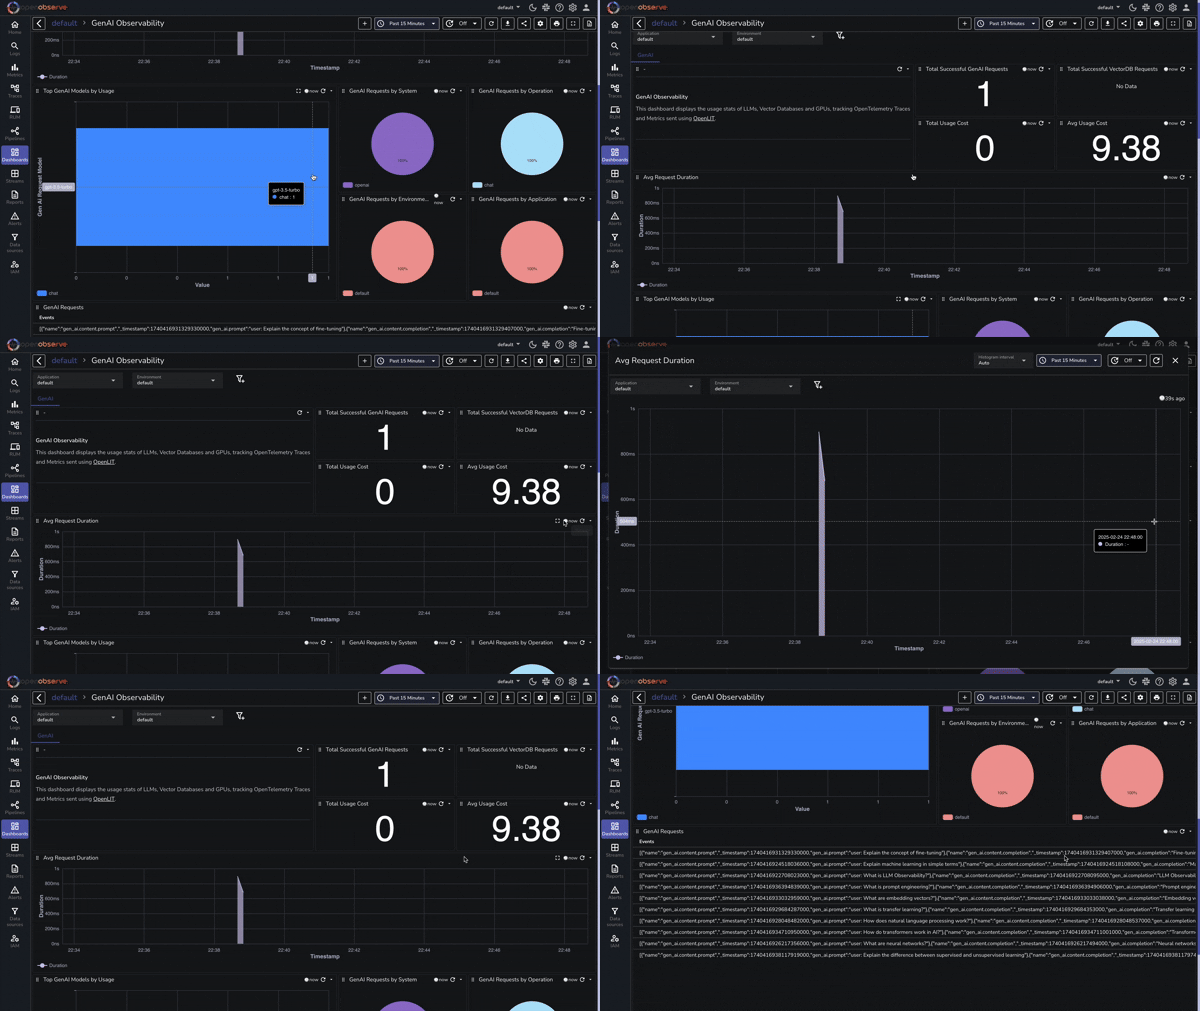
Adding AI features to your application doesn't add $3,600/month in observability costs with OpenObserve. It adds data volume at the same $0.30/GB rate.
Quick Comparison
| Capability | DataDog | OpenObserve |
|---|---|---|
| Dashboard Creation | Drag-drop widgets with proprietary query syntax | Builder (auto) + Custom mode (SQL/PromQL) |
| Custom Visualizations | UI Extensions (React/TypeScript dev) OR Wildcard (Vega-Lite) | Custom Charts: SQL + JavaScript + ECharts (Enterprise) |
| Pre-built Dashboards | Vendor-provided integration dashboards | Community-driven GitHub library |
| Variables | Template Variables | Variables (interactive filtering) |
| Variable Dependencies | Associated Values (automatic cascading) | Variable Dependencies (explicit parent-child) |
| Time-shift Comparison | timeshift() function | Comparison Against |
| LLM Observability | $120/day premium tier (auto-activated) | Standard pricing ($0.30/GB flat) |
| Query Language | Proprietary syntax | SQL + PromQL (industry standards) |
| Total Test Cost | $174/day (all observability: LLM $120 + APM $36 + Infrastructure $18) | $3.00/day (all observability) |
Cost Breakdown: DataDog vs OpenObserve for Dashboards
Dashboards themselves don't have per-dashboard pricing in either platform. The cost difference comes from the underlying data: DataDog's multi-dimensional pricing (per-host charges, indexed spans, premium feature tiers) versus OpenObserve's flat $0.30/GB for all observability data.
In the test environment running the 16-service OpenTelemetry demo application with Kafka, PostgreSQL, Valkey, and LLM services:
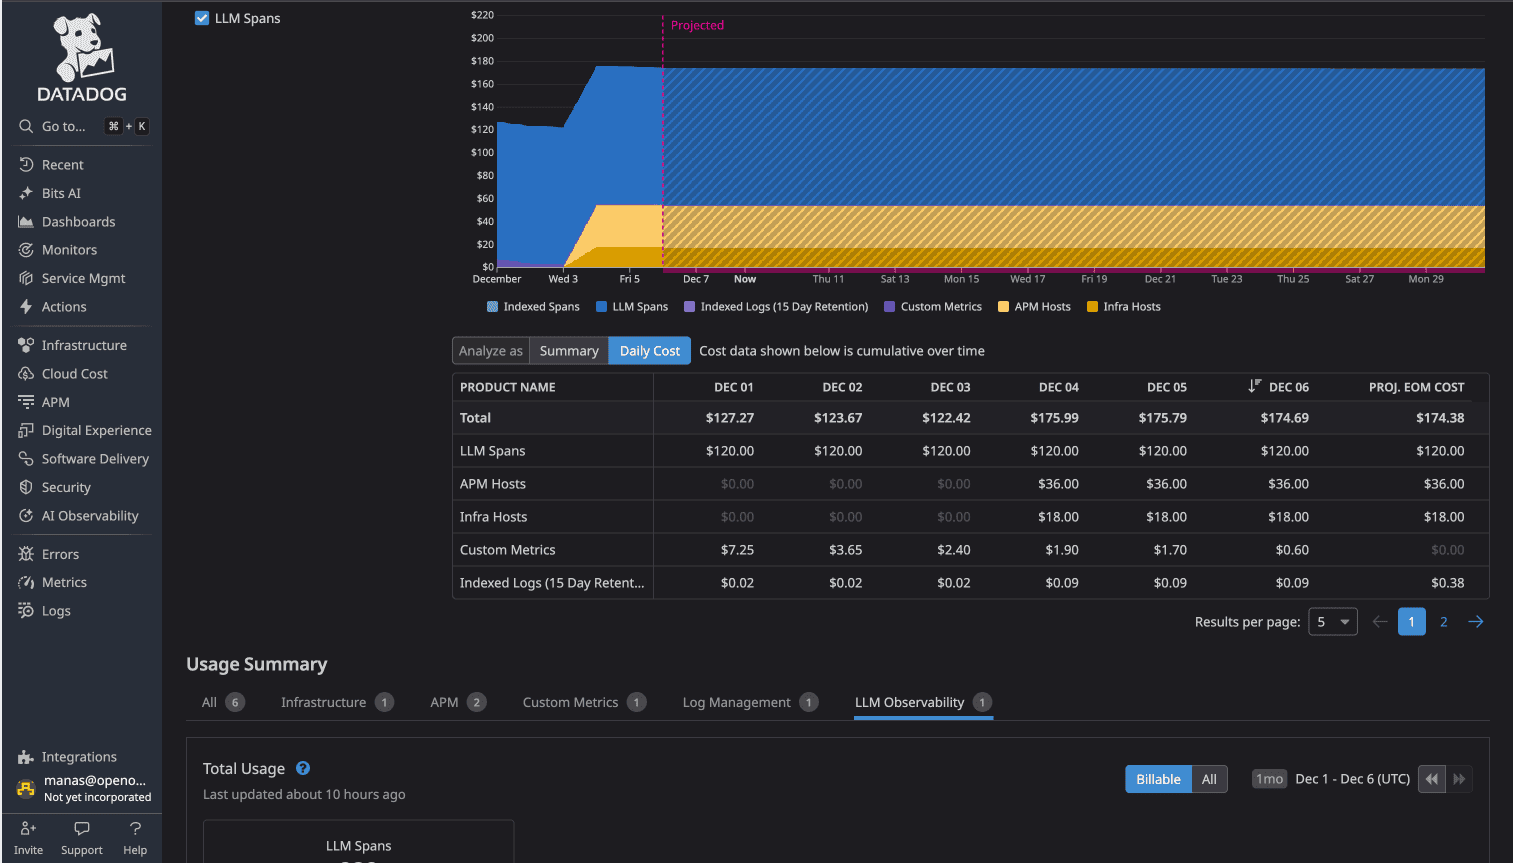
DataDog Total: $174/day
- LLM Observability: $120/day
- APM Hosts: $36/day
- Infrastructure Hosts: $18/day
OpenObserve Total: $3.00/day
- Flat ingestion pricing across logs, metrics, and traces
- No per-host charges
- No premium feature tiers
The cost difference: 58x (more than 98% cost savings)
The same dashboards visualizing the same data cost 58 times more to operate in DataDog due to the underlying pricing model.
OpenObserve's OpenTelemetry-native architecture means you instrument once with industry-standard OTel SDKs, export to OpenObserve, and build dashboards without vendor lock-in. No proprietary agents. No feature-based pricing tiers. No automatic premium charges when you add AI features.
The Bottom Line
DataDog provides polished dashboard capabilities with extensive integrations. If you're already invested in the DataDog ecosystem and cost isn't a primary concern, the dashboards work.
But if you're evaluating observability platforms or open-source DataDog alternatives for dashboards, OpenObserve delivers the same core visualization capabilities with significant advantages:
- SQL and PromQL queries instead of proprietary syntax: your team already knows these languages
- Custom Charts with ECharts: simpler approach to advanced visualizations compared to DataDog's UI Extensions or Vega-Lite
- Community Dashboards: open GitHub library with real production use cases
- OpenTelemetry native: full OTel compatibility without proprietary agents
- Up to 98% cost savings for the same observability visibility
For platform engineers managing OpenTelemetry-instrumented microservices, these differences matter. No cost anxiety about adding AI features. More query flexibility with SQL and PromQL. Transparent pricing that scales predictably.
This is Part 4 in a series comparing DataDog and OpenObserve for observability (security use cases excluded):
- Full comparison
- Part 1: Logs - Automatic Field Discovery, SQL Queries, and 90% Cost Savings
- Part 2: Metrics - Drag & Drop, SQL, PromQL, High Cardinality
- Part 3: Traces/APM - OTel Native, No Hidden Tiers
- Part 4: Dashboards - Prebuilt, Drag & Drop, Custom
- Part 5: Alerts, Monitors, Destinations
- Part 6: Real User Monitoring
- Part 7: Pipelines
- Part 8: IAM SSO, RBAC
- Part 9: Cost
Sign up for a free cloud trial or schedule a demo to test OpenObserve dashboards with your observability data.
About the Author
Manas Sharma


Manas is a passionate Dev and Cloud Advocate with a strong focus on cloud-native technologies, including observability, cloud, kubernetes, and opensource. building bridges between tech and community.