DataDog vs OpenObserve Part 2: Metrics Comparison




Ready to get started?
Try OpenObserve Cloud today for more efficient and performant observability.
DataDog vs OpenObserve Part 2: Metrics - PromQL, High Cardinality, Up to 90% Cost Savings
DataDog charges per custom metric, per time series, per host. OpenObserve flips this model: predictable costs, PromQL and SQL instead of proprietary syntax, no cardinality penalties. Same metrics monitoring capabilities and up to 90% lower costs.
Beyond pricing, query language compatibility matters. PromQL support, percentile availability, and high-cardinality handling directly impact how teams instrument applications and analyze performance.
This hands-on comparison tests DataDog and OpenObserve as metrics monitoring platforms, sending identical production-like metrics data to both platforms simultaneously. The results show how these platforms handle custom metrics classification, query languages, percentile aggregations, and cost structure with the same production-like data.
Evereve, a fashion retail company, achieved 90% cost savings migrating from DataDog to OpenObserve for their full observability stack. They didn't sacrifice visibility but instead eliminated pricing complexity. Full instrumentation with high-cardinality labels, PromQL queries, and accurate cost forecasting became possible.
This is Part 2 in a series comparing DataDog and OpenObserve for observability (security use cases excluded):
- Full comparison
- Part 1: Logs - Automatic Field Discovery, SQL Queries, and 90% Cost Savings
- Part 2: Metrics- Drag & Drop, SQL, PromQL, High Cardinality
- Part 3: Traces/APM - OTel Native, No Hidden Tiers
- Part 4: Dashboards- Prebuilt, Drag & Drop, Custom
- Part 5: Alerts, Monitors, Destinations
- Part 6: Real User Monitoring
- Part 7: Pipelines
- Part 8: IAM (SSO, RBAC)
- Part 9: Cost
TL;DR - 8 Key Findings
- Custom Metrics Auto-Generation: DataDog auto-generated 112 "custom metrics" from standard OTel instrumentation, billing separately. OpenObserve makes no distinction: all metrics priced equally.
- Query Languages: DataDog uses proprietary syntax. OpenObserve supports PromQL (Prometheus-compatible) and SQL for advanced analytics.
- High Cardinality: DataDog charges per unique time series, penalizing high-cardinality labels. OpenObserve uses flat $0.30/GB pricing regardless of cardinality.
- Percentile Aggregations: DataDog requires enabling percentiles per metric before querying. OpenObserve supports all PromQL aggregations (P50, P75, P95, P99) by default.
- Dashboard Building: DataDog offers drag-and-drop. OpenObserve provides drag-and-drop, PromQL queries, and SQL for complex analytics.
- Downsampling: DataDog supports manual rollups. OpenObserve Enterprise includes automatic downsampling for long-term storage optimization.
- Migration: DogStatsD metrics can route through OpenTelemetry Collector to OpenObserve, preserving existing DataDog Agent instrumentation.
- Cost Reality: Teams are reducing their total cost of observability by 60-90% moving from DataDog to OpenObserve without sacrificing visibility.
What We Tested
The test used the OpenTelemetry Astronomy Shop demo: a 16-service microservices application with Kafka, PostgreSQL, Valkey cache, and an LLM service.
Metrics collected: Host metrics (CPU, memory, disk), container stats, database metrics (PostgreSQL), cache metrics (Valkey), HTTP/RPC request durations, and custom application metrics from OTel instrumentation.
All services used OpenTelemetry SDKs sending metrics to the OTel Collector, which exported to both DataDog and OpenObserve simultaneously.
Custom Metrics: The Auto-Generation Surprise
DataDog classified 112 metrics as "custom" from the application. Custom metrics in DataDog are billed separately from standard infrastructure metrics.
The surprise: these weren't explicitly created. They auto-generated from OpenTelemetry's standard instrumentation:
traces.span.metrics.duration- 503 time series/hourrpc.server.duration- 40 time series/hourrpc.client.duration- 30 time series/hourhttp.server.request.duration- 26 time series/hour
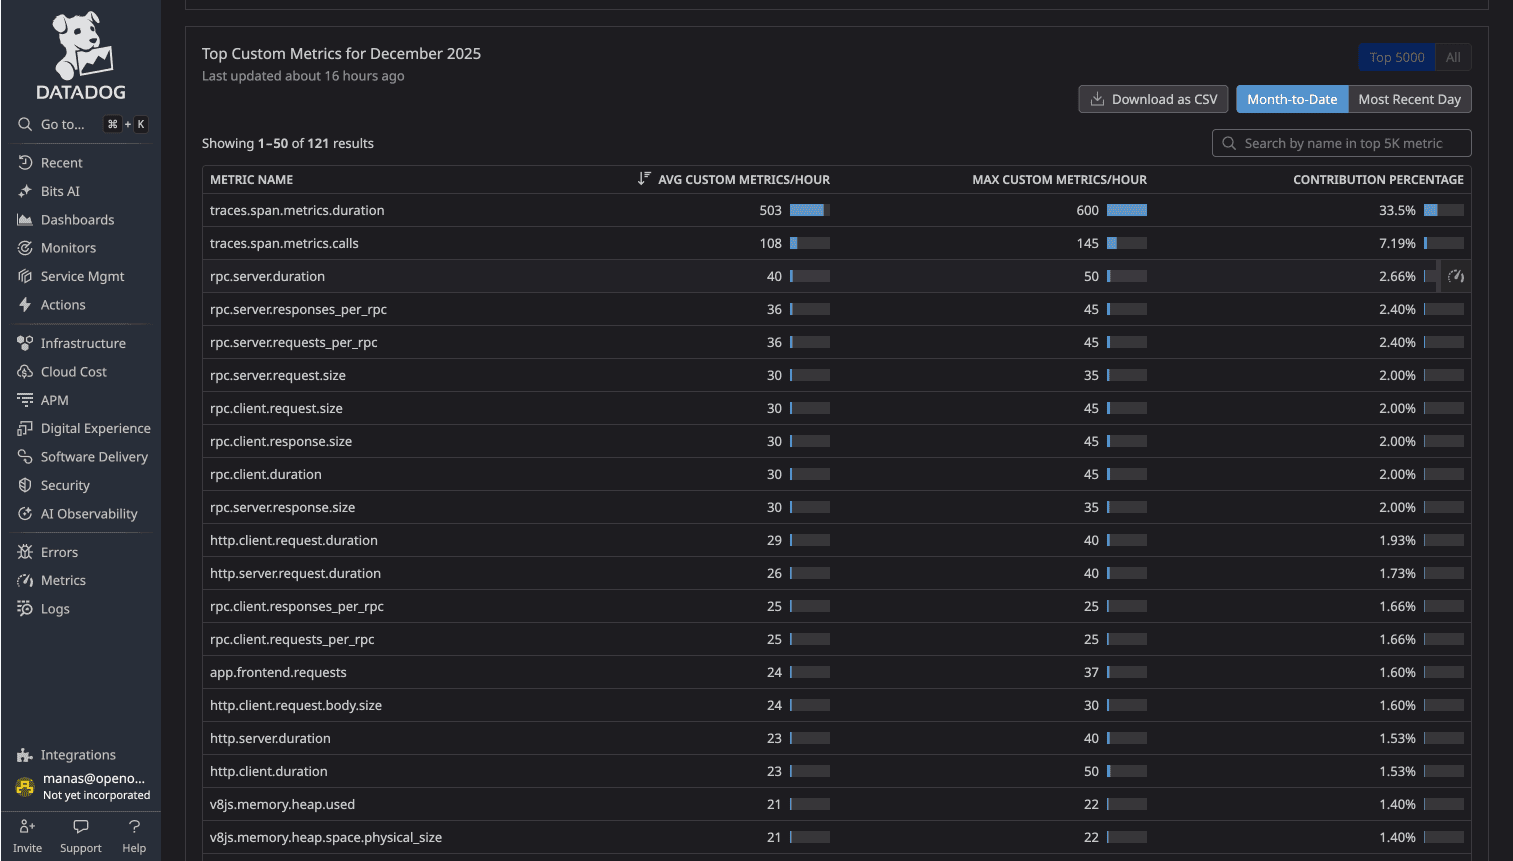
These are standard OTel semantic conventions: normal RPC calls, HTTP requests, span durations. But in DataDog's pricing model, they're "custom" and billed accordingly.
OpenObserve makes no distinction between custom and standard metrics. All metrics are priced at $0.30 per GB ingested. Whether from host monitoring, application instrumentation, or custom business logic, pricing is identical.
For teams instrumenting microservices with OpenTelemetry, DataDog's classification creates hesitation. OpenObserve removes that friction.
Query Languages: PromQL vs Proprietary
DataDog uses proprietary metrics query syntax. Example query for average request duration by service:
avg:http.server.request.duration{*} by {service}
OpenObserve supports PromQL (Prometheus Query Language). The same query:
avg(http_server_request_duration) by (service)
For teams migrating from Prometheus or familiar with PromQL, this compatibility eliminates relearning. Existing dashboards, alerts, and queries work without translation.
OpenObserve also supports SQL for complex analytics. Use PromQL for standard queries, SQL when you need analytical power. DataDog's proprietary syntax offers neither.
High Cardinality: The Scaling Cost Challenge
Cardinality is the number of unique time series for a metric. A metric with labels for service, endpoint, method, and status_code creates a time series for every unique combination. Add high-cardinality labels like user_id or request_id, and time series counts explode.
DataDog charges per unique time series. High-cardinality metrics become expensive. Teams avoid high-cardinality labels, losing visibility.
OpenObserve charges $0.30 per GB ingested, regardless of cardinality. A metric with 10 time series and one with 10,000 time series cost the same per GB. No cardinality penalty.
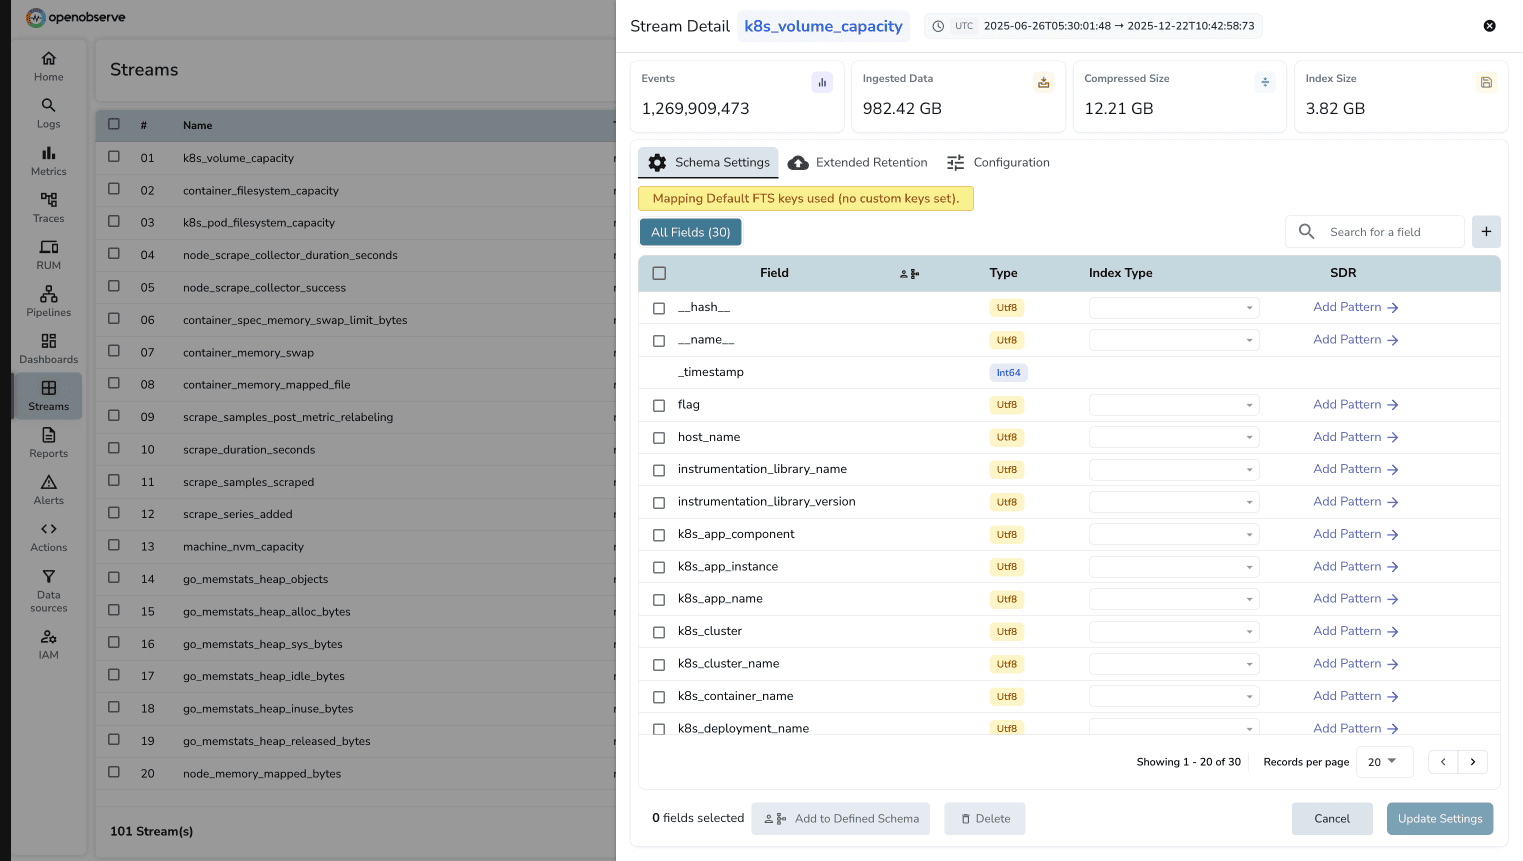
This changes instrumentation decisions. With OpenObserve, instrument with the detail needed without cost-driven compromises.
Dashboard Creation
The test required monitoring dashboards covering standard scenarios: request rates, error rates, latency percentiles, and resource utilization.
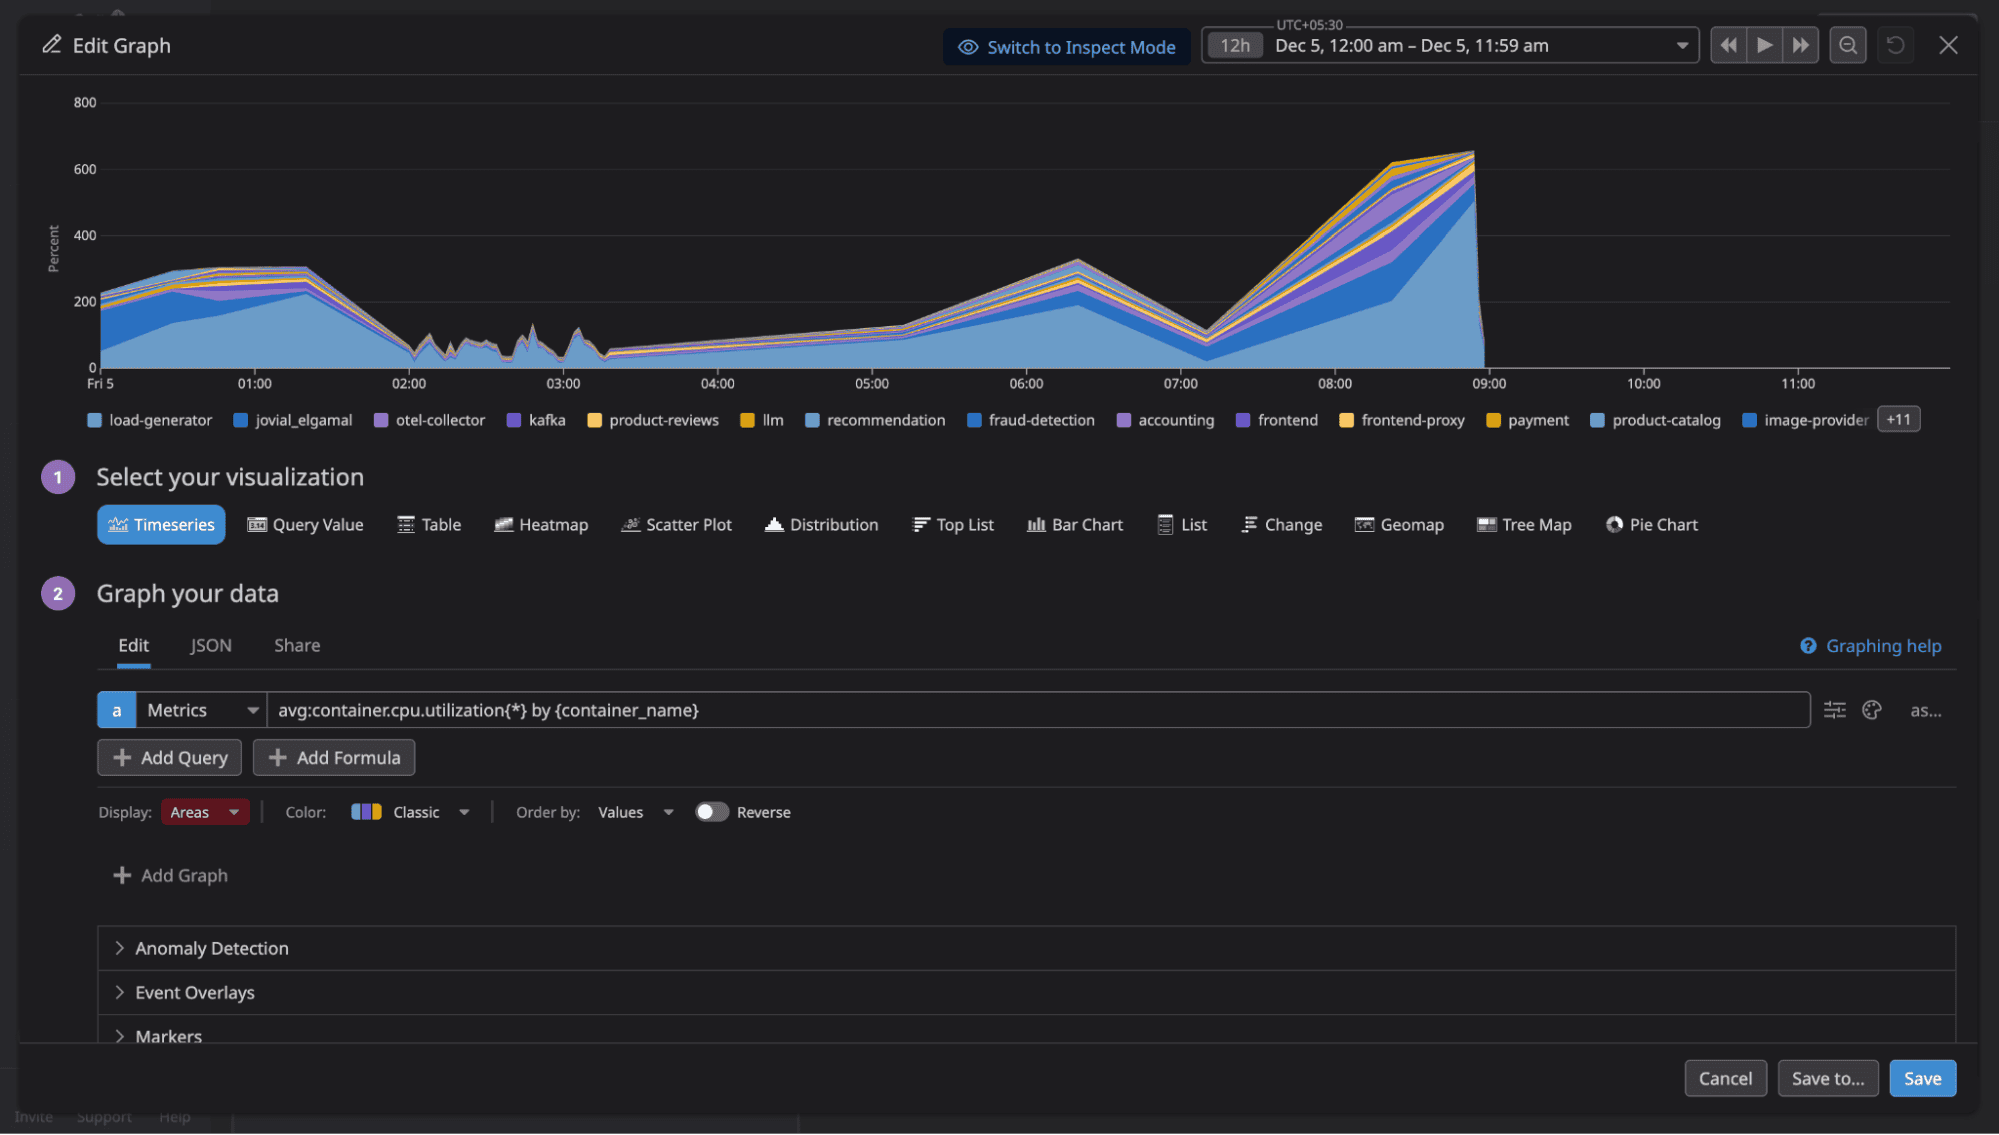
DataDog offers drag-and-drop widgets, extensive visualizations (timeseries, heatmaps, top lists), and pre-built templates. The UI is polished, though proprietary query syntax occasionally requires trial and error for complex aggregations.
OpenObserve provides similar visualization capabilities with an auto mode featuring intuitive UI controls for basic visualizations: adding axis, filters, variables, and aggregations through dropdown menus. For advanced custom visualizations, use PromQL or SQL queries. The dashboard builder is straightforward and functionally complete for production monitoring.
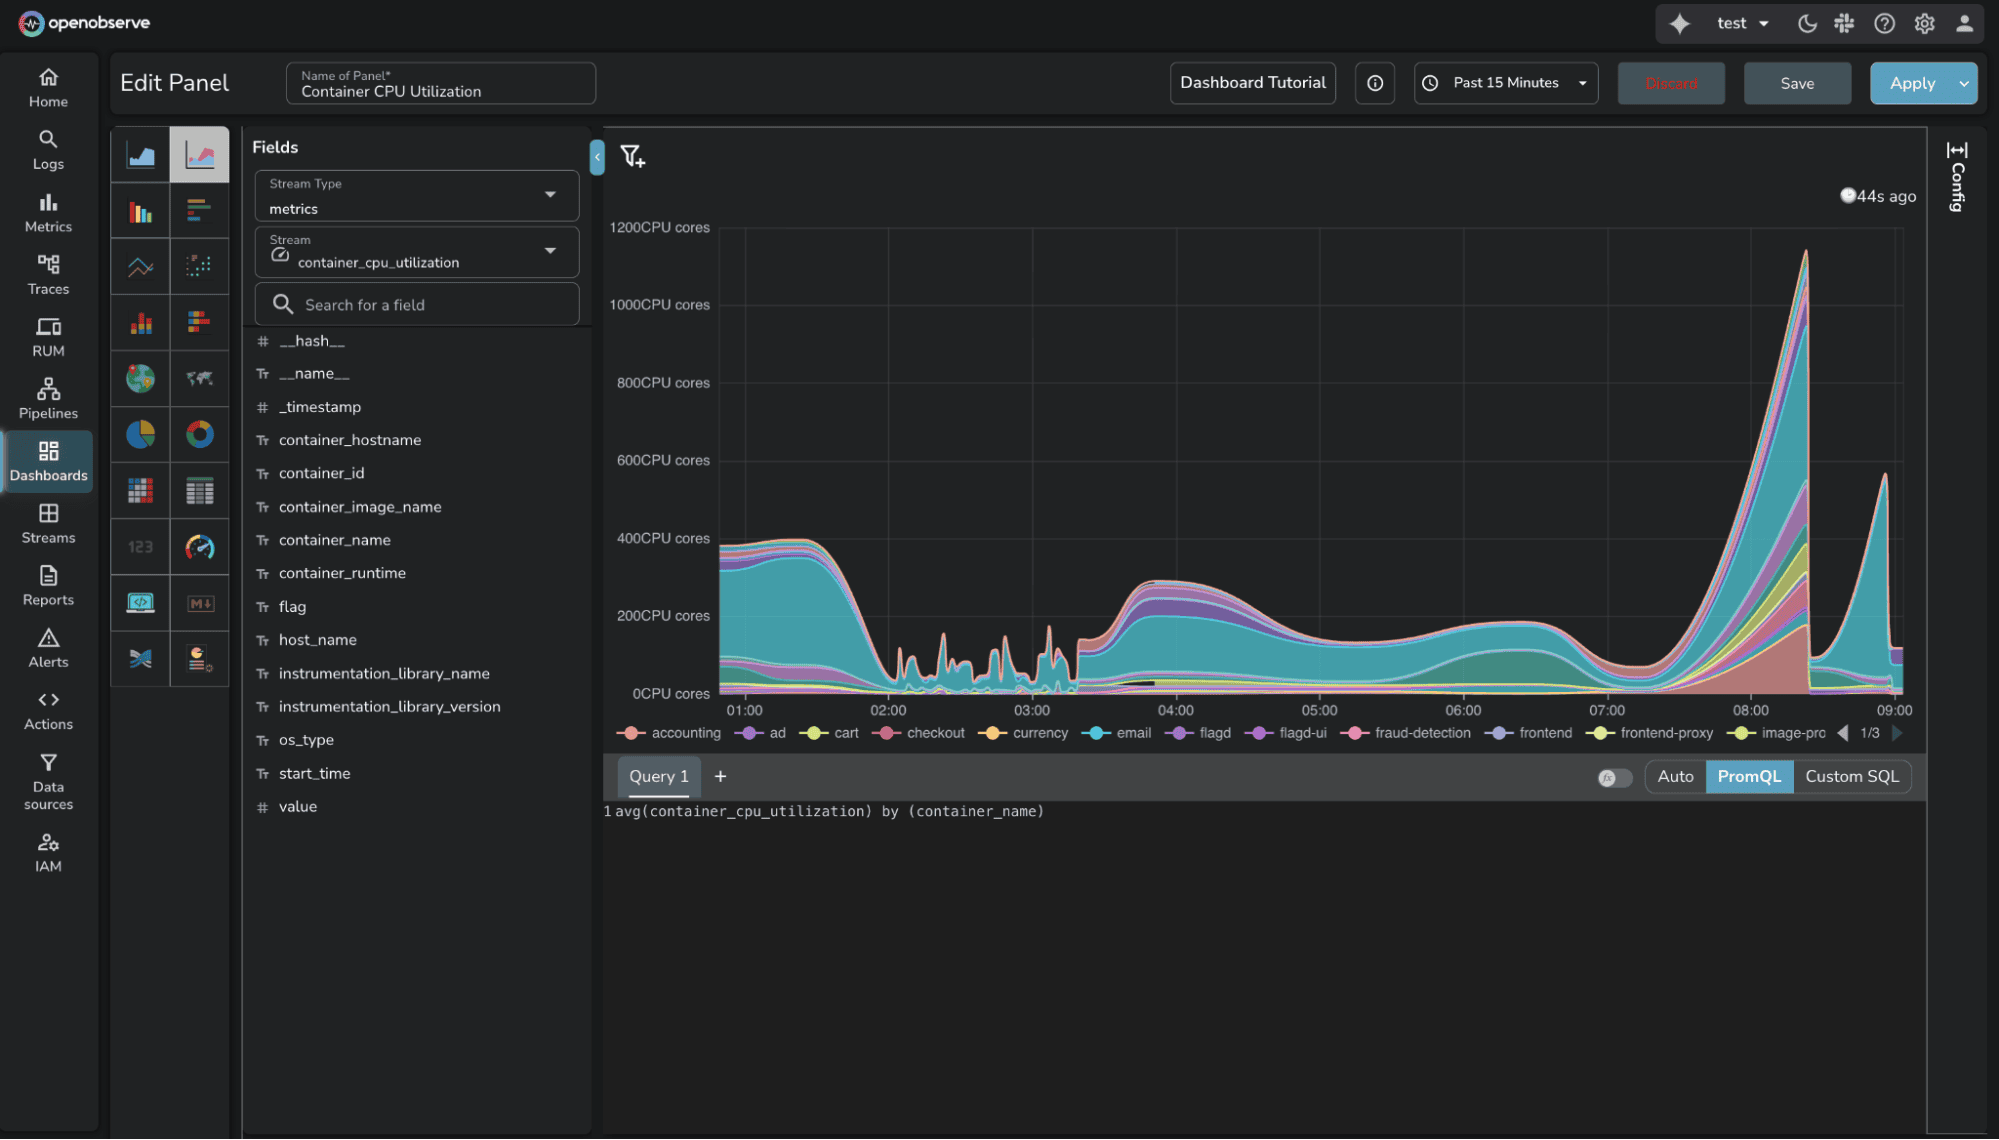
The key difference: OpenObserve supports PromQL and SQL for complex queries, while DataDog requires learning proprietary syntax. For teams already using Prometheus or familiar with SQL, OpenObserve removes the query language learning curve.
Percentiles: Configuration Overhead
Available in OSS and Enterprise Edition.
The test required P95 latency for the frontend service, a standard use case.
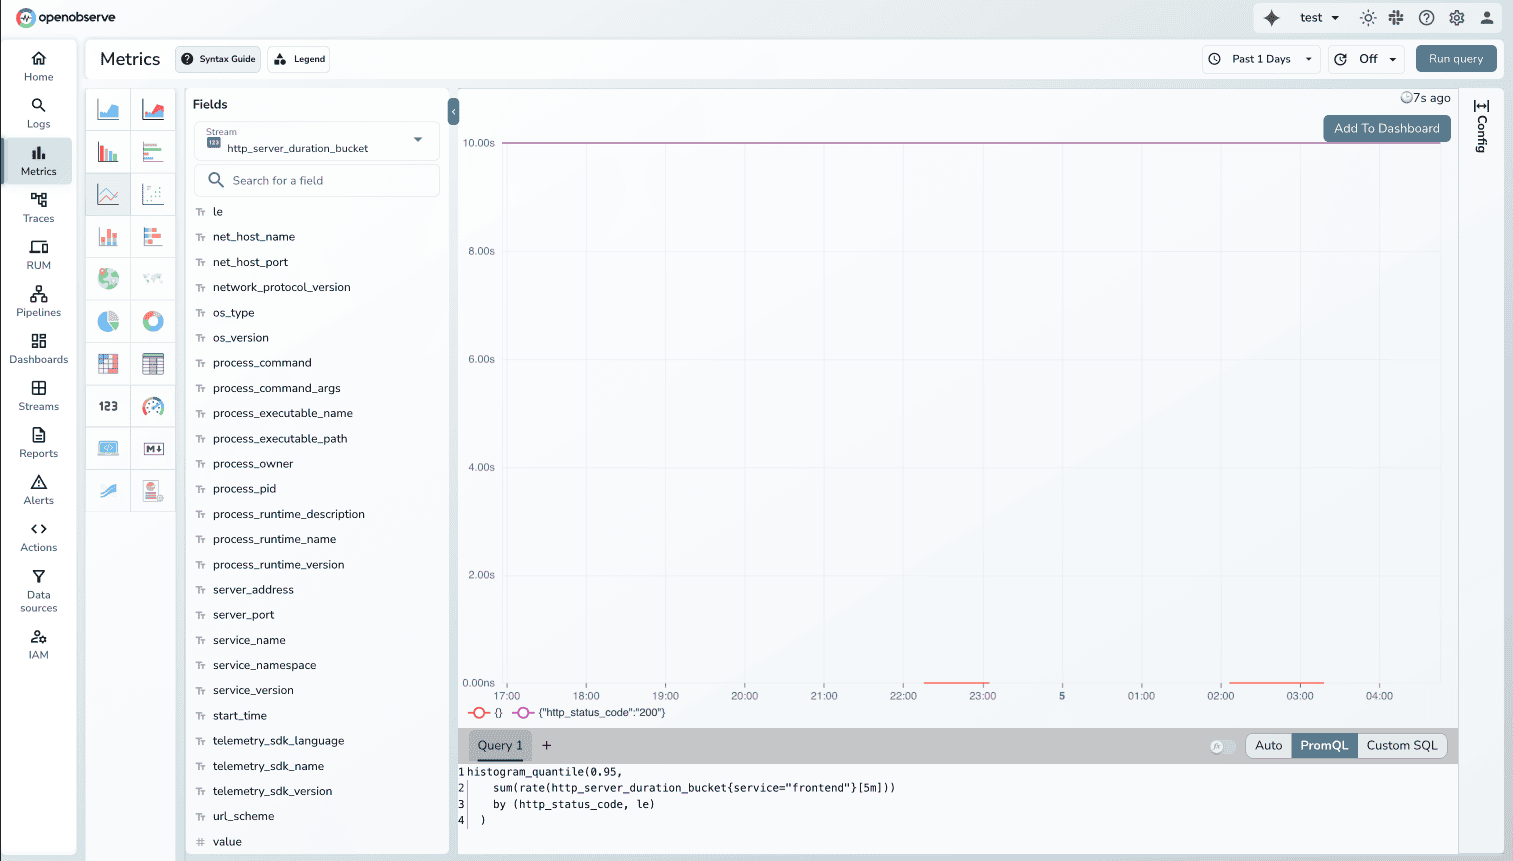
In OpenObserve, the PromQL query works immediately:
histogram_quantile(0.95, http_server_request_duration_bucket{service="frontend"})
In DataDog, percentiles are disabled by default for distribution metric types. Before querying percentiles, you must enable them per metric in configuration.
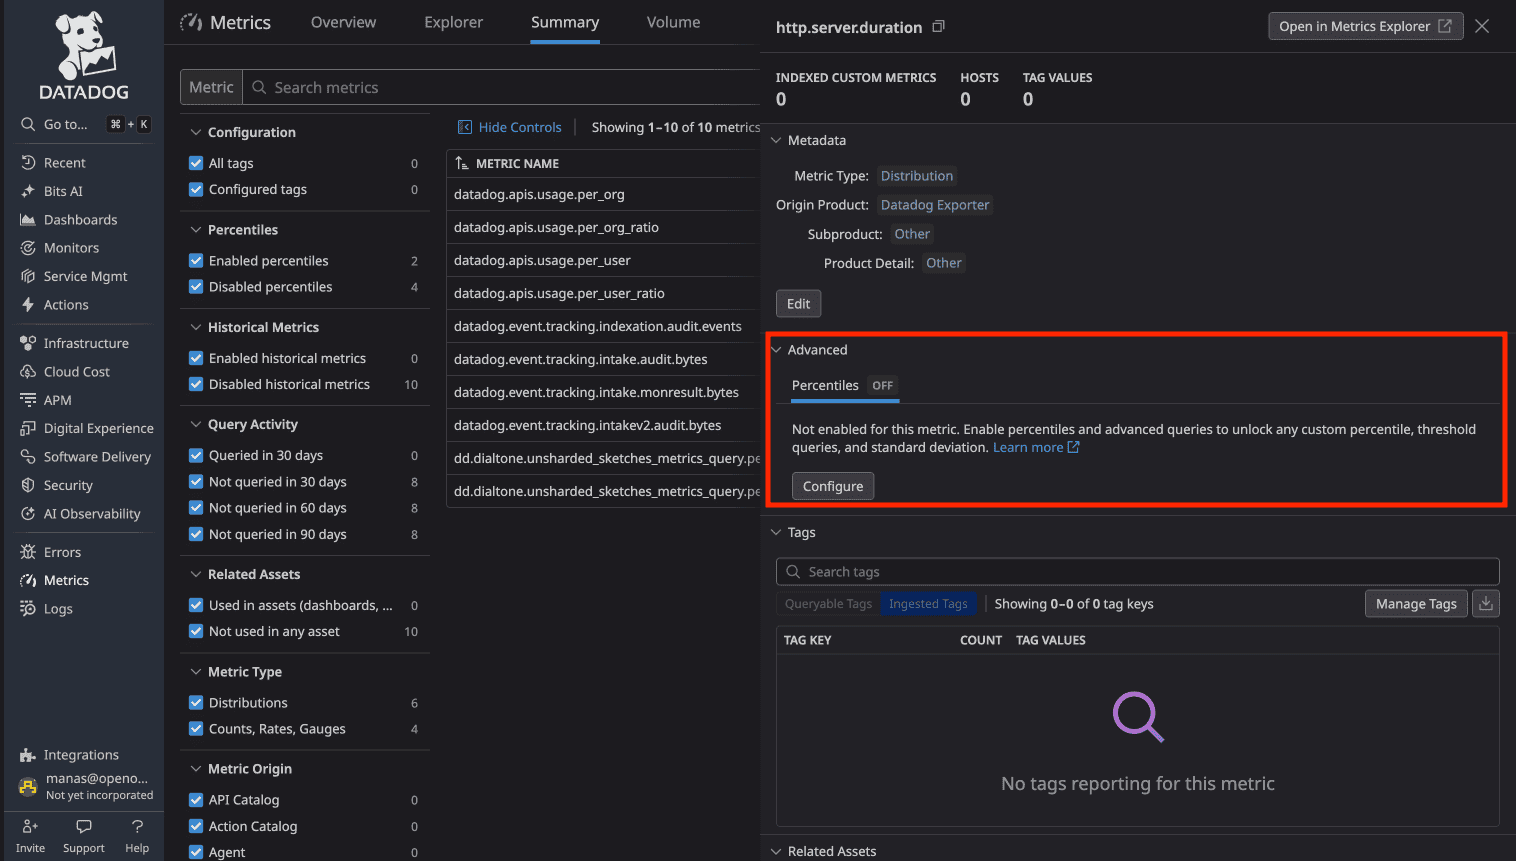
This extra step exists because percentile storage has cost implications. You can't just query percentiles. You must first decide which metrics "deserve" percentile analysis.
OpenObserve supports all PromQL aggregations by default. Want P99? Query it. No pre-configuration, no cost consideration.
Downsampling: Automatic vs Manual
Downsampling is an Enterprise feature in OpenObserve.
Downsampling reduces resolution of older metrics to save storage while retaining trends. Example: 1-second resolution for 7 days, 1-minute for 30 days, 1-hour for 1 year.
DataDog supports manual rollups. Use rollup() function in queries to aggregate over time windows.
OpenObserve Enterprise provides automatic downsampling. Configure rules per stream with retention periods and aggregation intervals. The system applies downsampling as data ages.
Learn more: OpenObserve Downsampling Documentation
Migration from DataDog to OpenObserve
Available in OSS and Enterprise Edition.
Migrating metrics is straightforward, even with DataDog Agents:
- DataDog Agent collects metrics via DogStatsD
- Forward to OpenTelemetry Collector's StatsD receiver
- StatsD receiver translates to OTLP format
- Export to OpenObserve
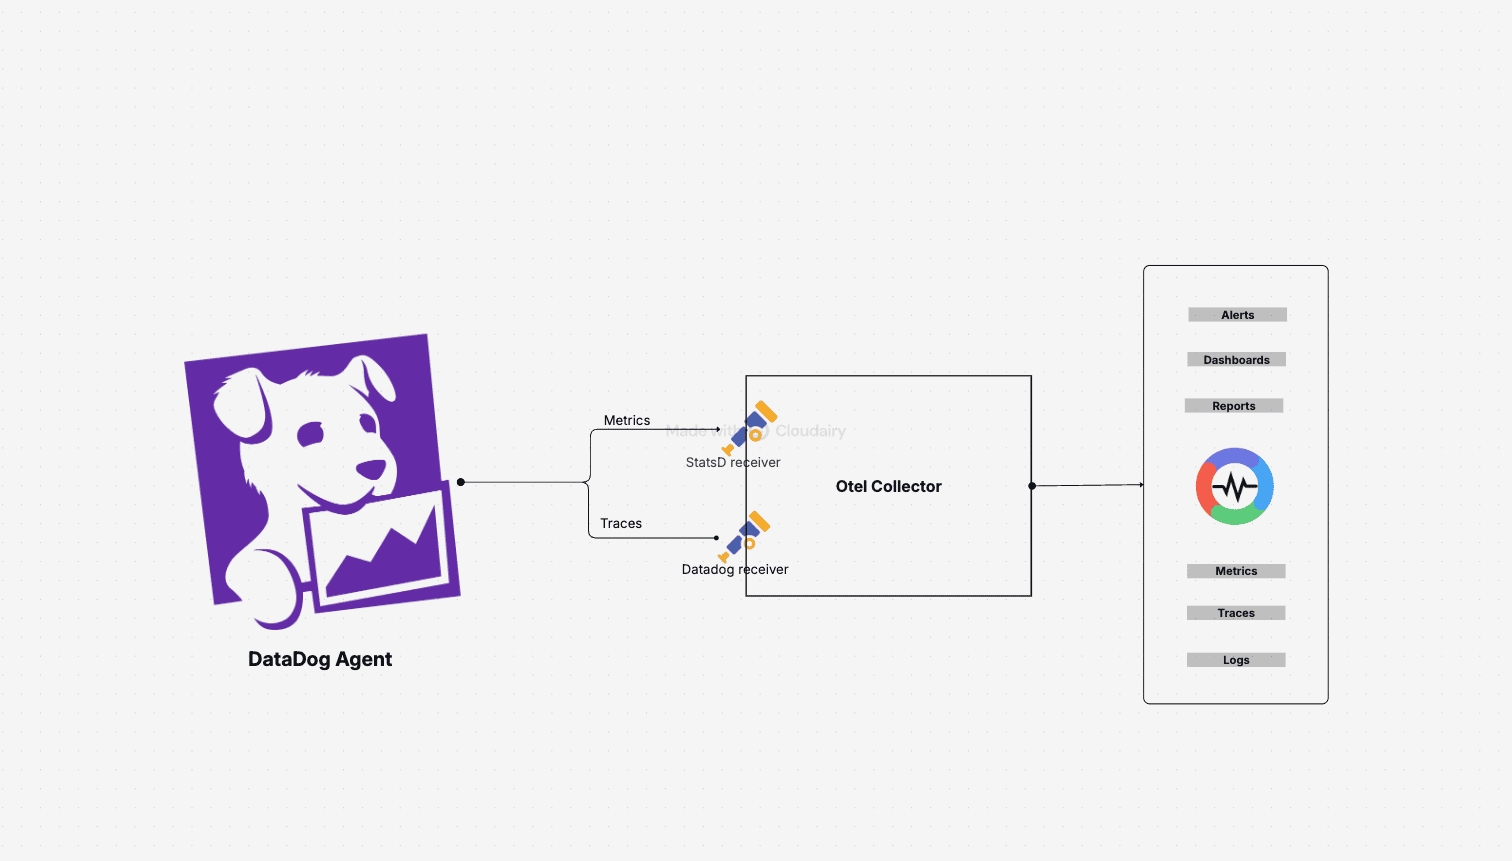
Metric type translation:
- DataDog Gauge → OTel Gauge
- DataDog Count/Rate → OTel Sum
- DataDog Distribution → OTel Exponential Histogram
This preserves existing DataDog Agent instrumentation while routing to OpenObserve. No immediate re-instrumentation. Migrate incrementally.
Key advantage: PromQL compatibility. Once in OpenObserve, Prometheus queries work without modification. Adopt industry standard PromQL or use SQL.
Learn more: Migrate DataDog Metrics to OpenObserve
Quick Comparison
| Capability | DataDog | OpenObserve |
|---|---|---|
| Custom Metrics | 112 auto-generated metrics, billed separately (~$217/month in test) | No distinction, all metrics $0.30/GB |
| Query Language | Proprietary syntax | PromQL + SQL |
| High Cardinality | $0.05 per time series/month (503 time series = $25.15/month for one metric) | Flat $0.30/GB regardless of cardinality |
| Percentiles | Must enable per metric before querying | All aggregations by default |
| Dashboard Building | Drag-and-drop visual builder | Visual builder + PromQL + SQL queries |
| Downsampling | Manual rollups via query functions | Automatic (Enterprise) |
| Prometheus Compatible | Not compatible | Full PromQL support |
| Migration | Re-instrumentation required | DogStatsD → OTel Collector → O2 |
| Total Test Cost | $174/day (all observability) | $3.00/day (all observability) |
Cost Breakdown: DataDog vs OpenObserve for Metrics
DataDog's metrics pricing combines custom metrics charges, per-time-series costs, and host-based billing.
DataDog Metrics Costs
Custom Metrics: Auto-generated from OTel instrumentation added charges that varied during the test as retention was controlled.
Infrastructure Hosts: $18/day for hosts sending metrics.
Time Series Cardinality: Top metrics averaged 503, 40, 30, and 26 time series per hour. Each unique time series contributes to billing.
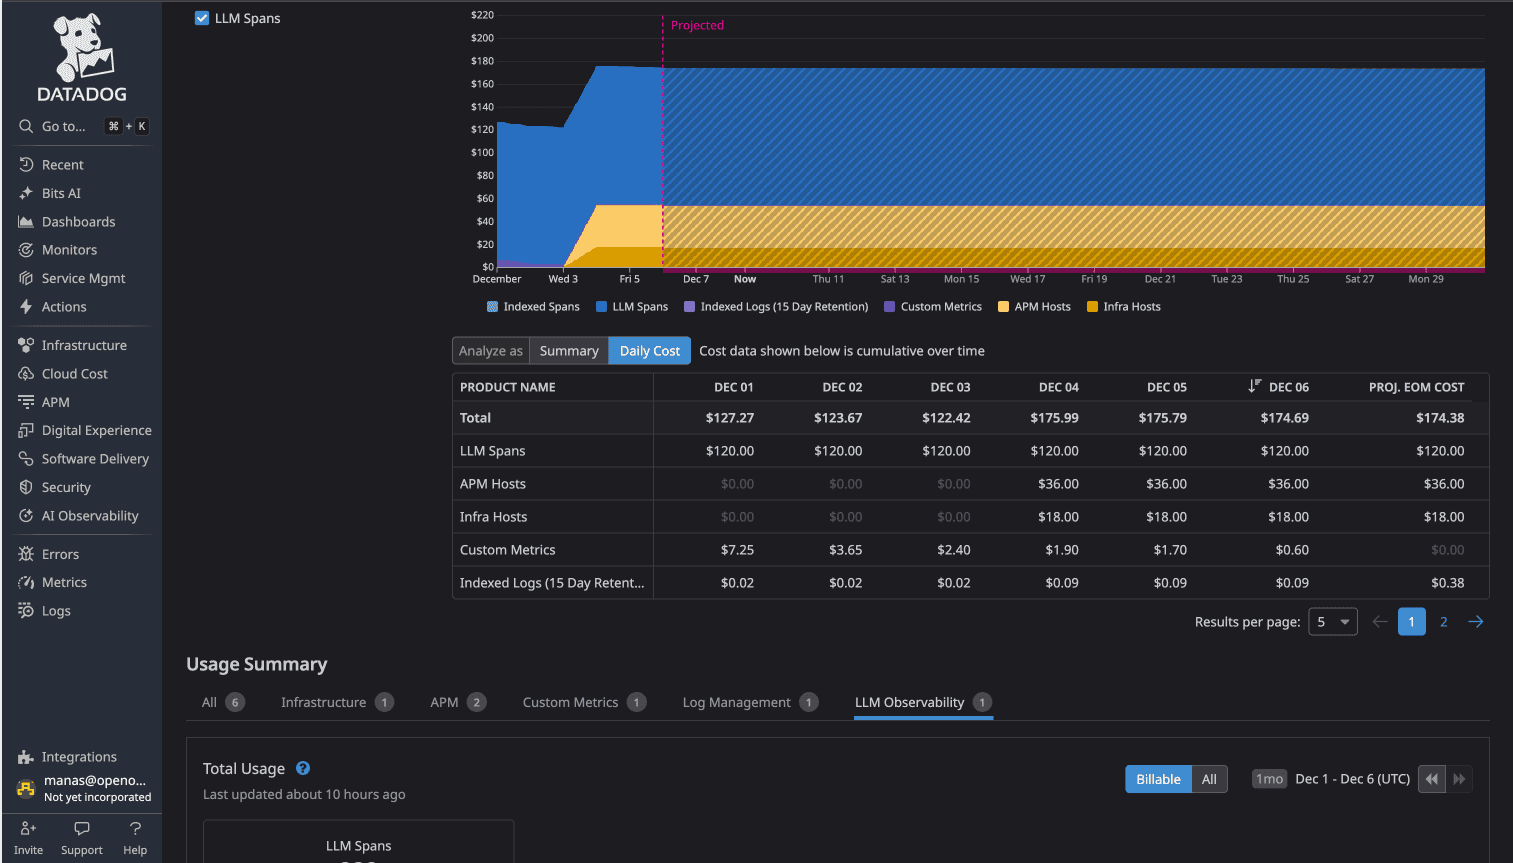
Total DataDog cost (all observability): $174/day
OpenObserve Metrics Costs
Flat rate: $0.30 per GB ingested for all metrics. No custom metrics surcharges. No per-time-series charges. No per-host billing.
Total OpenObserve cost (all observability): $3.00/day
The Difference
58x cost difference (more than 98% cost savings) for identical observability data.
Why This Matters
- No Cardinality Penalty: High-cardinality labels don't trigger cost multipliers
- No Custom Metrics Classification: All metrics priced equally
- Predictable Scaling: Costs scale with volume, not hosts or time series
The 90% savings Evereve achieved extends to metrics monitoring.
The Bottom Line
If evaluating metrics monitoring platforms, Prometheus alternatives, or open-source DataDog alternatives, OpenObserve delivers:
- PromQL compatibility: migrate from Prometheus without rewriting queries
- No custom metrics penalties: all metrics priced equally
- High-cardinality support: flat pricing regardless of time series counts
- SQL for analytics: query metrics with SQL for complex analysis
- Up to 90% cost savings
For platform engineers managing OpenTelemetry-instrumented microservices, these differences matter. Less cost anxiety about cardinality. More query flexibility with PromQL and SQL. Transparent pricing that scales predictably.
- Full comparison
- Part 1: Logs - Automatic Field Discovery, SQL Queries, and 90% Cost Savings
- Part 2: Metrics- Drag & Drop, SQL, PromQL, High Cardinality
- Part 3: Traces/APM - OTel Native, No Hidden Tiers
- Part 4: Dashboards- Prebuilt, Drag & Drop, Custom
- Part 5: Alerts, Monitors, Destinations
- Part 6: Real User Monitoring
- Part 7: Pipelines
- Part 8: IAM (SSO, RBAC)
- Part 9: Cost
Sign up for a free cloud trial or schedule a demo to test OpenObserve with your metrics.
About the Author
Manas Sharma


Manas is a passionate Dev and Cloud Advocate with a strong focus on cloud-native technologies, including observability, cloud, kubernetes, and opensource. building bridges between tech and community.