“OpenObserve helped us migrate from Datadog in under an hour... reducing observability costs by 4x.”

4x
Lower observability cost

< 1 hour
Migrated off Datadog

Flat pricing
No month-end surprises
All indexed. No sampling.
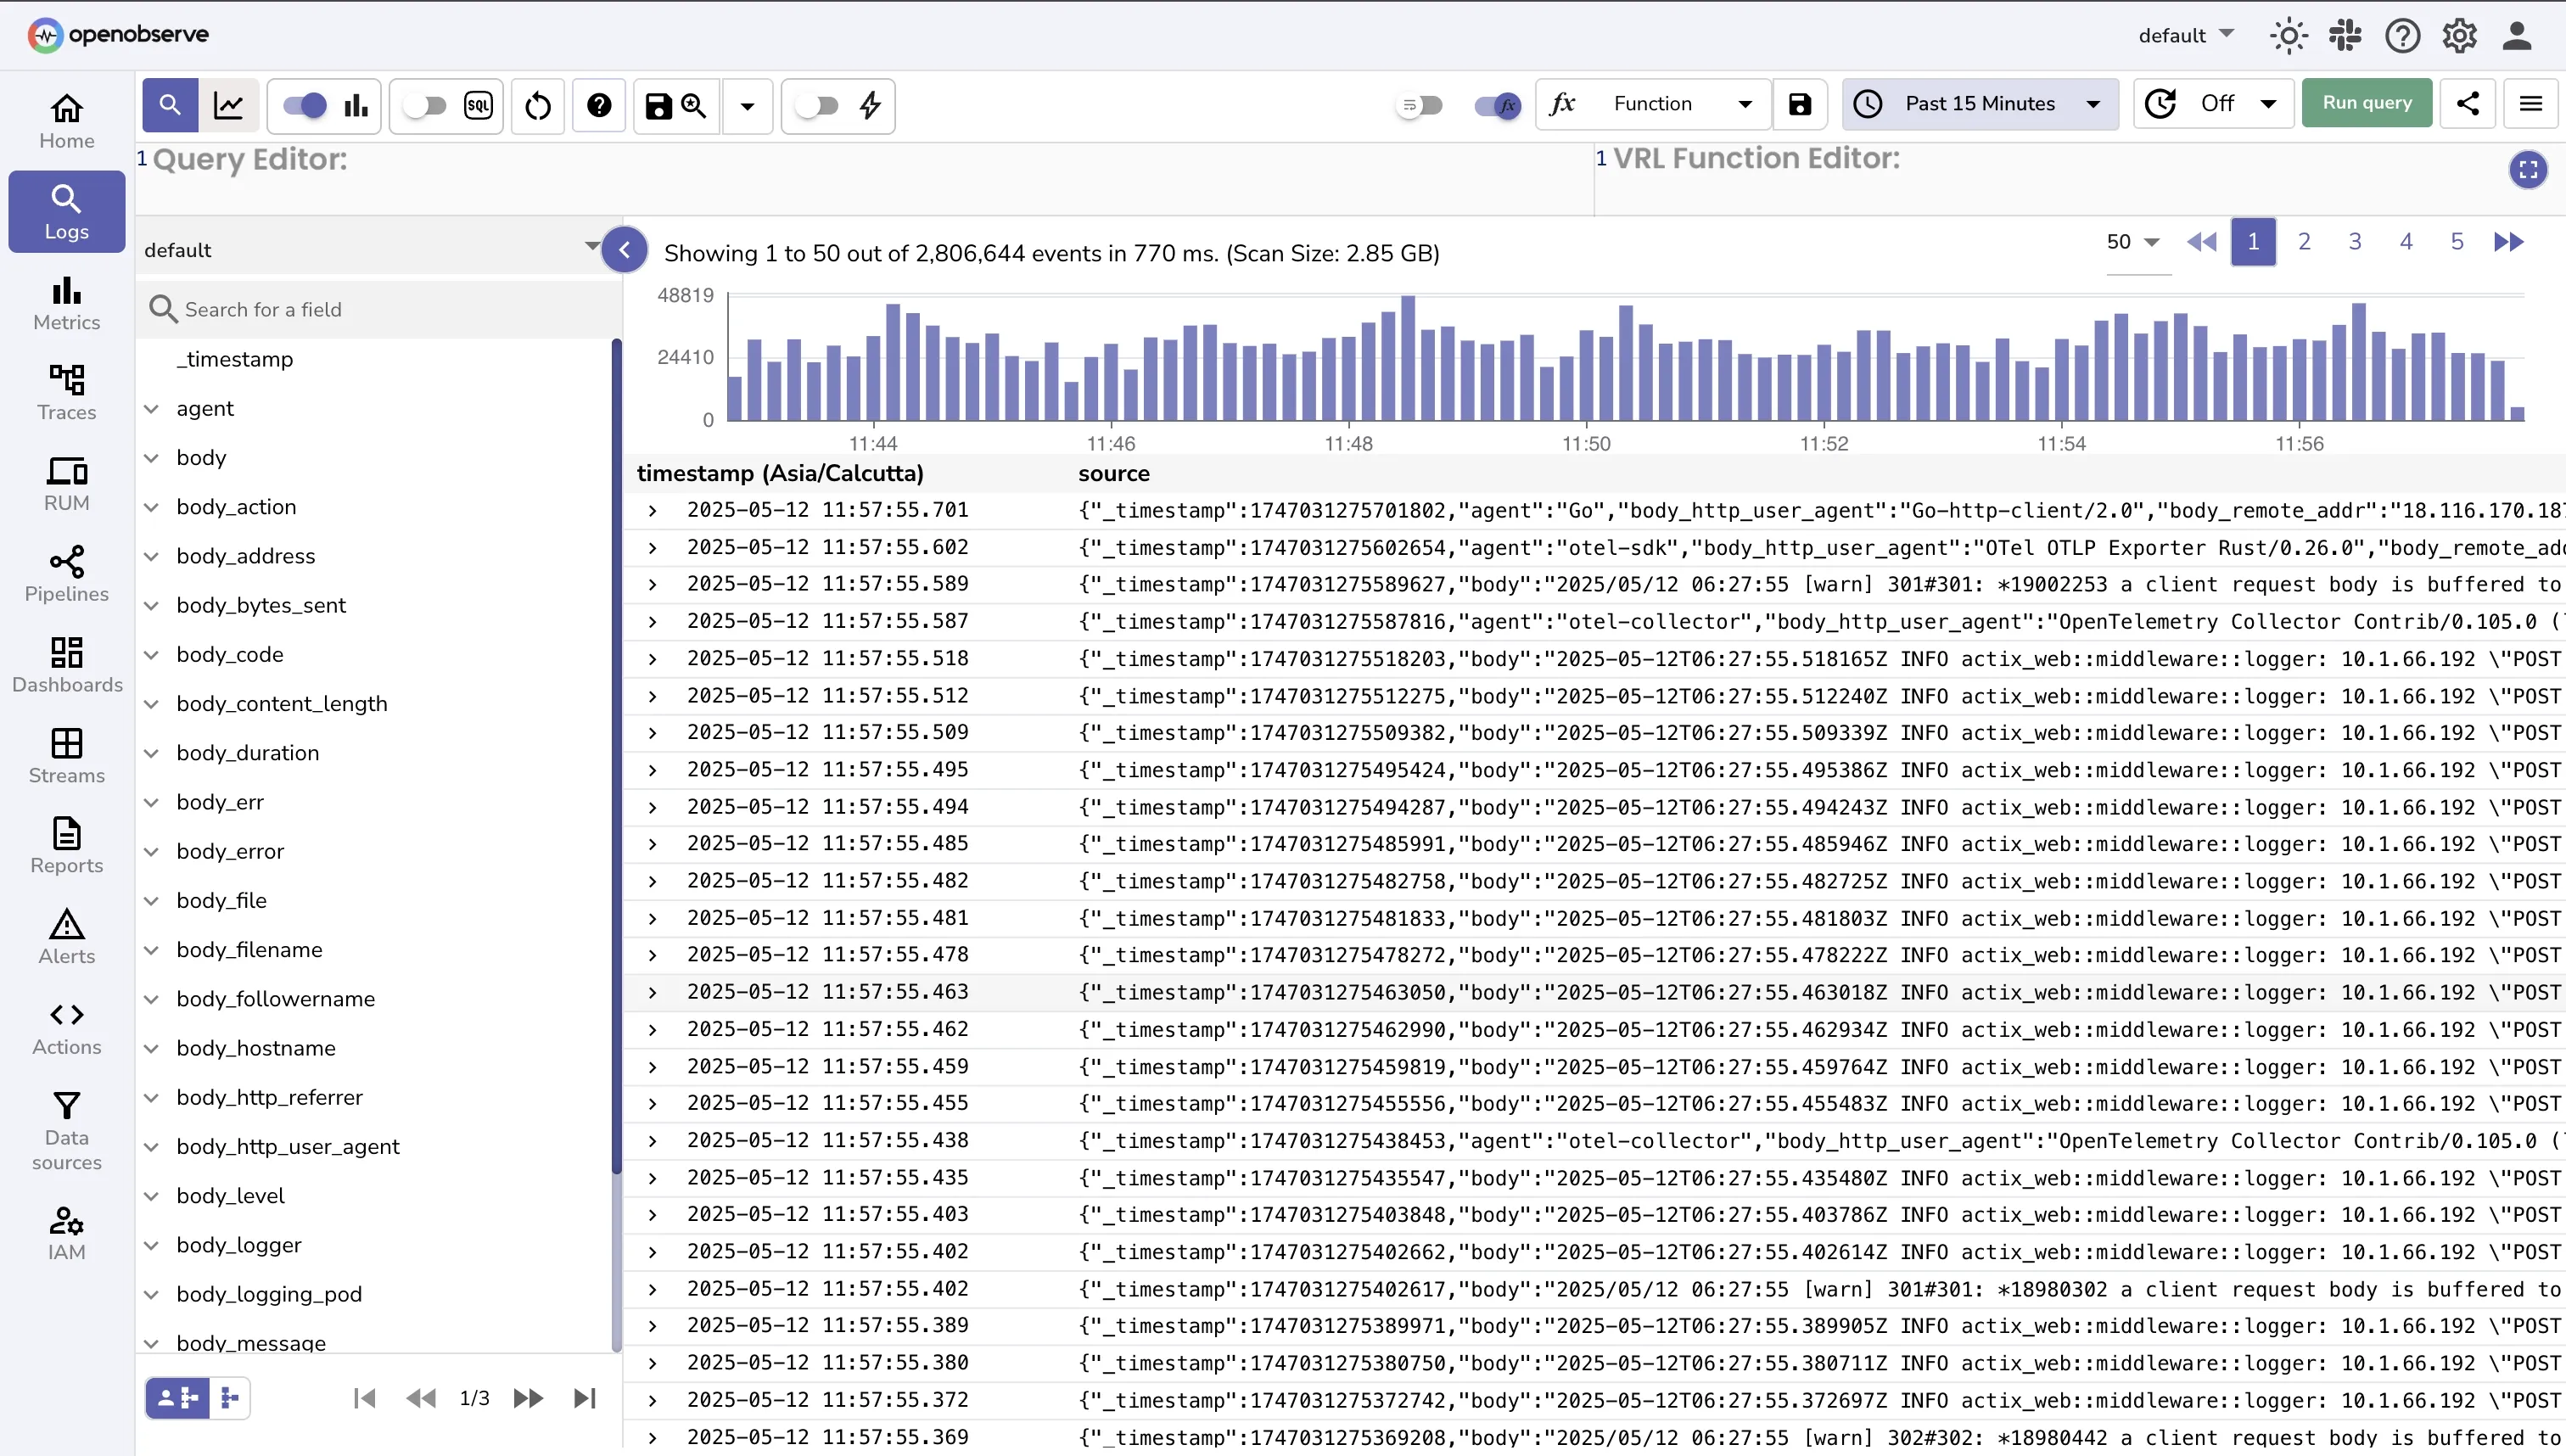
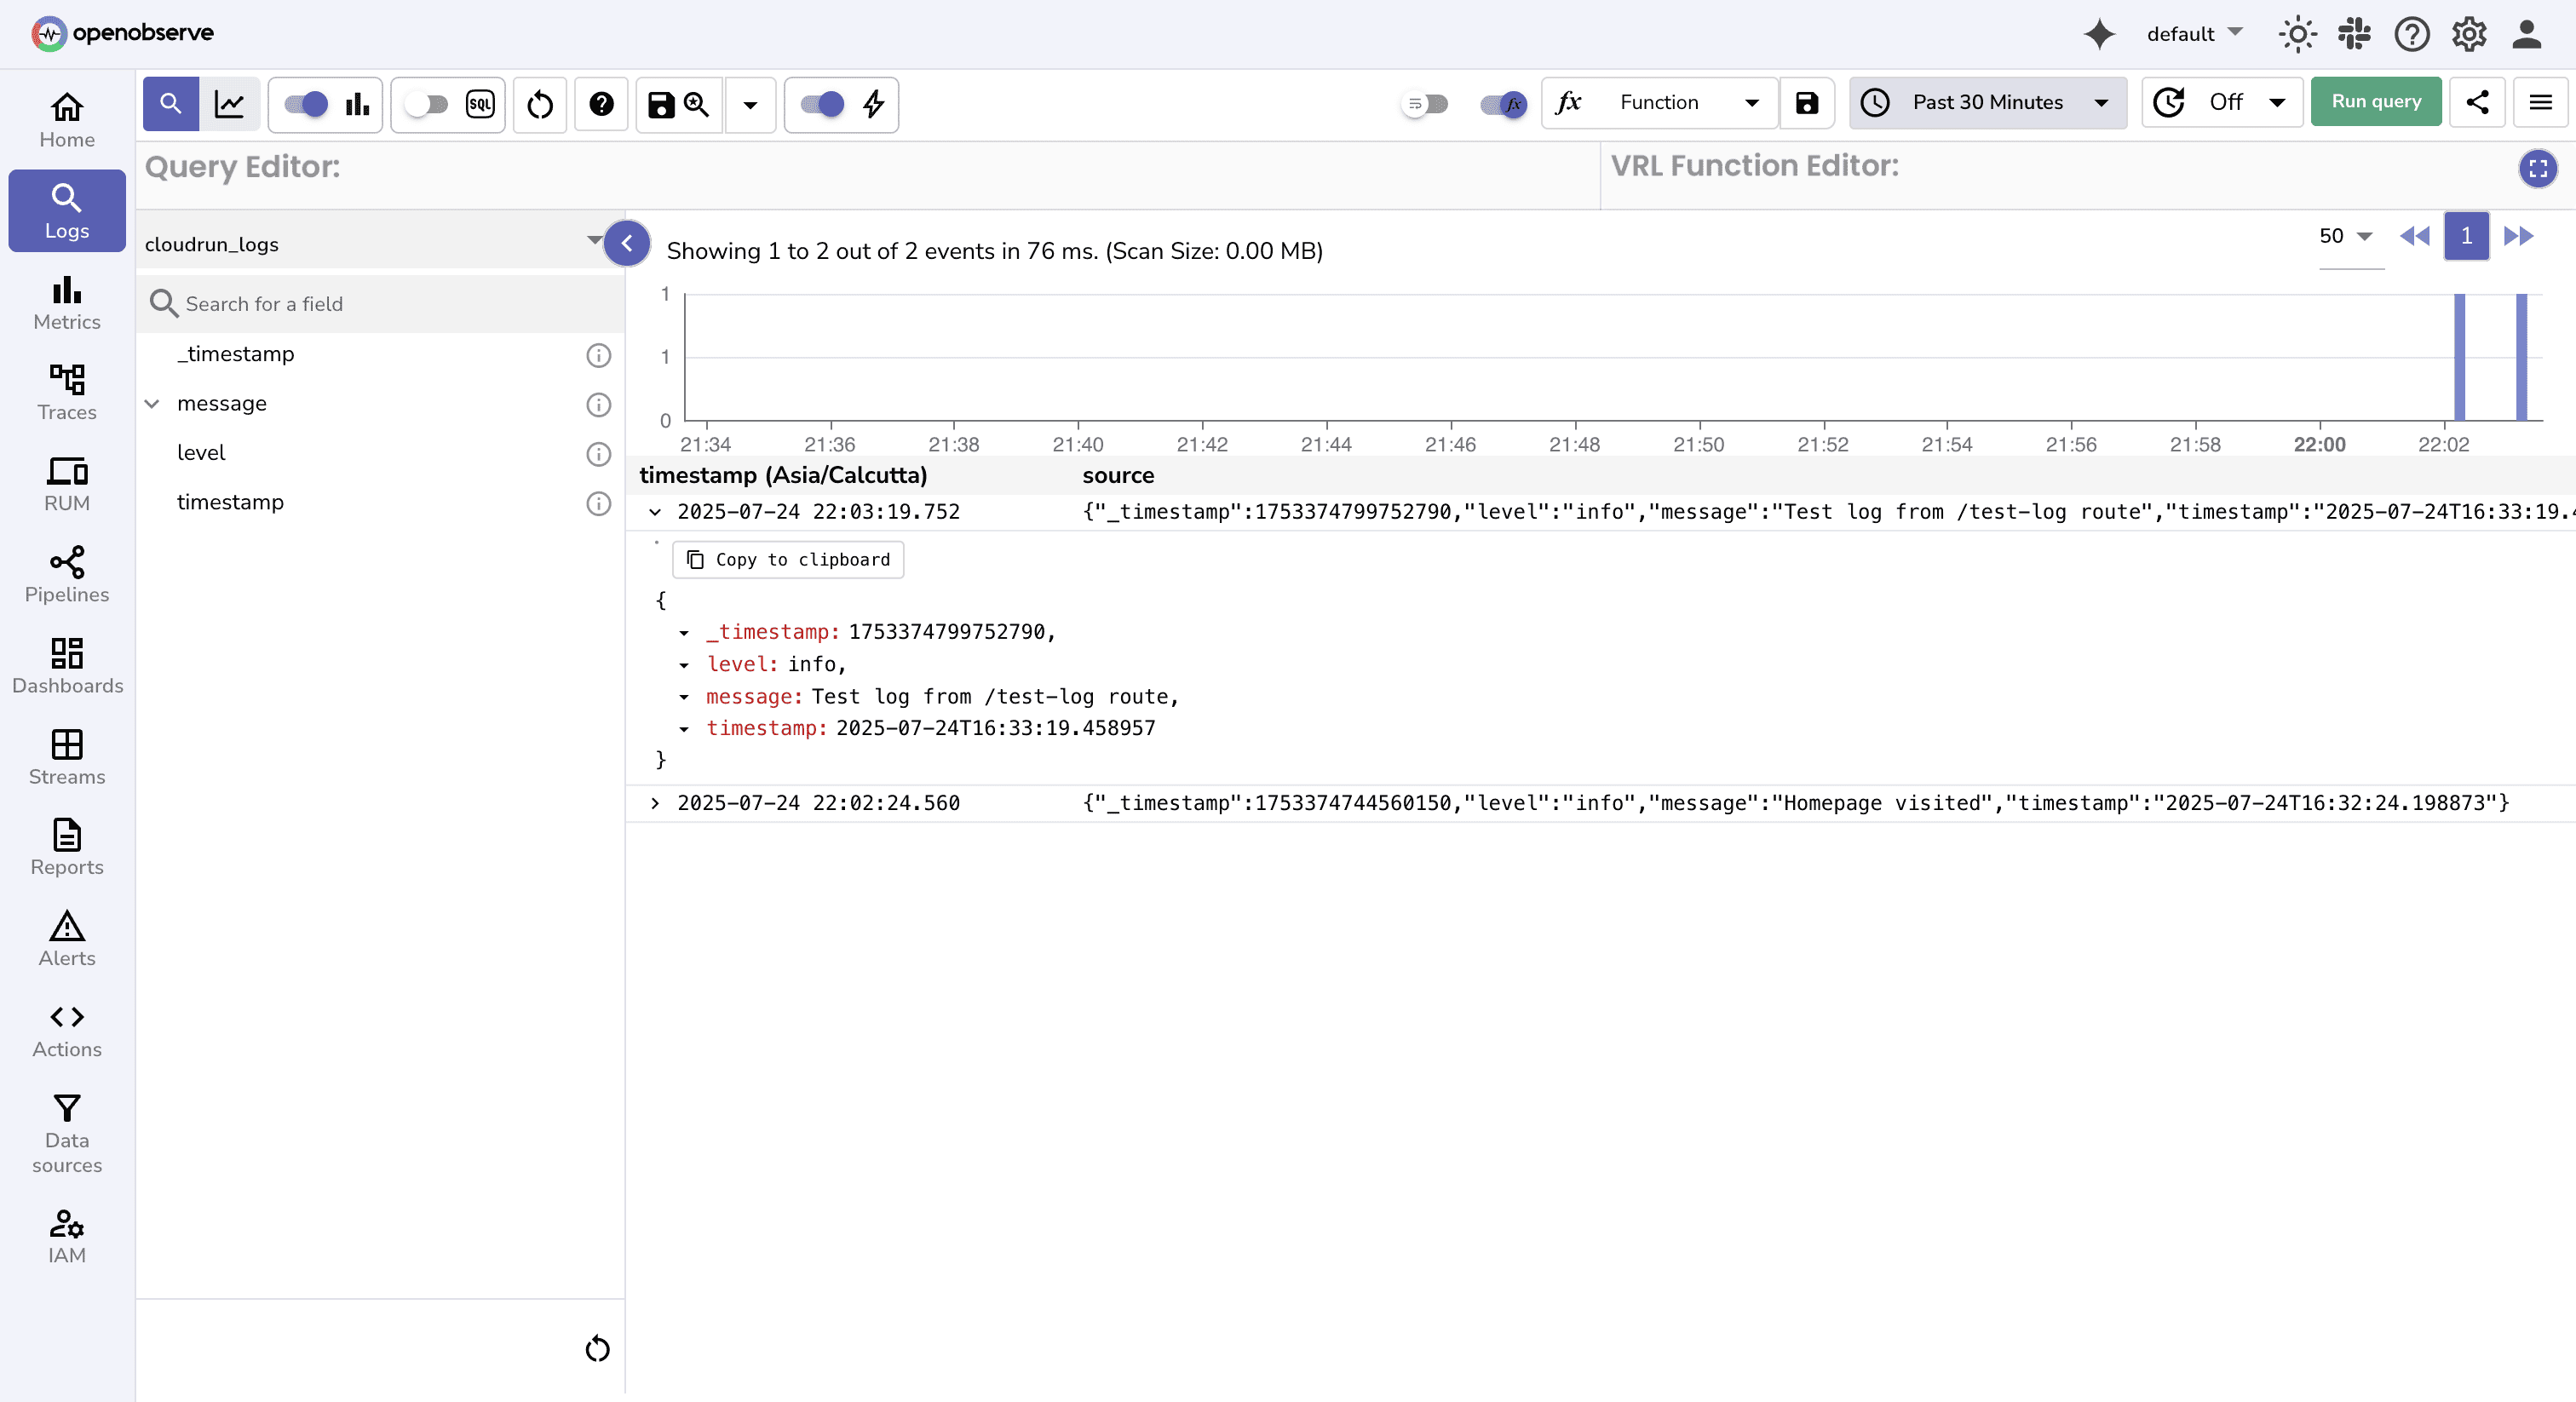
Every log field, fully indexed, forever queryable, powered by columnar Parquet storage and a Rust query engine, at a fraction of Elasticsearch’s cost.
Columnar Parquet storage cuts log storage cost without cutting retention.
A Rust query engine keeps searches fast as data grows.
Standardized collection with zero vendor lock-in.
Scale from gigabytes to petabytes without the bill scaling with it.
Enrich, filter, and reshape logs during ingestion with Vector Remap Language, maintaining peak performance while handling any log format.
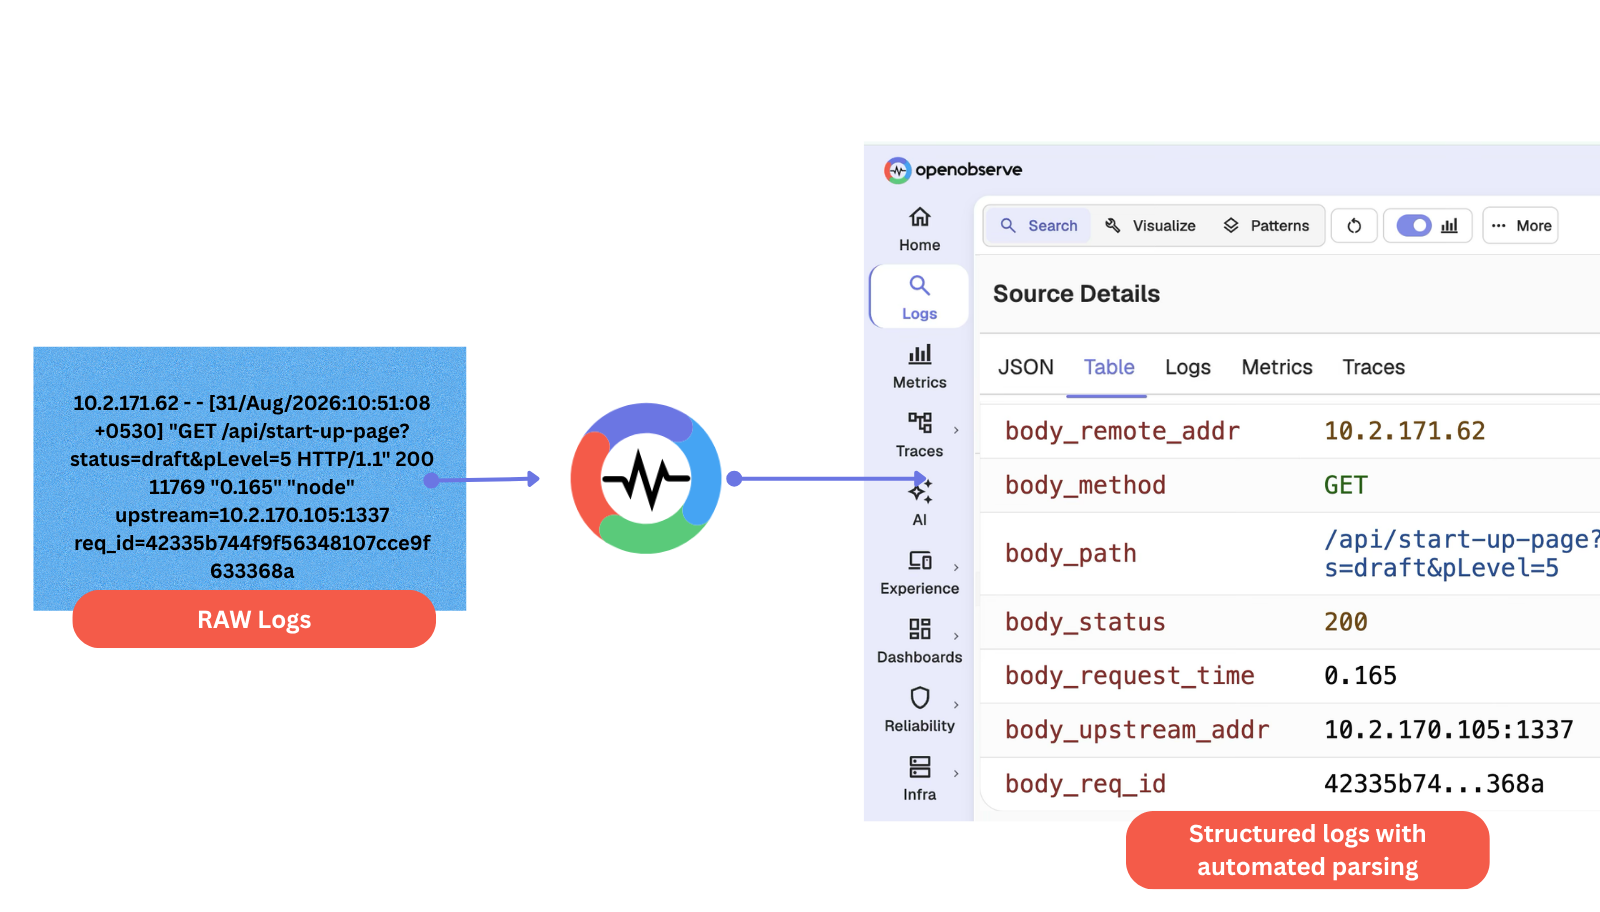
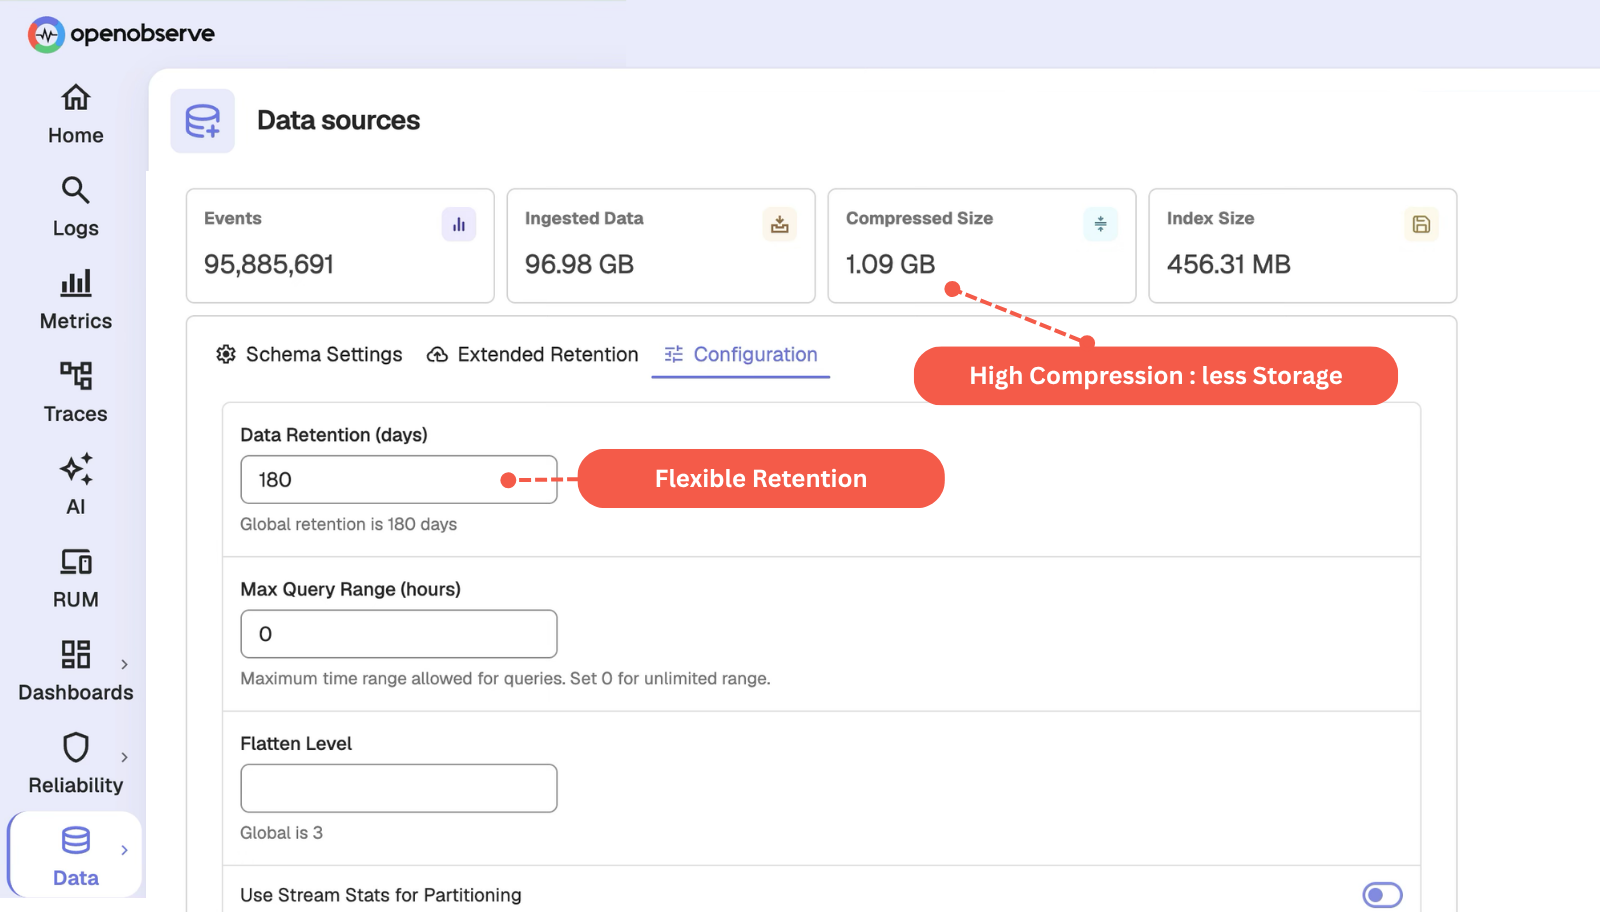
Slash log storage costs by up to 140x compared to Elasticsearch with columnar storage and Parquet format.
Configure custom log retention policies per data source, keeping valuable logs accessible longer without escalating costs.
Get answers the moment logs arrive, with sub-second results even across petabytes of data.
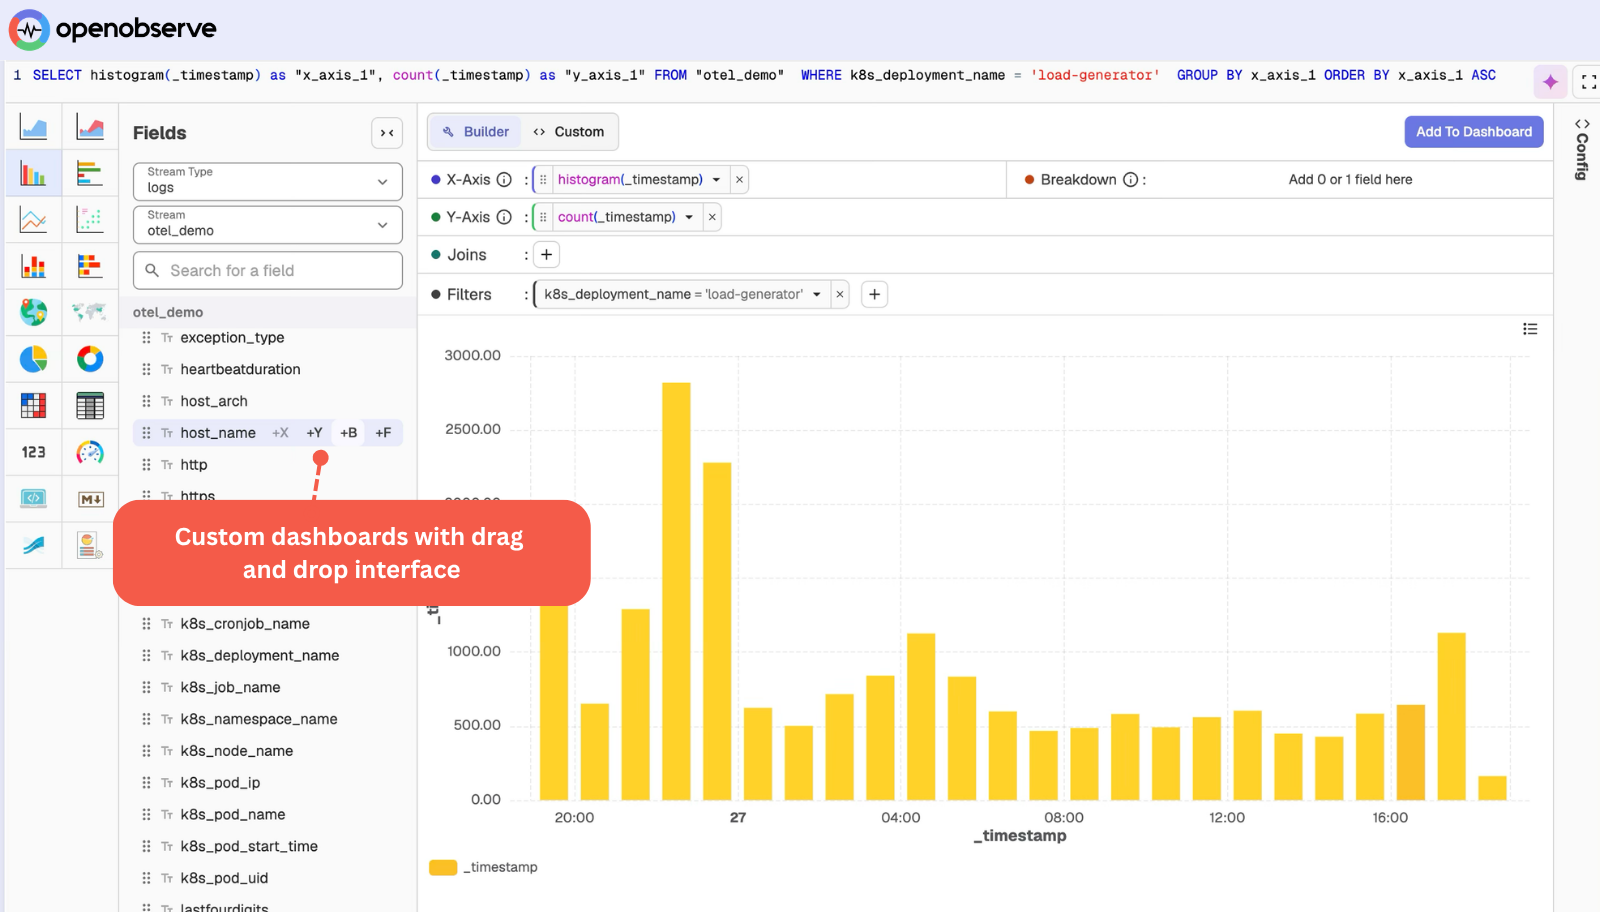
Build customized logging dashboards in minutes with a drag-and-drop interface that updates live and shares with one click.
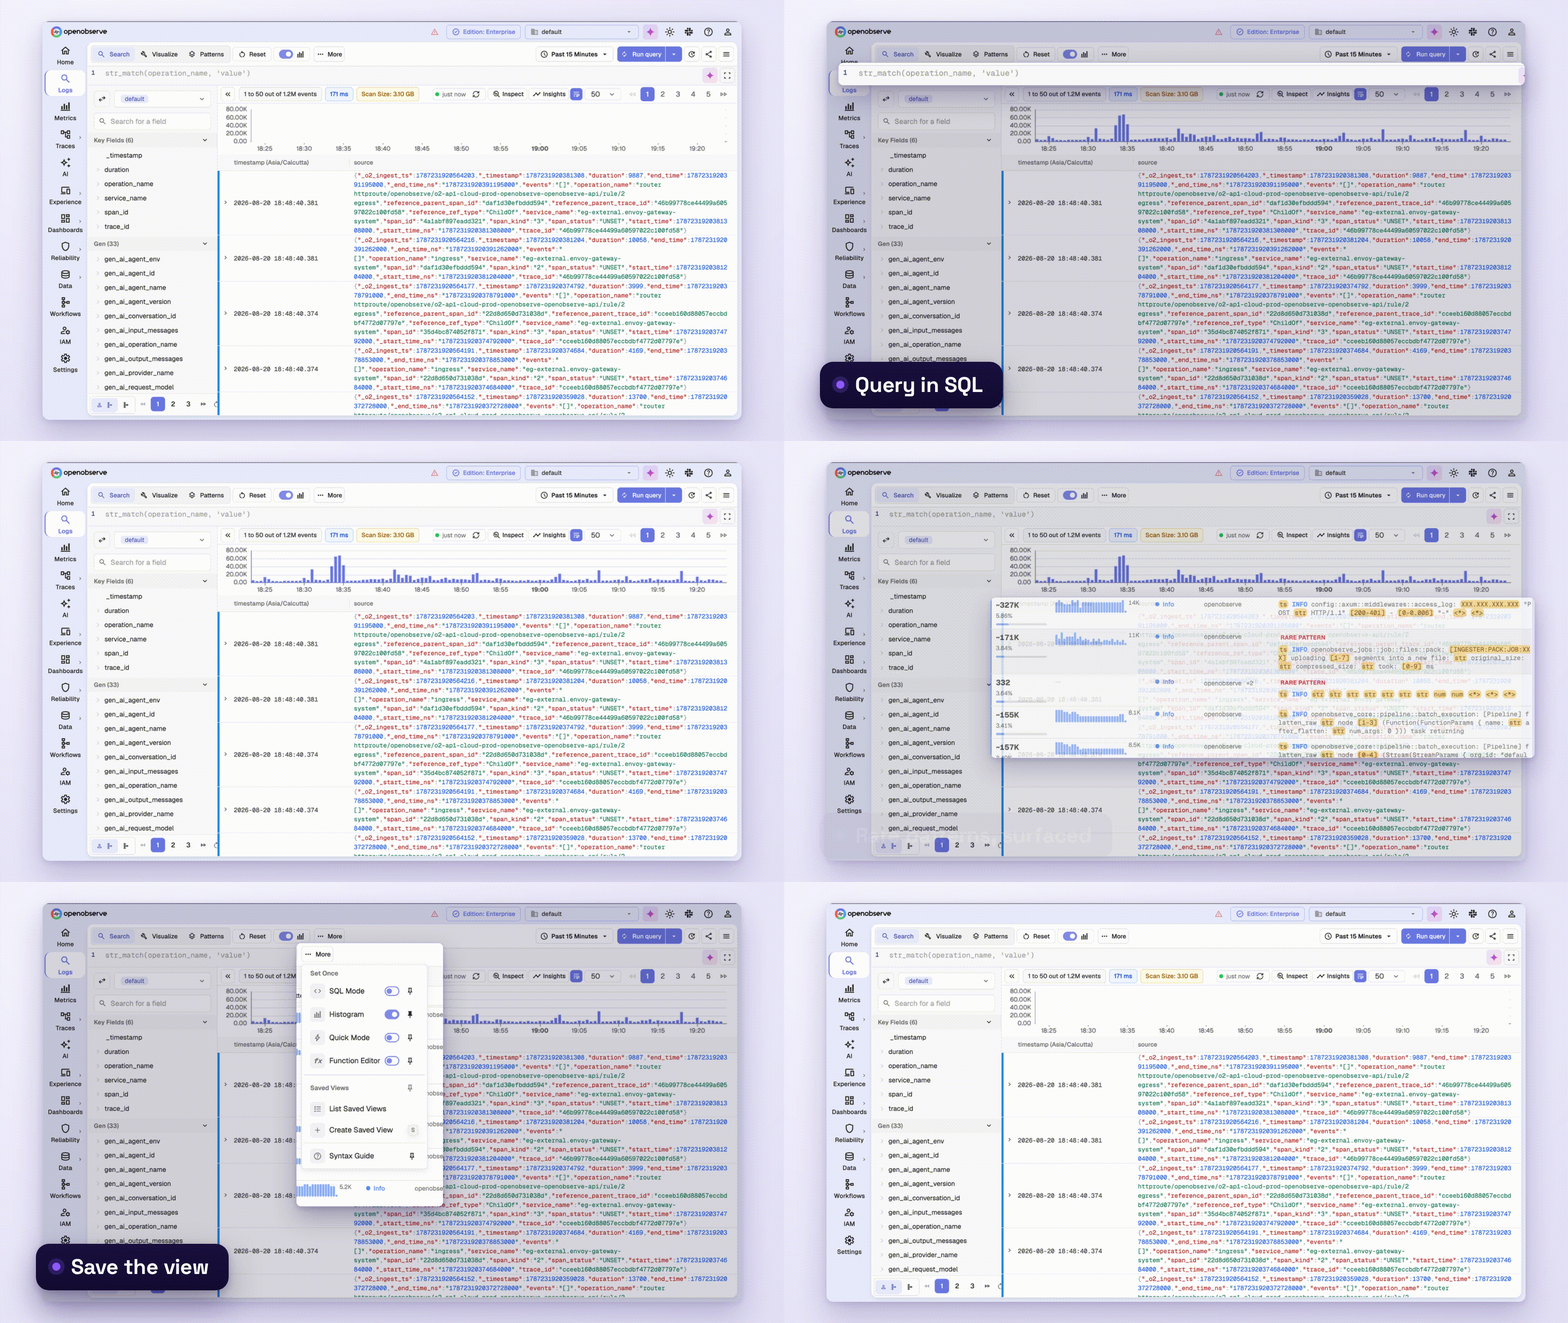
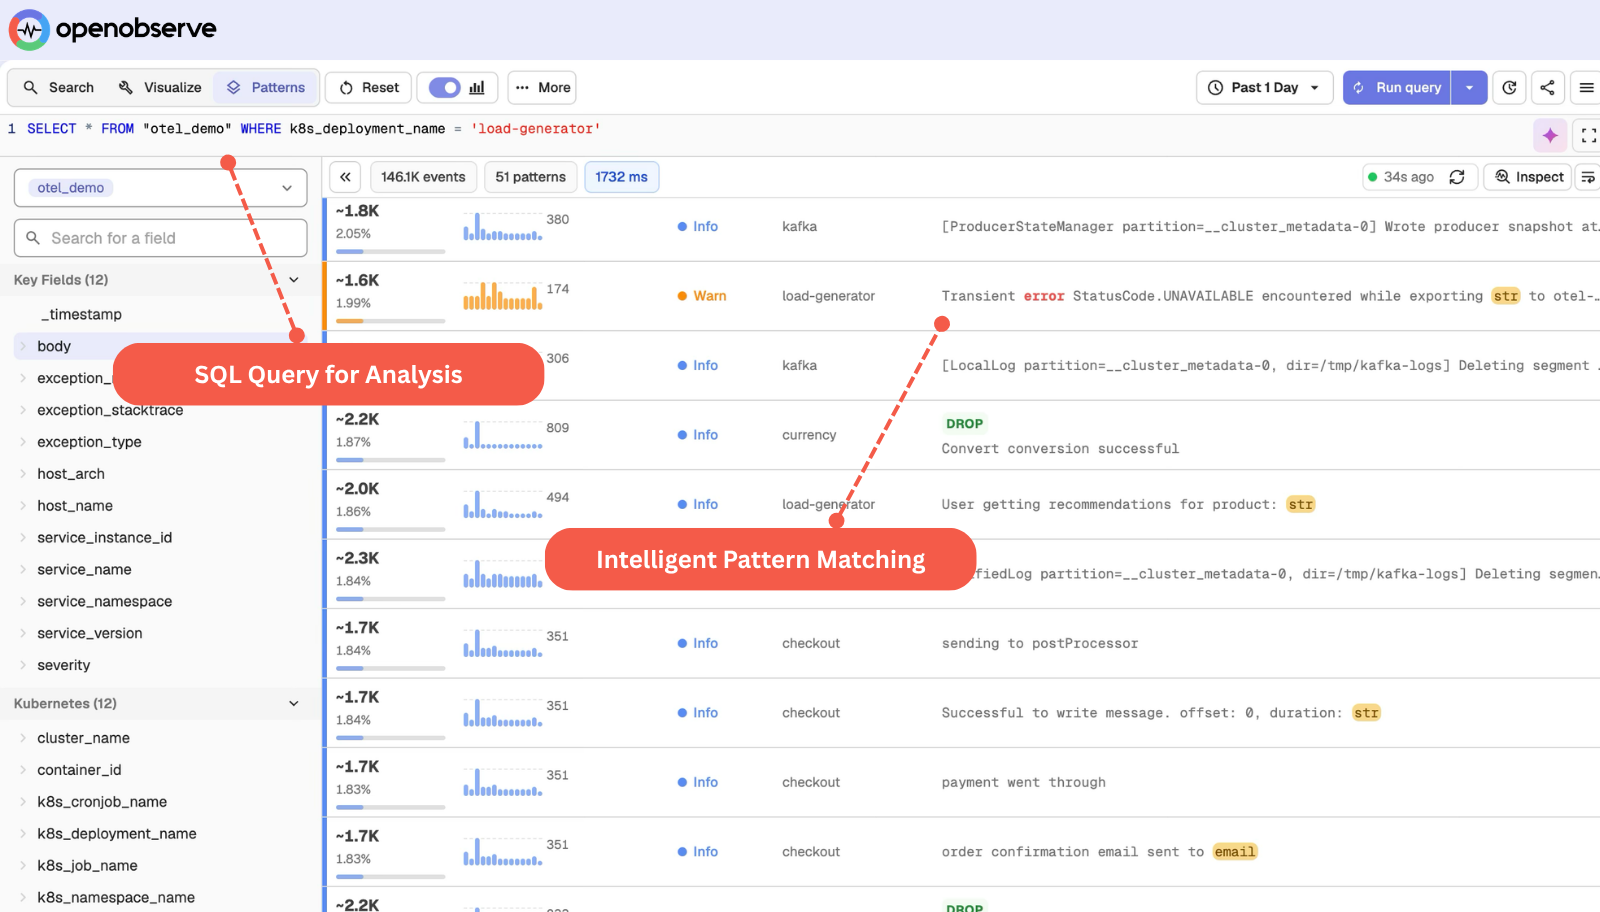
Find specific log entries across massive datasets in seconds with intelligent pattern matching that surfaces relevant results first.
Use SQL to run precise queries and complex aggregations across all log sources.
Same telemetry, same workloads, one platform. Every number is OpenObserve against a named vendor - not an industry average.
vs. Datadog
8×
more cost-effective
8x cost reduction means you can unify your observability into a single platform.
Read case studyvs. Elastic
140×
storage efficiency
140x storage means longer retention doesn't necessarily mean expensive bills.
Read case studyvs. Grafana stack
5–15×
faster performance
5x to 15x faster queries mean dashboards load in milliseconds, not minutes.
Read case studySee how much you would save switching today.
Correlate between the environments and signals across various sources with OpenObserve built-in correlation engine.
“OpenObserve helped us migrate from Datadog in under an hour... reducing observability costs by 4x.”
4x
Lower observability cost
< 1 hour
Migrated off Datadog
Flat pricing
No month-end surprises
to help you get the most out of Logs.
Try OpenObserve today for more efficient and performant observability.

AI Observability by OpenObserve
OpenTelemetry-native observability for agents and LLMs.