Metrics
Monitor your infrastructure and applications with Prometheus-native metrics and efficient time-series storage.
Correlated Telemetry
Visualize and troubleshoot metrics, logs, and traces in a single pane of glass
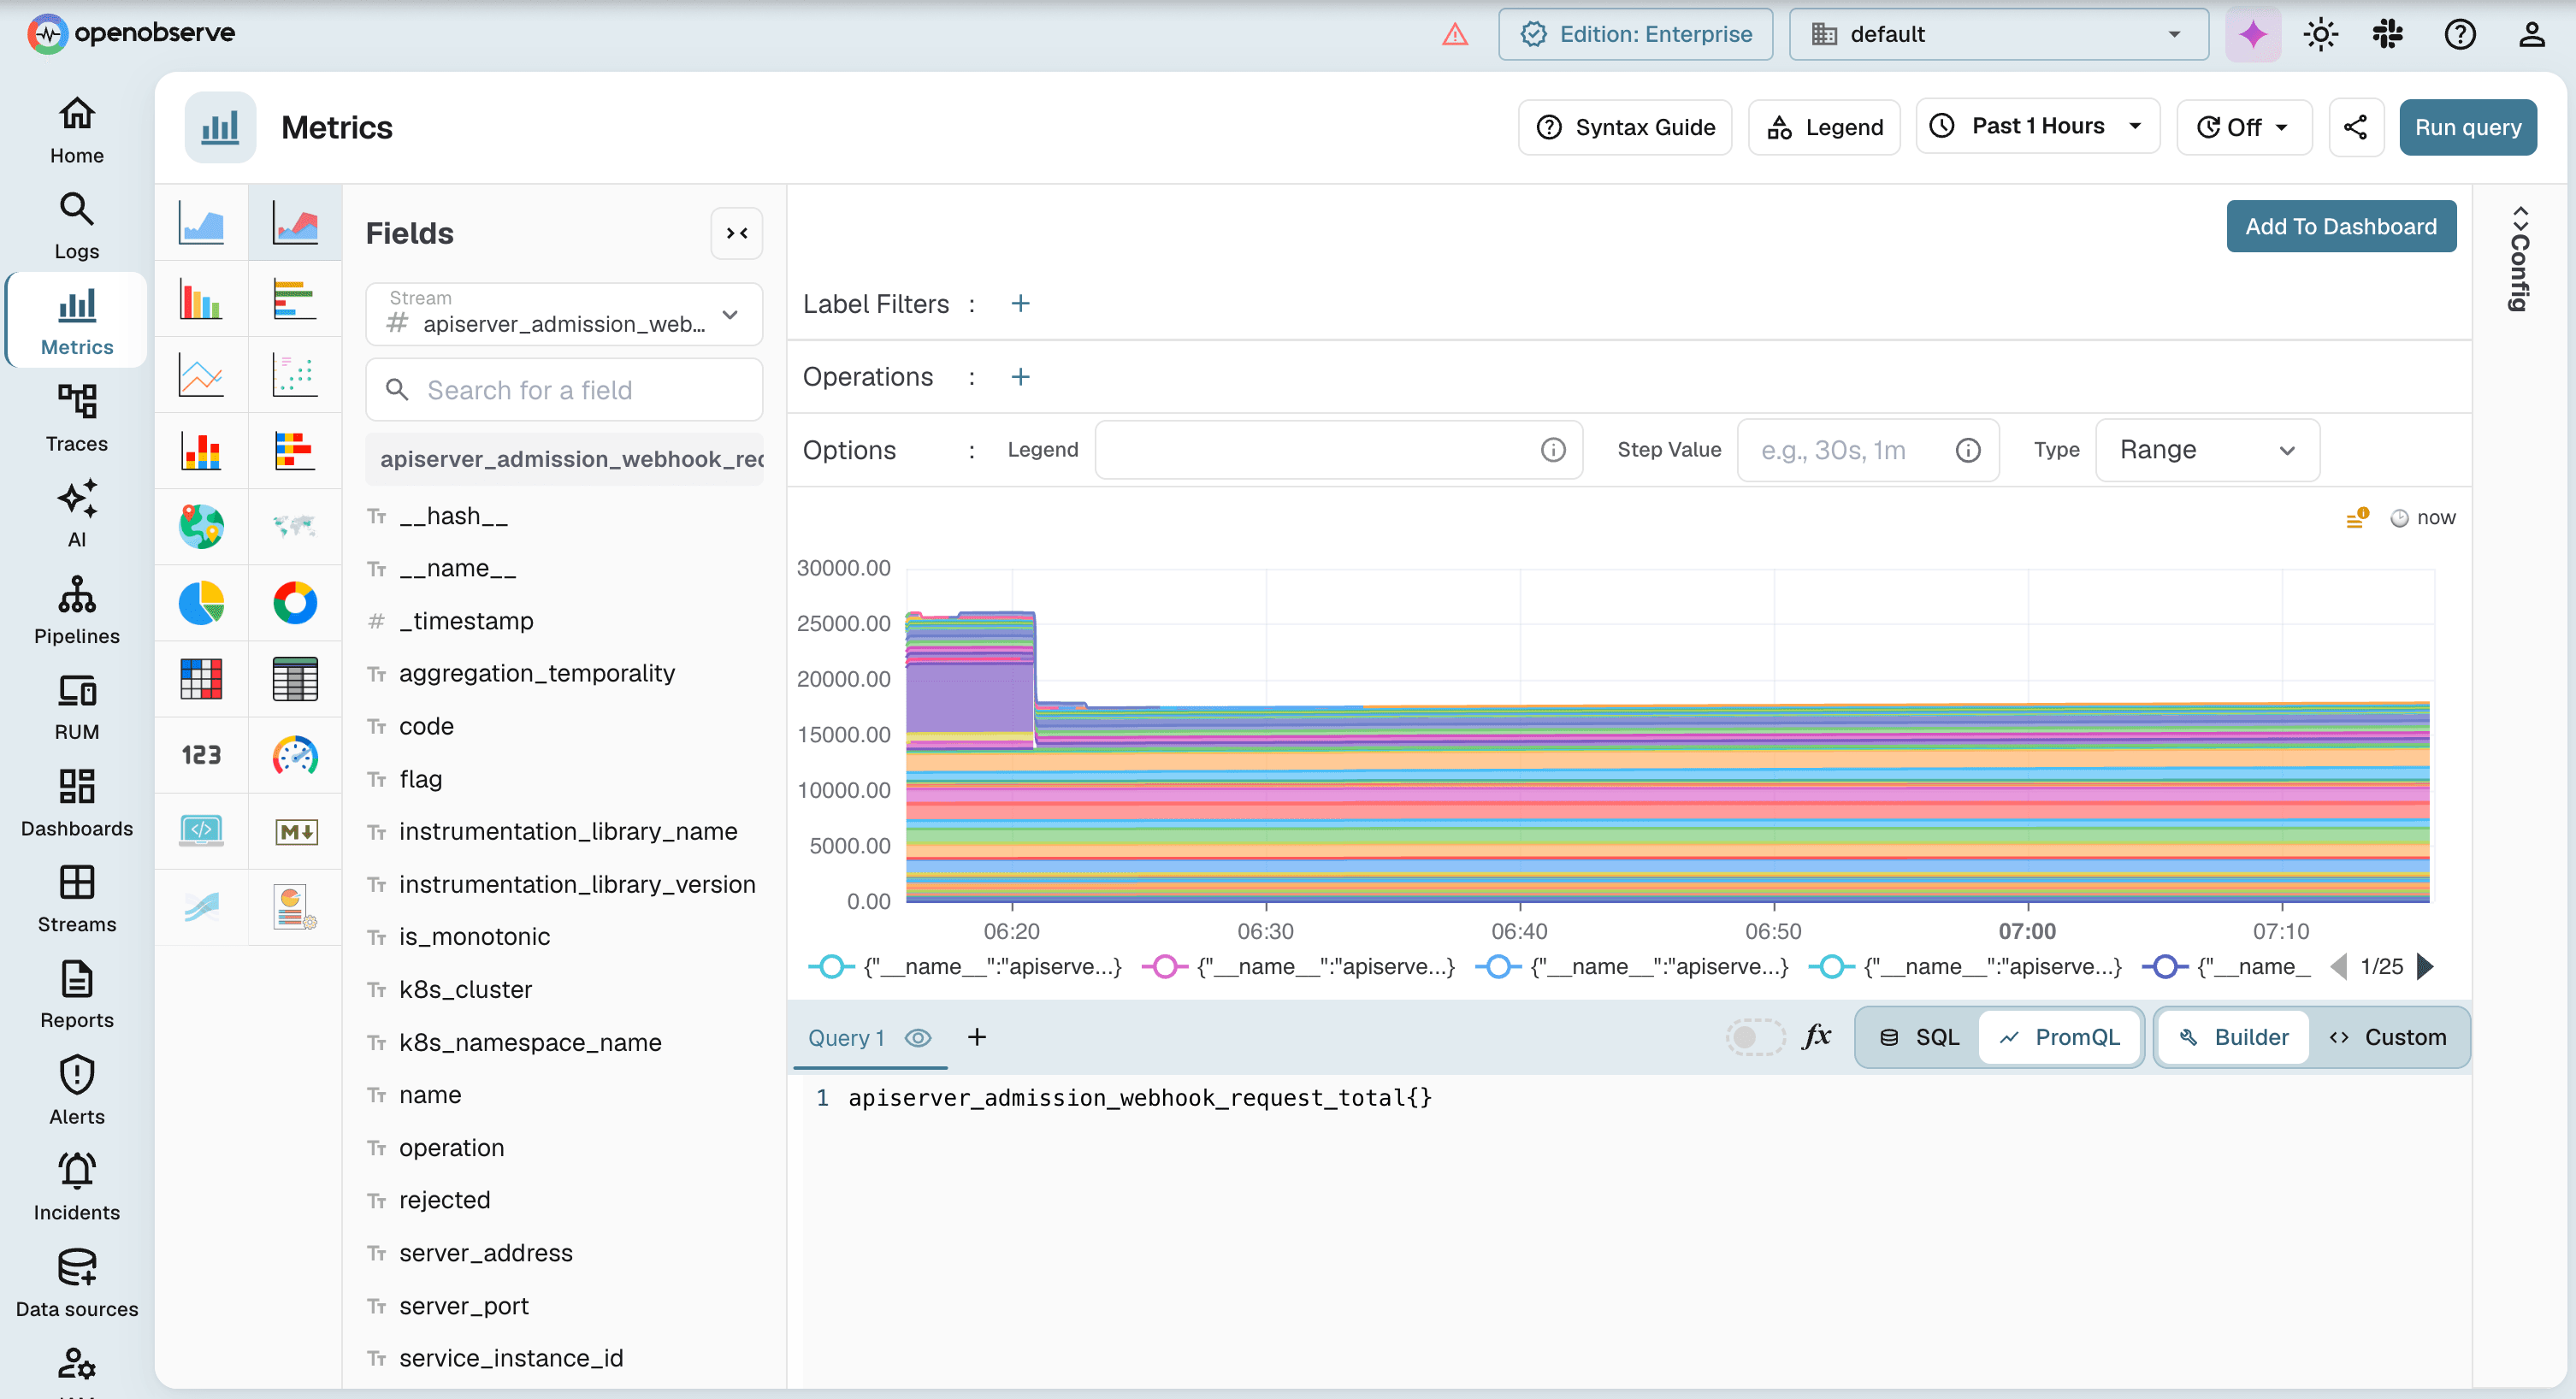
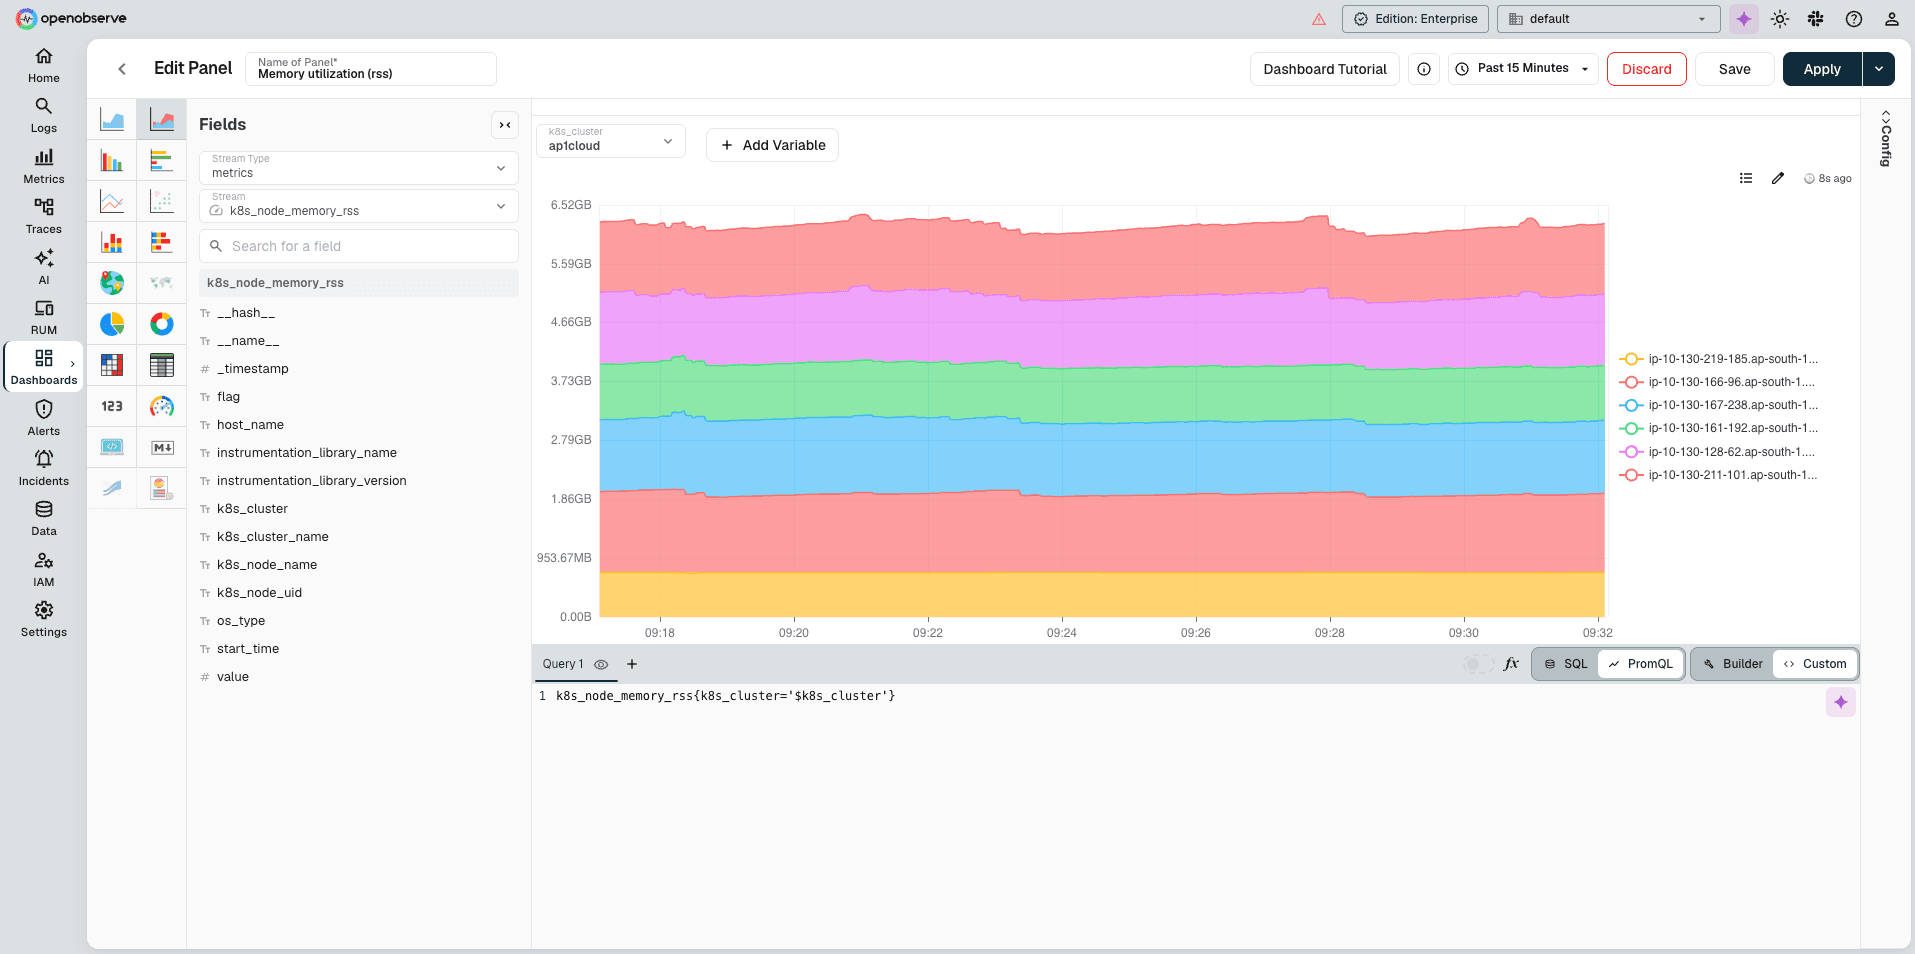
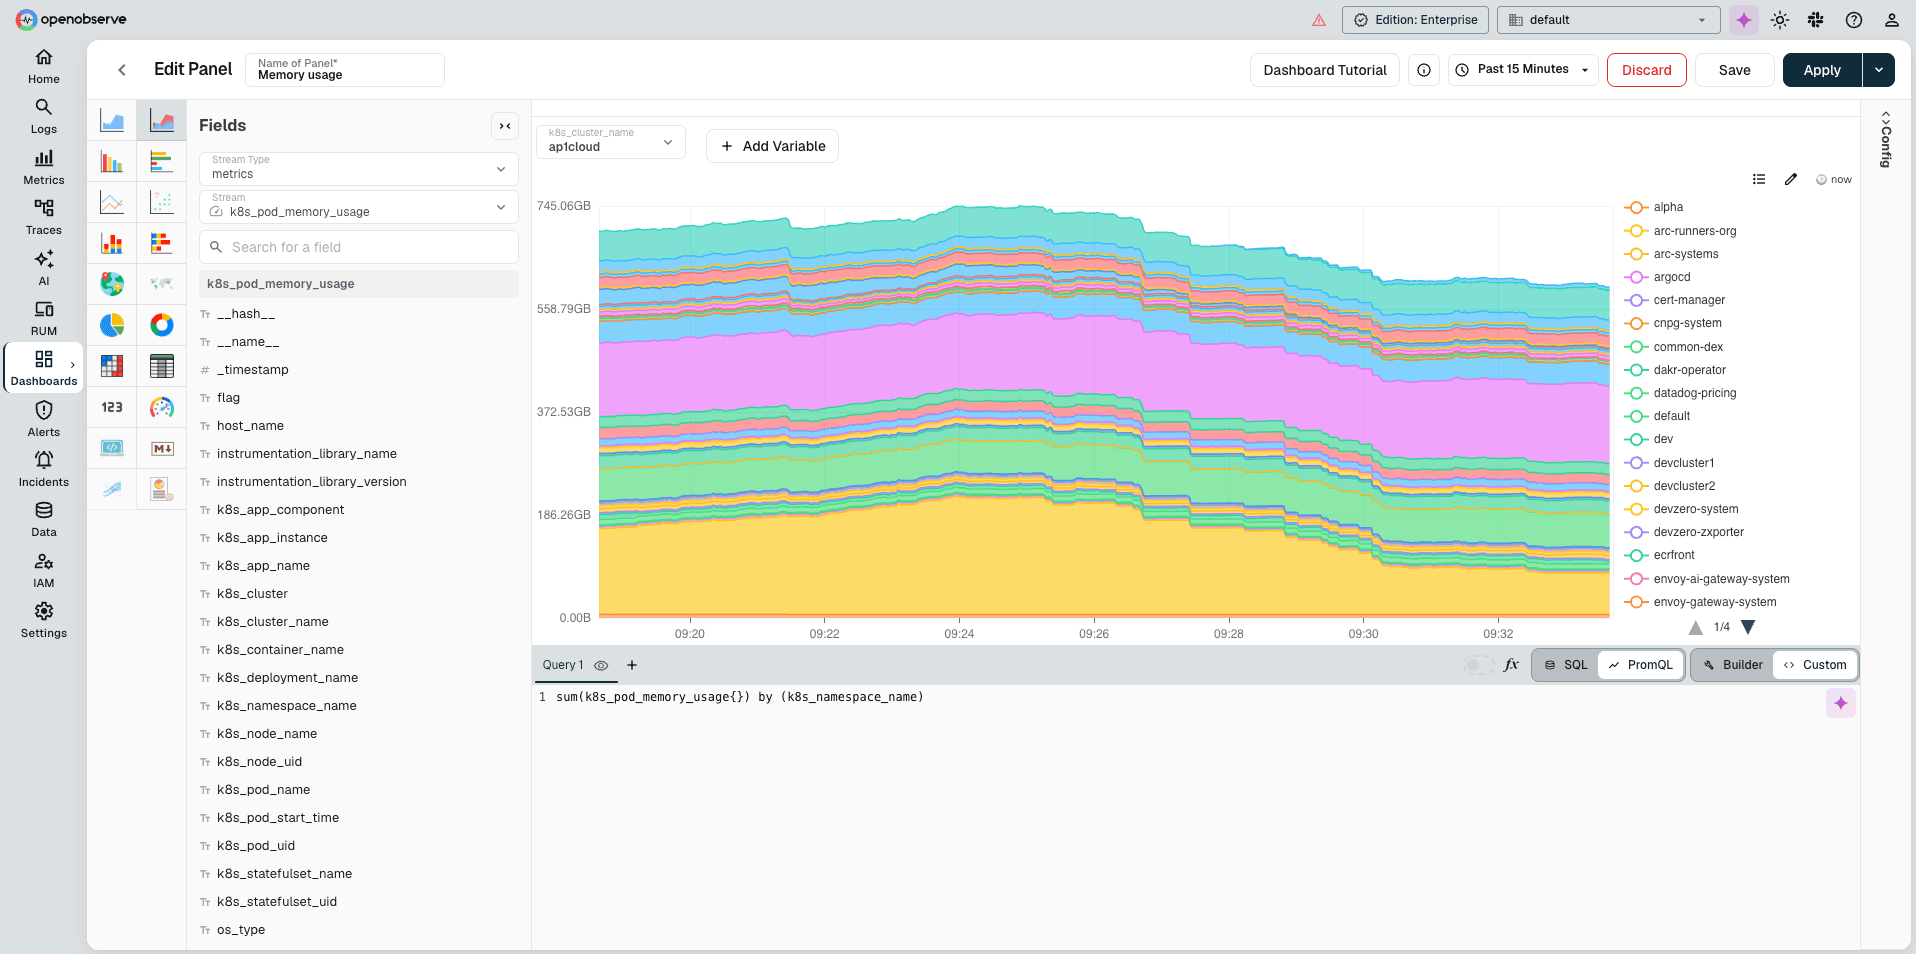
Multilingual Queries
Query metrics with either SQL or PromQL
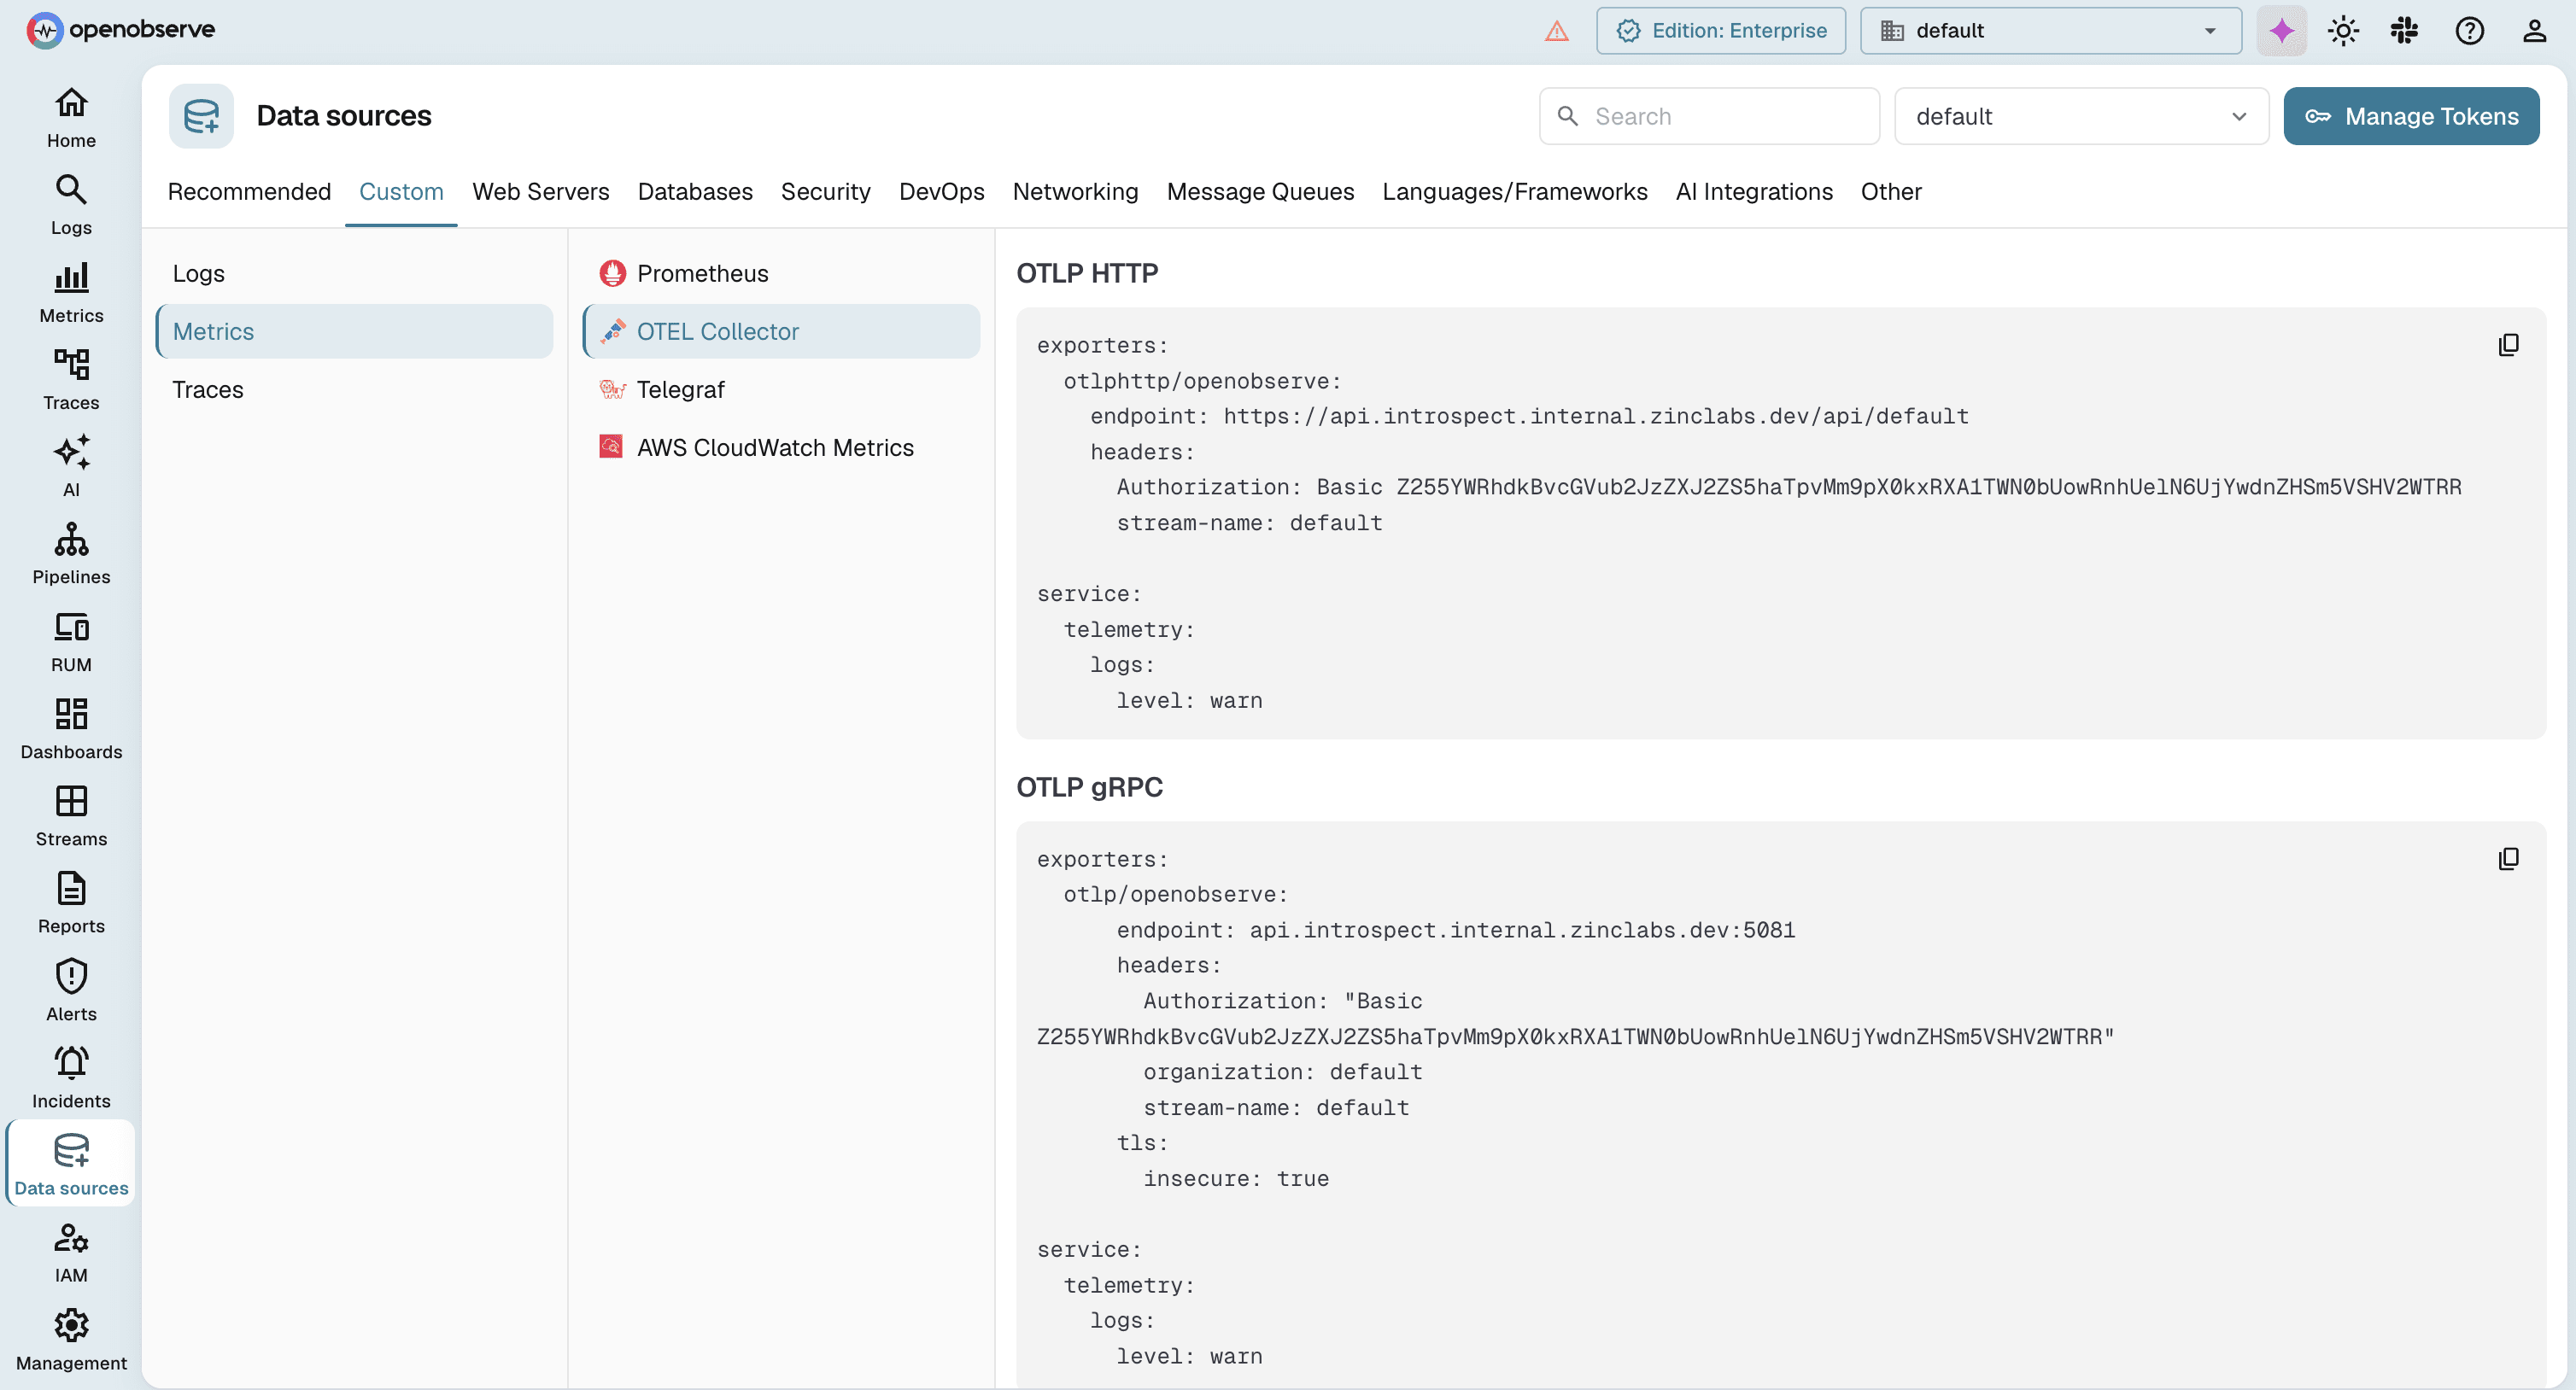
OTel-native Metrics
Standardized collection with zero vendor lock-in
OpenObserve Metrics
Efficient collection, storage, and analysis capabilities for modern, cloud-native environments.
Metrics Collection & Analysis
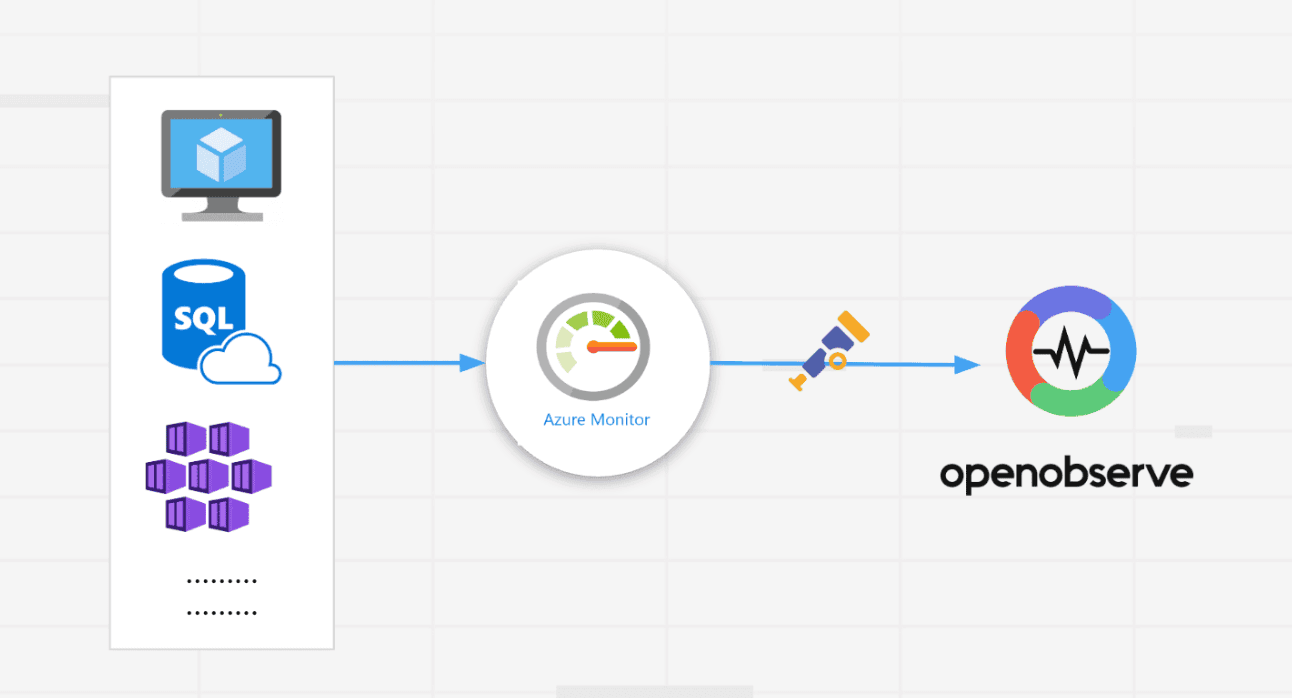
Effortless Collection
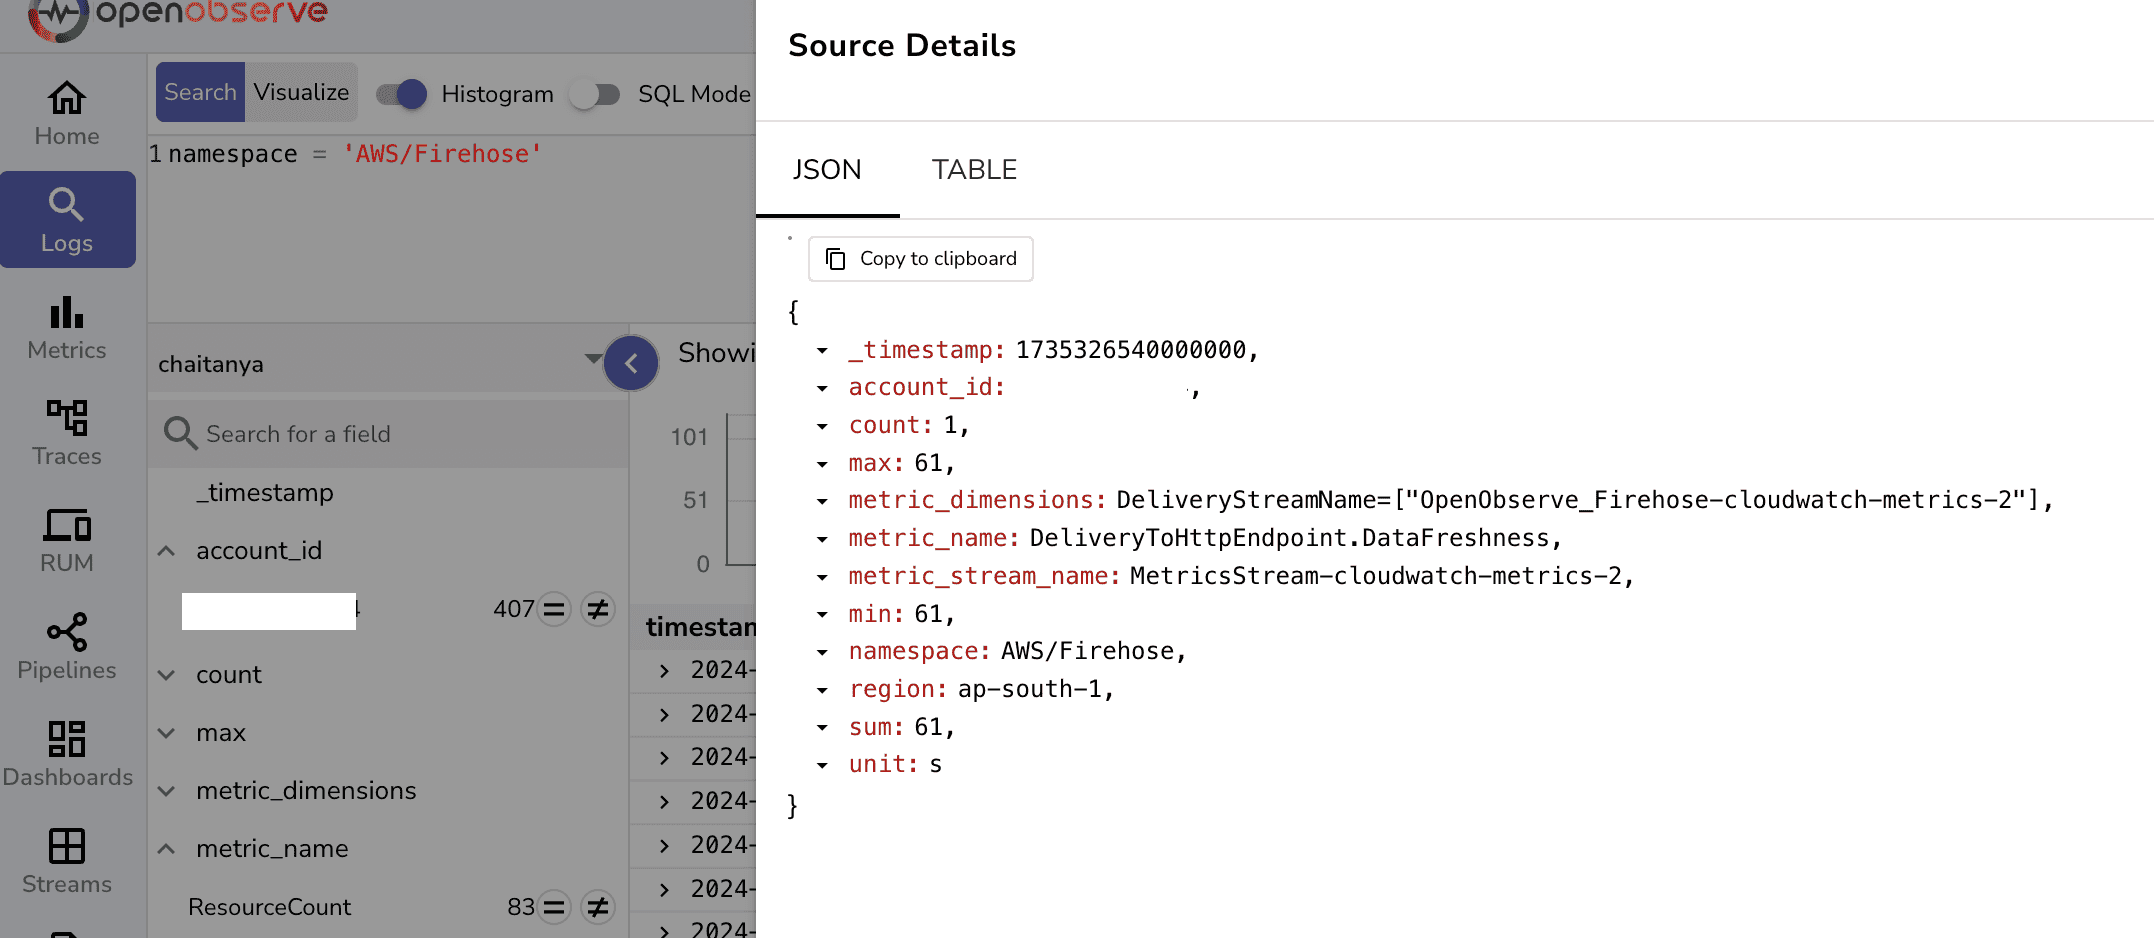
Ingest metrics from any source with minimal overhead via Prometheus remote-write, OpenTelemetry, or direct API integration.
Real-Time Insights
Visualize and analyze metrics instantly without cardinality limits, enabling immediate detection of performance trends.
Prometheus Integration
Native Compatibility
Connect with Prometheus endpoints using full remote write protocol support and your existing configurations.
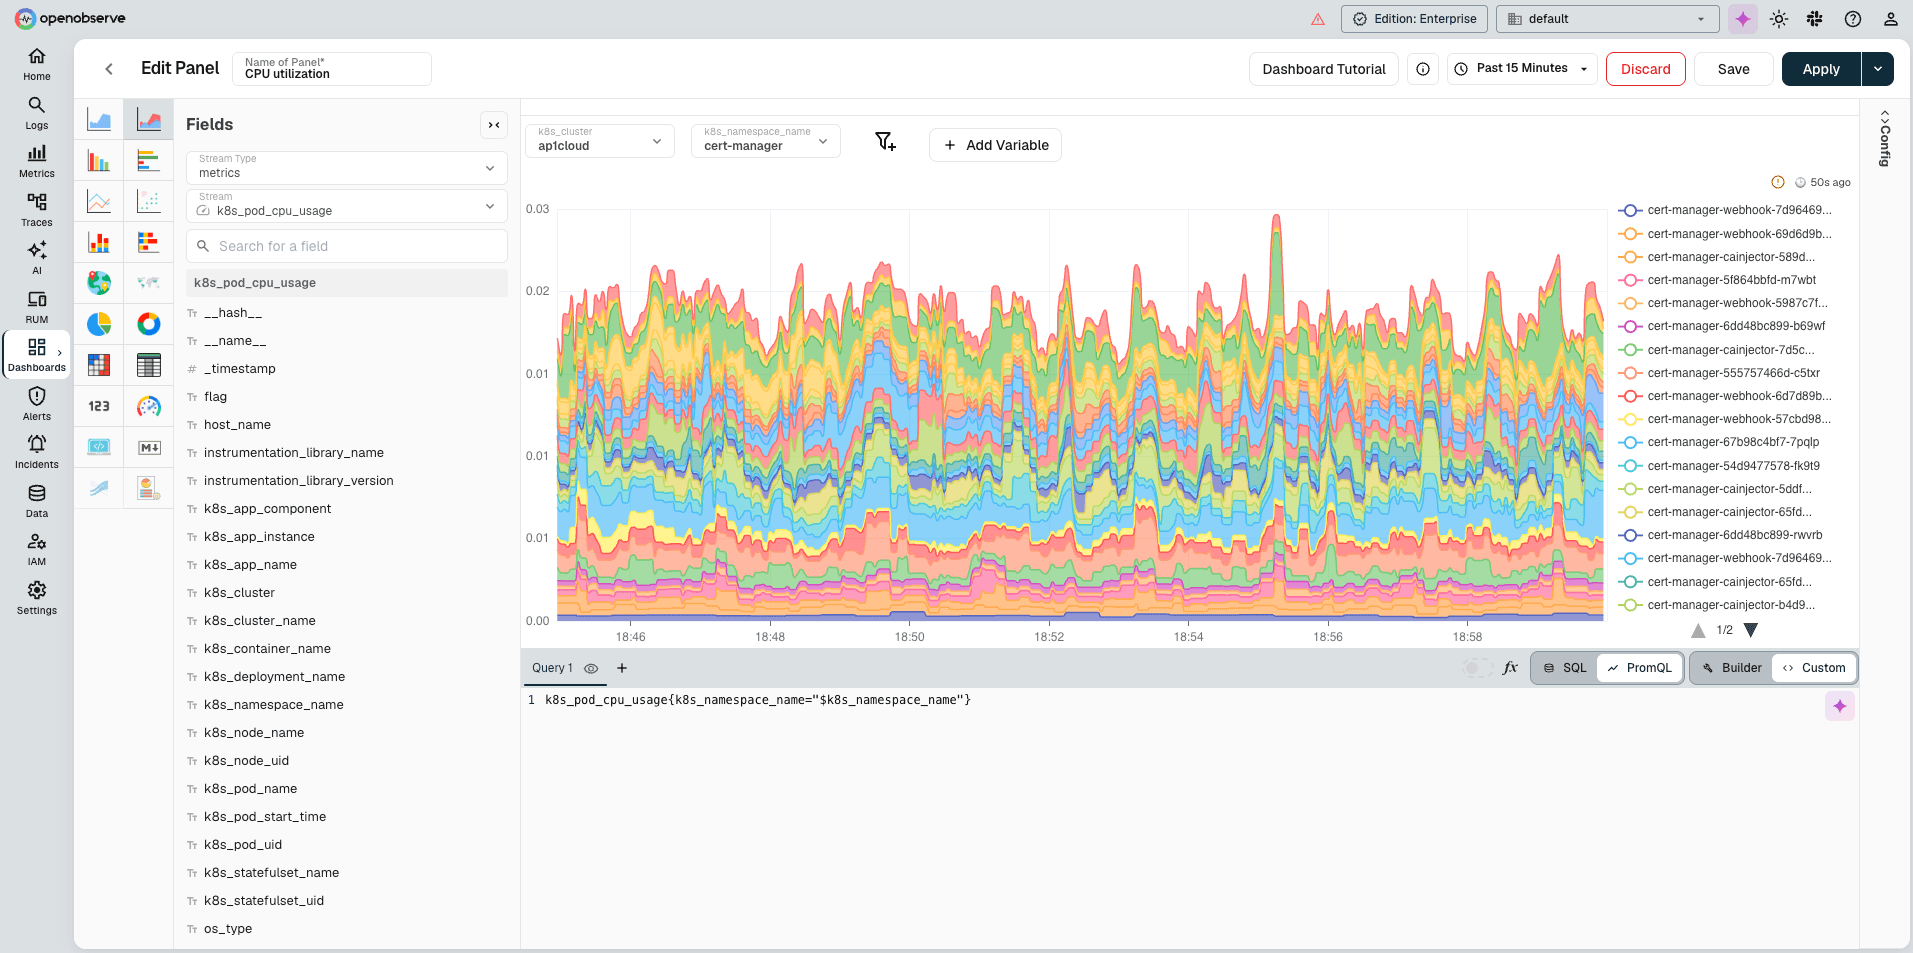
Flexible Querying
Use familiar PromQL syntax or switch to SQL - your team's expertise remains valuable without new learning curves.
Metrics Processing Advanced
Aggregations
Process time-series data with powerful calculations including rates, moving averages, and percentile analysis using either PromQL or SQL.
Downsampling
Optimize query performance for historical data through automatic downsampling of longer period requests.
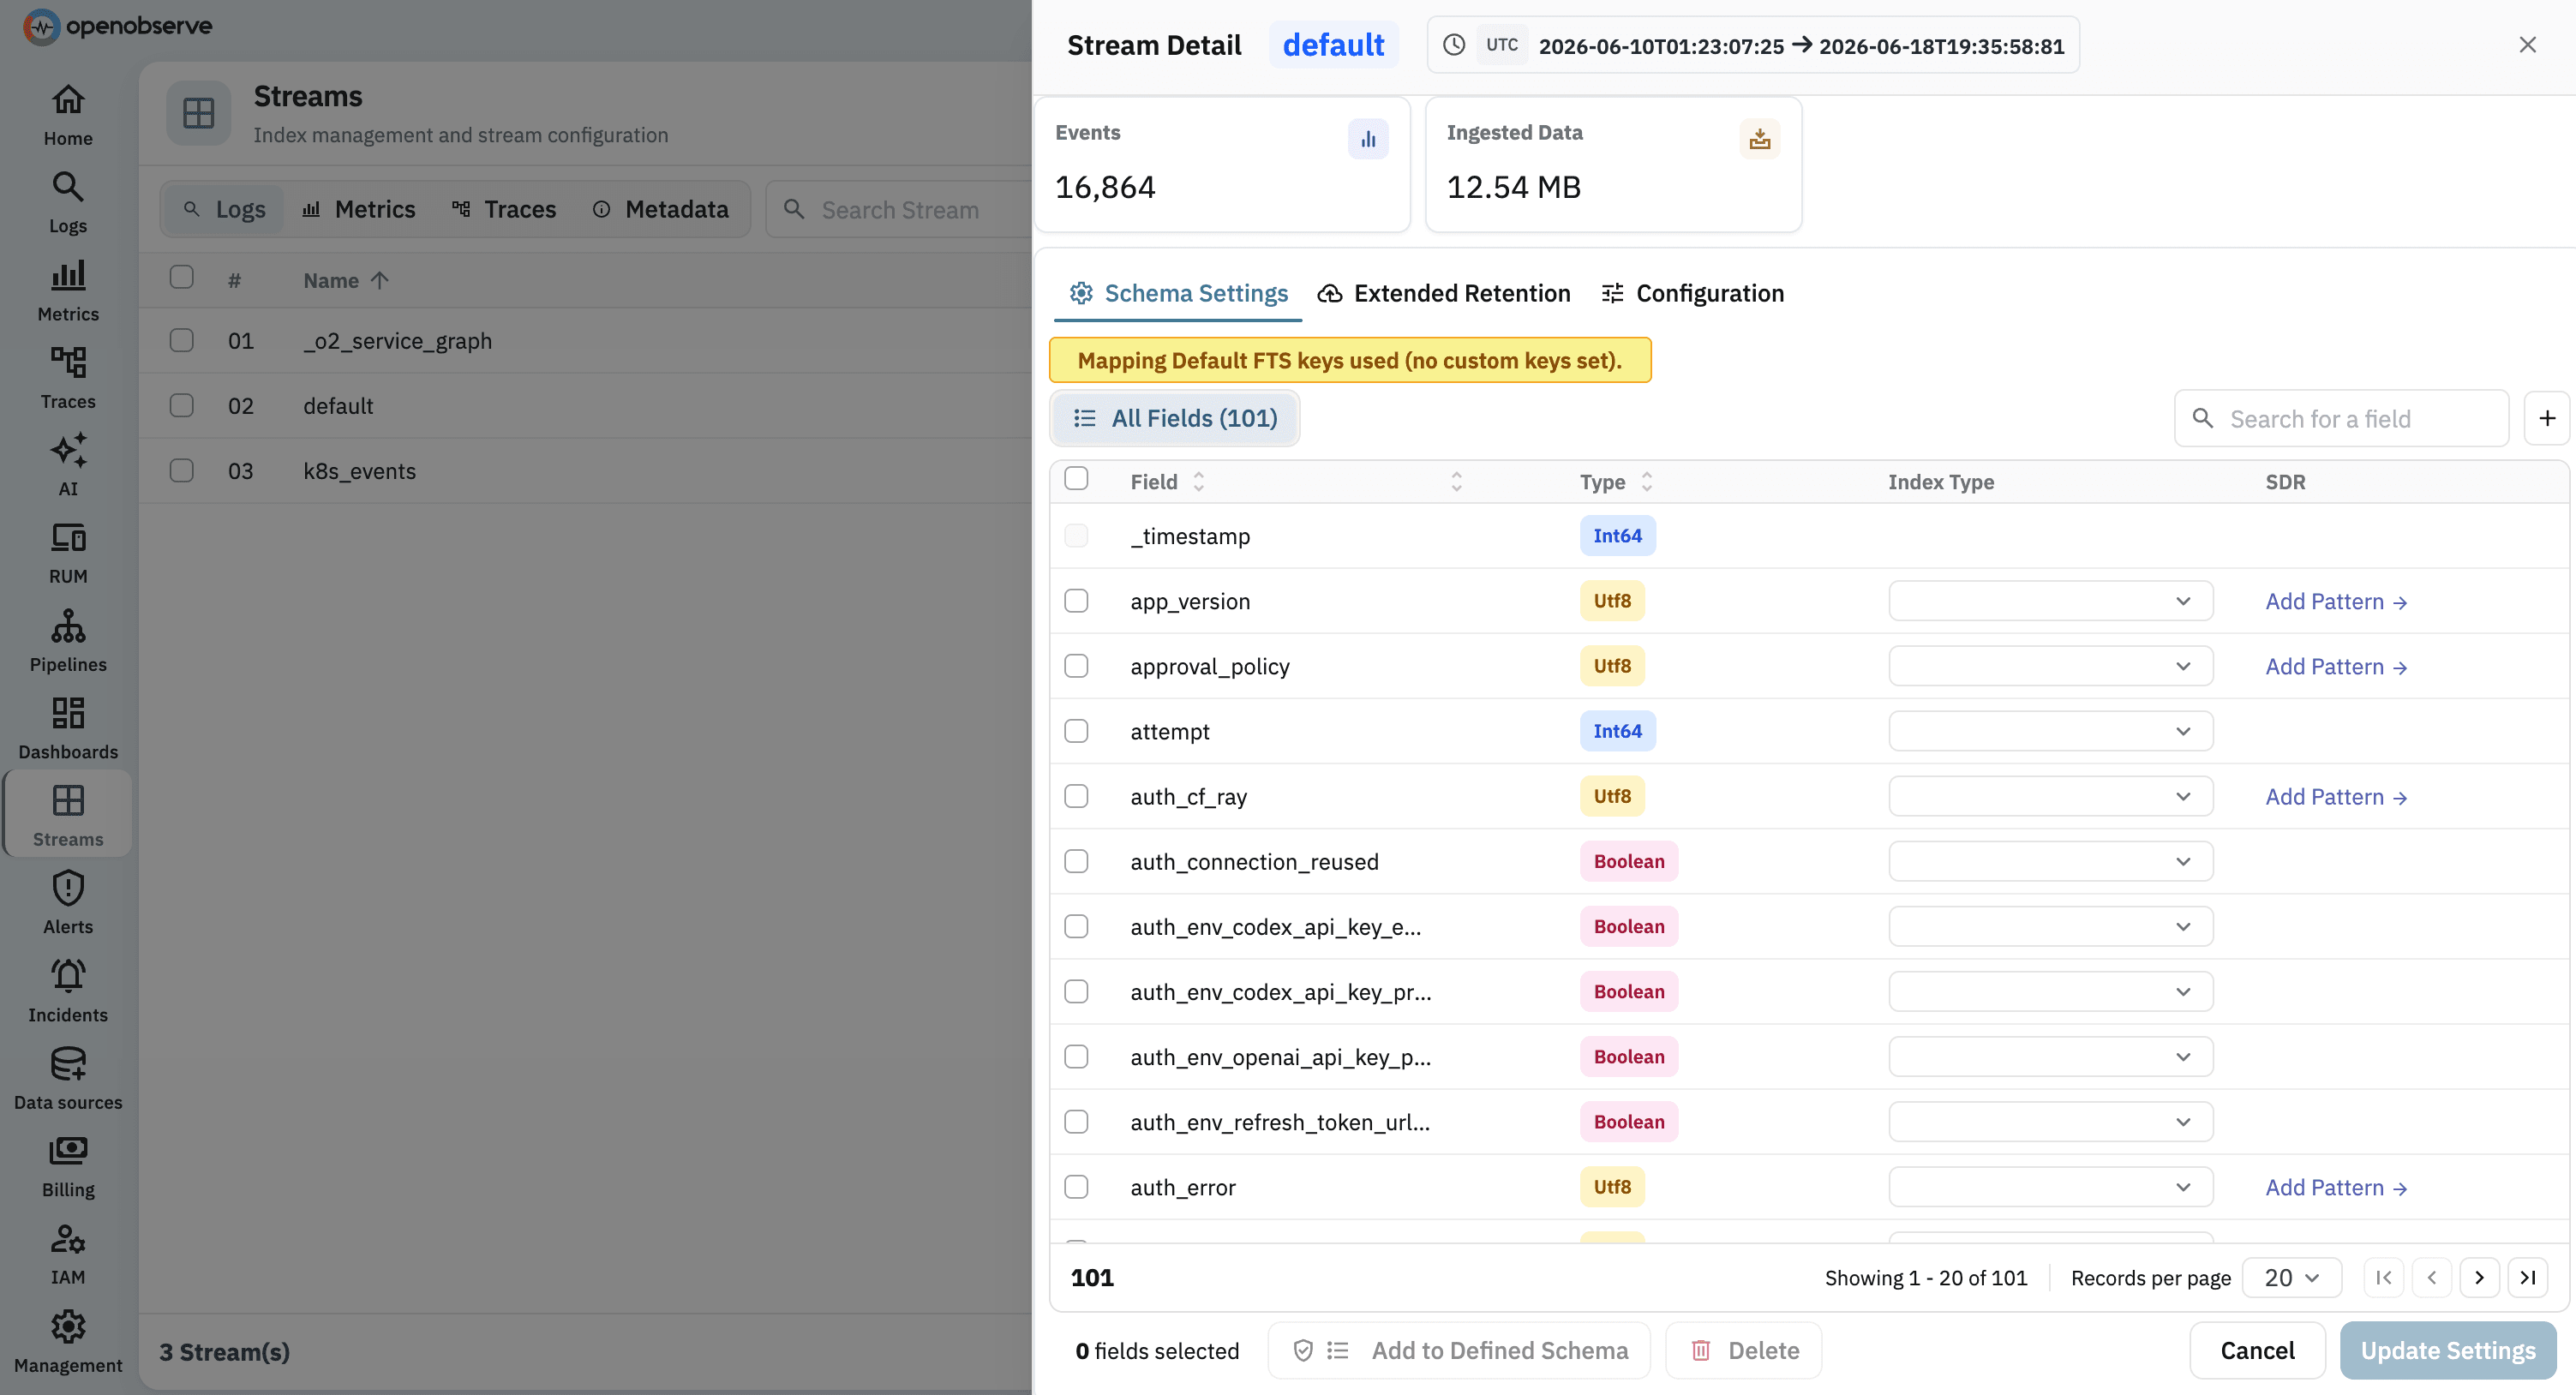
Optimized Storage
Columnar Storage
Cut storage costs while maintaining query speed through OpenObserve’s columnar format designed for time-series data.
Configurable Retention
Define custom retention periods for each data source, ensuring you keep only what you need for as long as you need it.
Metrics FAQs
Resources
Explore guides, videos, and articles to help you get the most out of Metrics.