“OpenObserve helped us migrate from Datadog in under an hour... reducing observability costs by 4x.”

4x
Lower observability cost

< 1 hour
Migrated off Datadog

Flat pricing
No month-end surprises
Drag, drop, share. Live by default.
Gain valuable insights and identify patterns from your observability data with real-time, customizable dashboards.
Identify potential problems before they impact your users.
Pinpoint exact issue sources for quicker, more accurate fixes.
Monitor systems from a single source of truth for complete visibility.
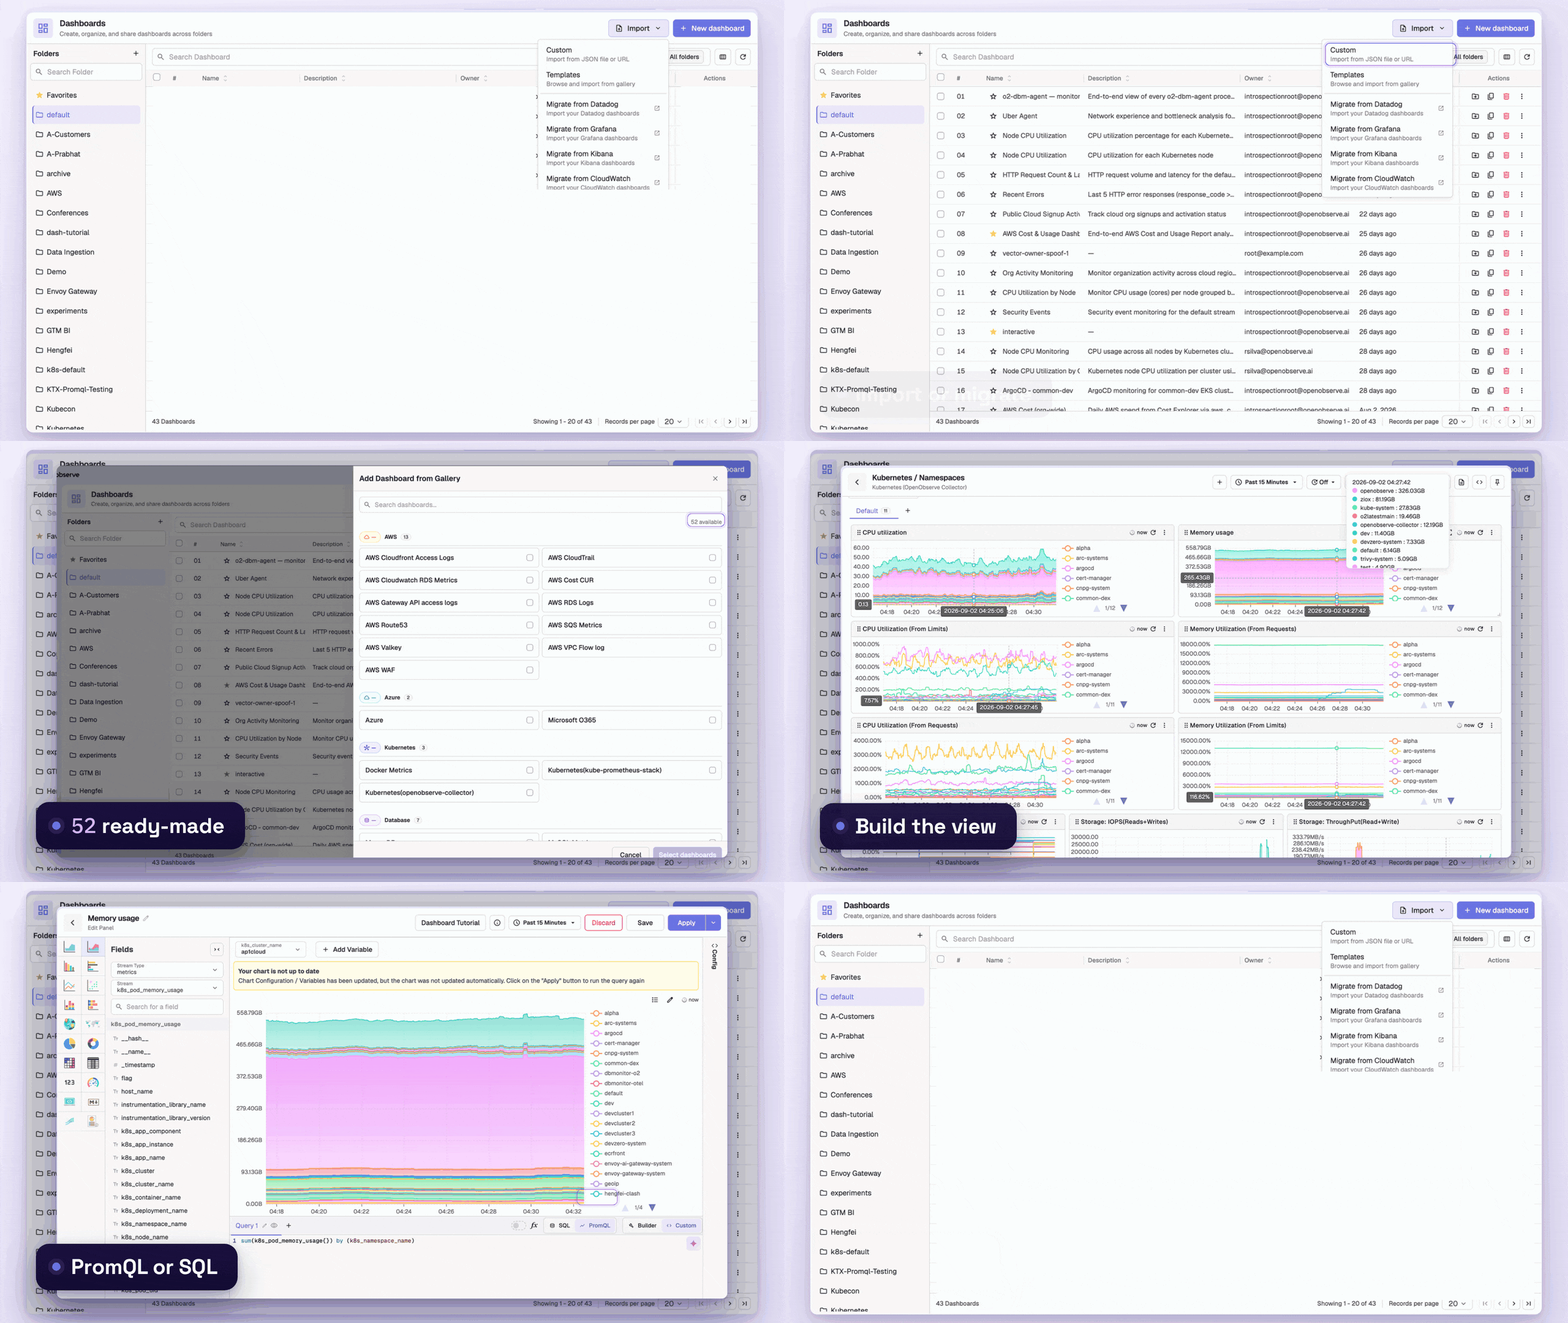
Visualize your system's heartbeat with 19+ chart types-from heat maps that expose hotspots to time-series graphs that reveal trends. Build comprehensive health views in minutes with intuitive drag-and-drop simplicity.
Stay perpetually informed with live data streams that keep you ahead of developing issues. Fine-tune refresh rates for each dashboard or panel to match your critical monitoring needs.
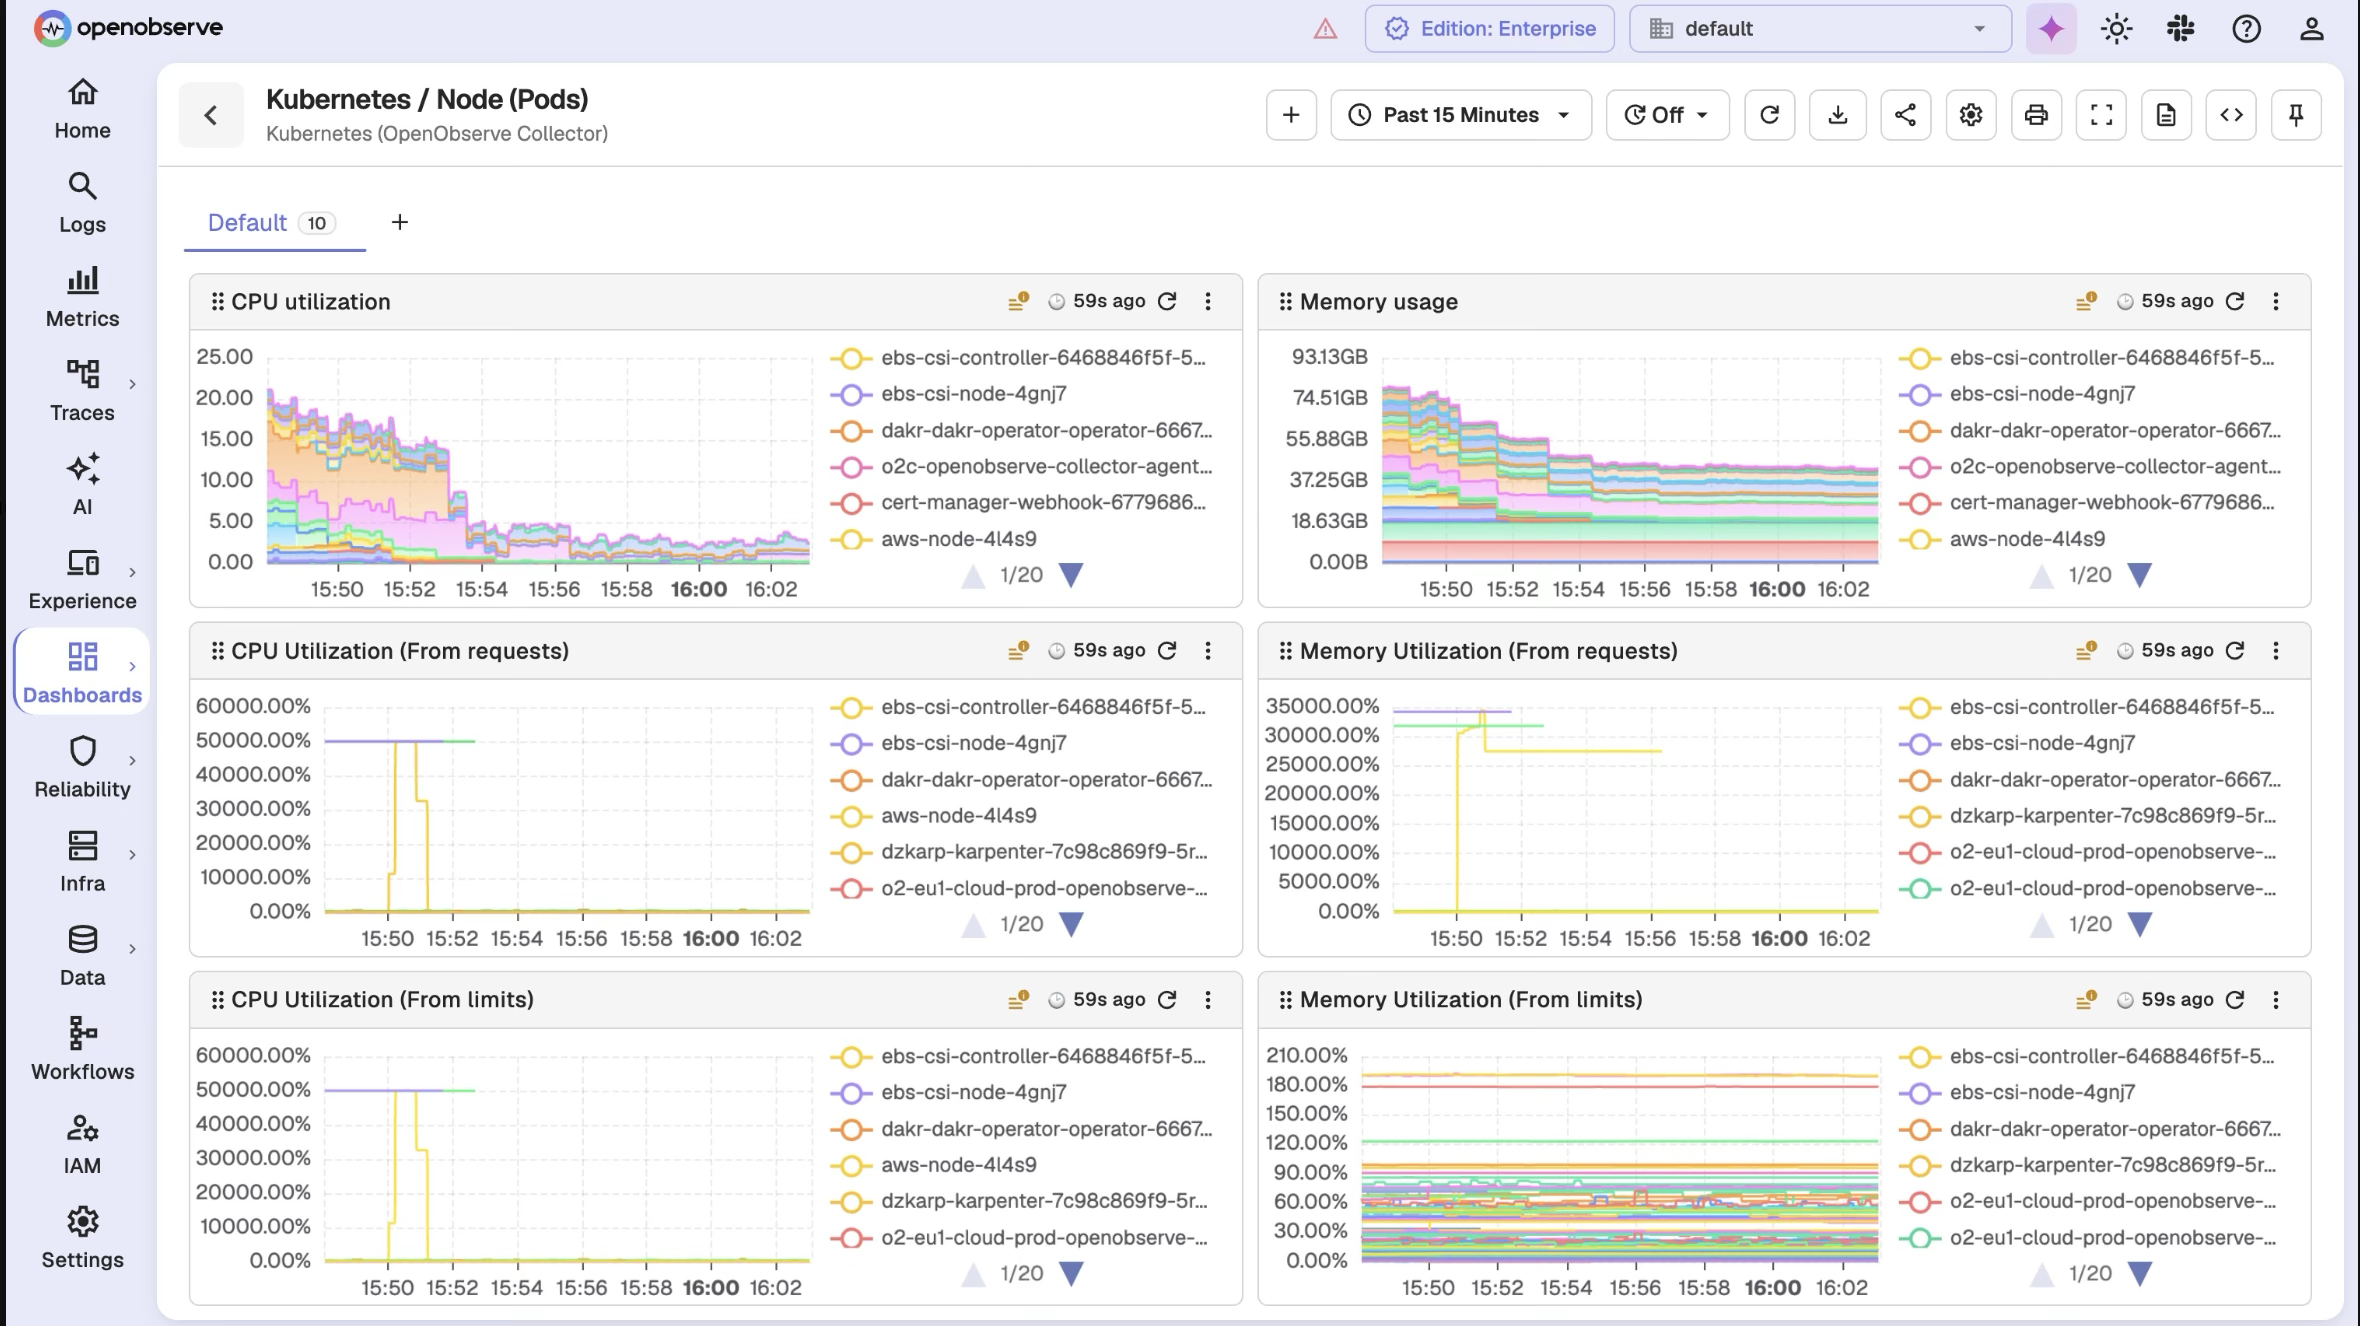
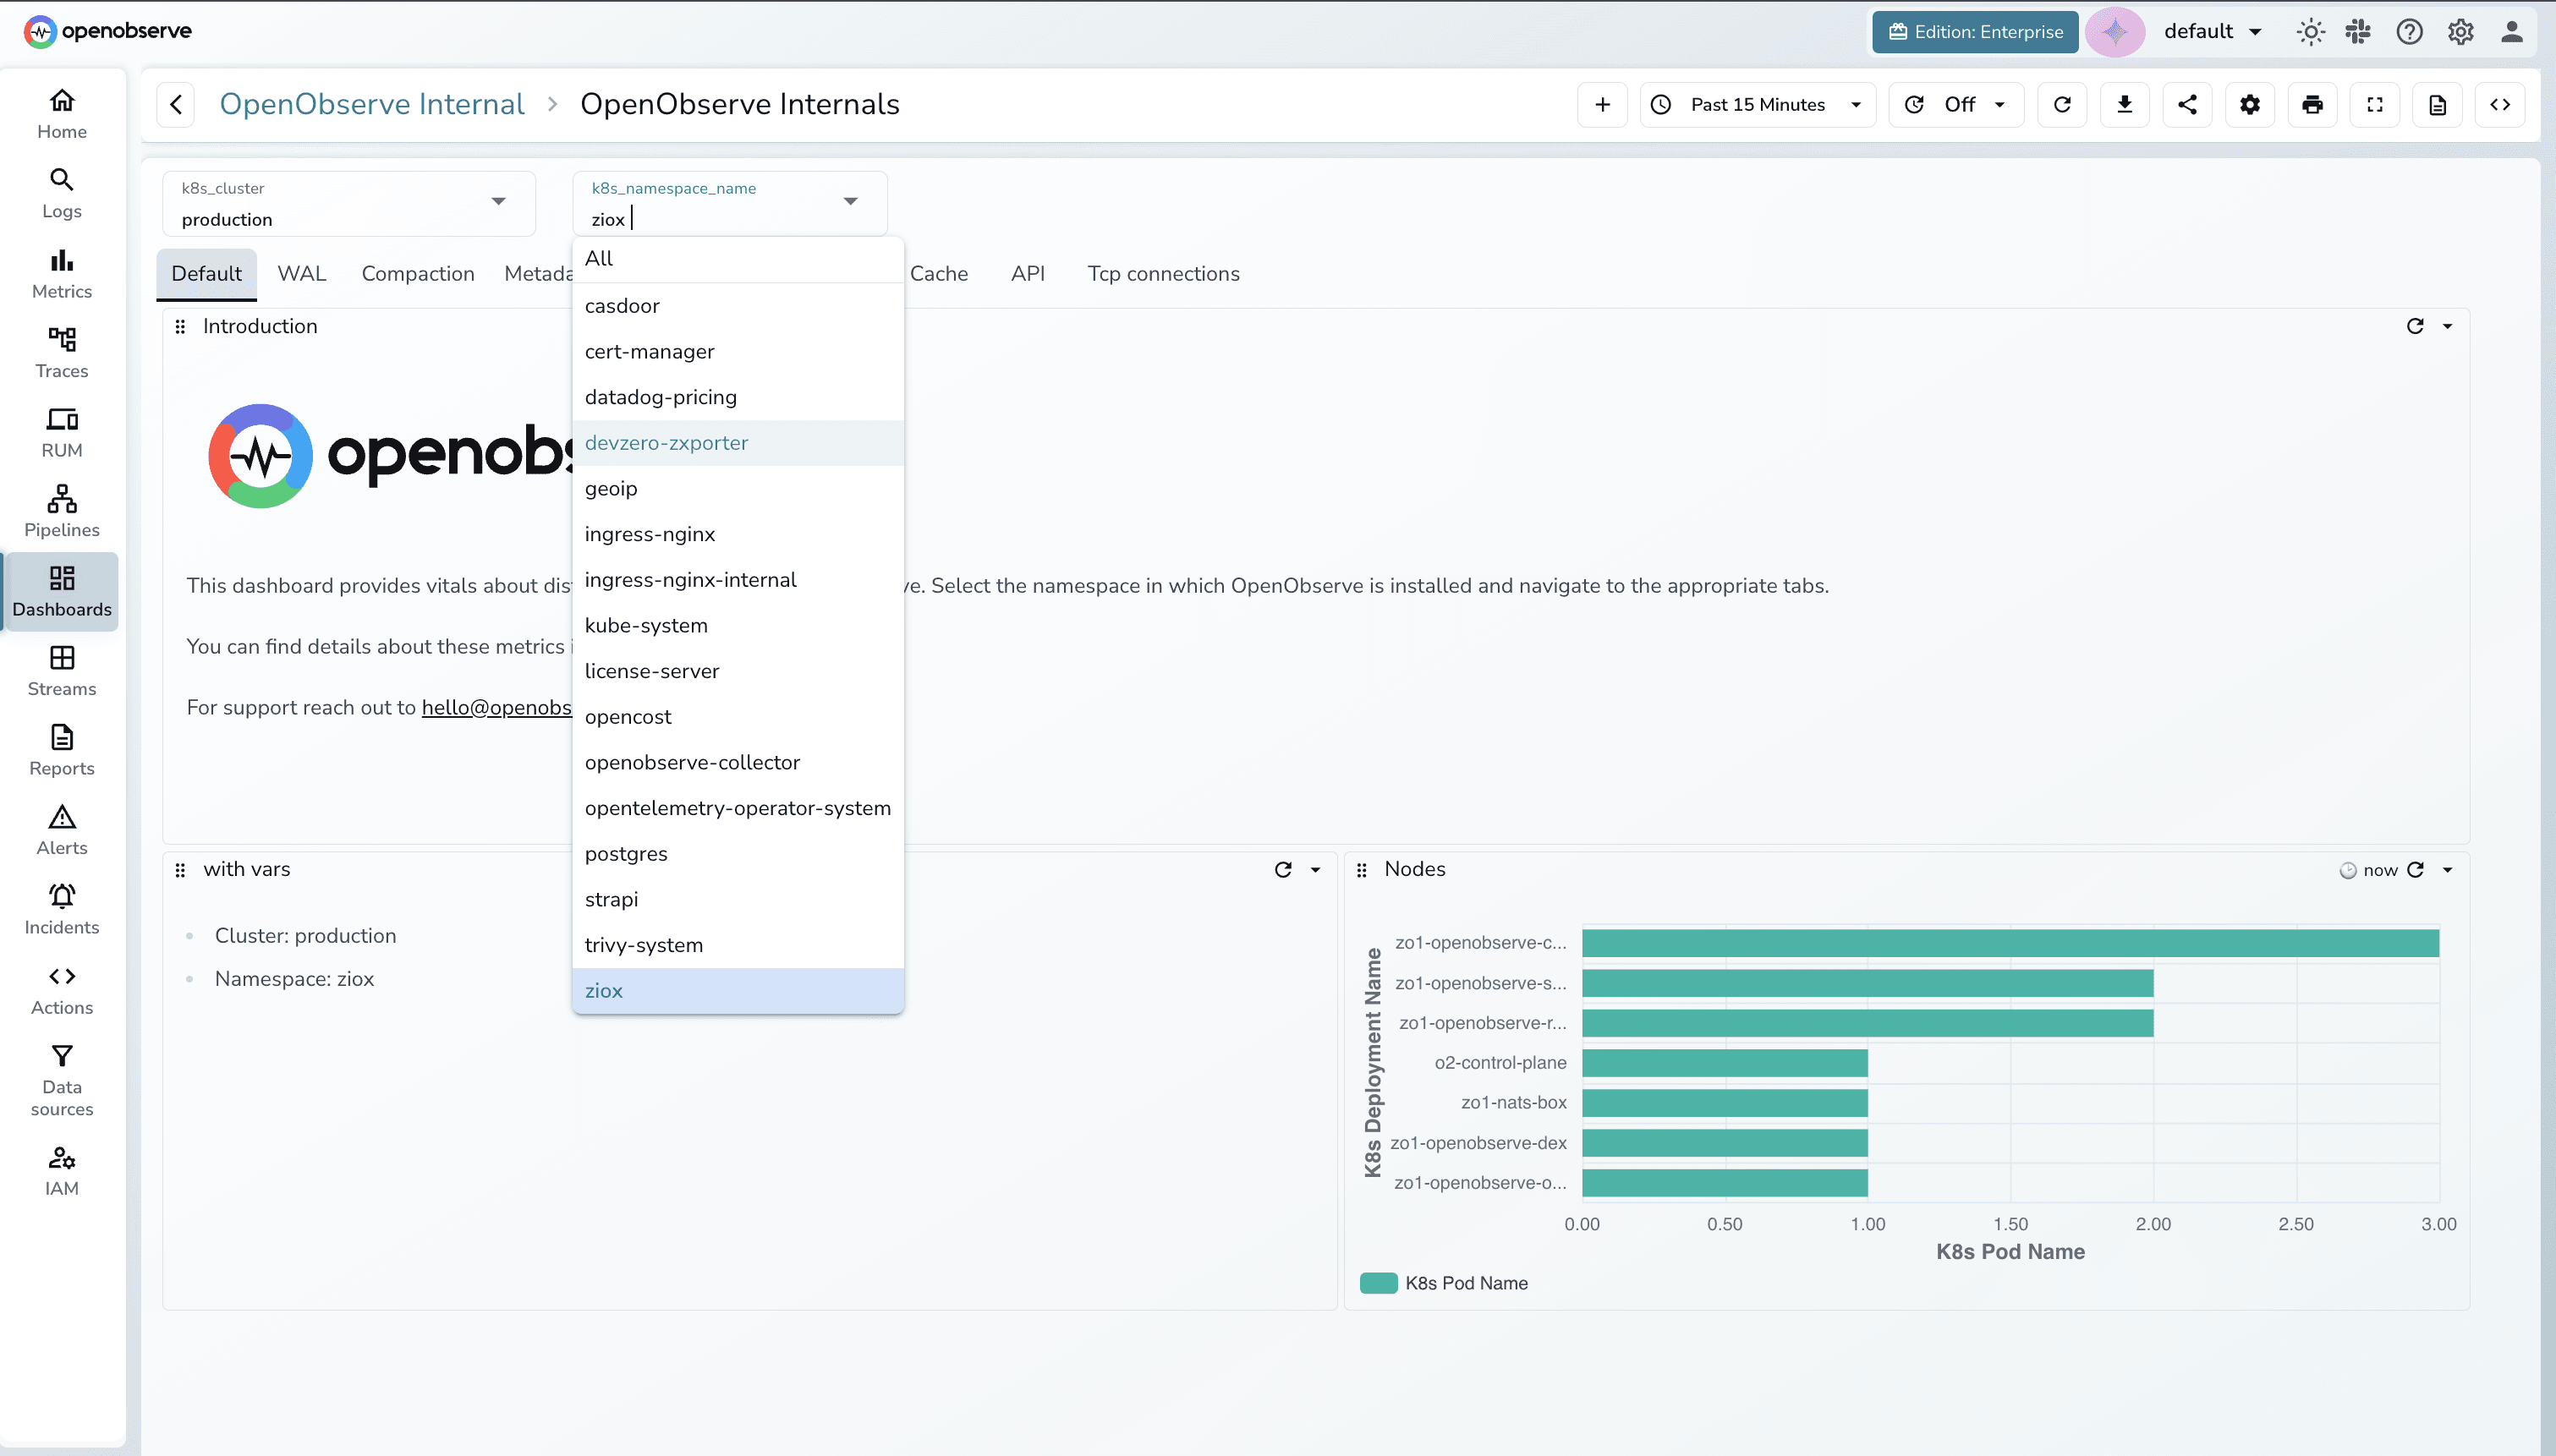
Quickly evaluate exactly what matters with powerful variable-driven dashboards. Filter multiple panels simultaneously to uncover hidden patterns and identify root causes in seconds.
Choose from 19 various out-of-the-box visualizations. Then unleash your creativity with custom charts that transform complex data into exactly the visuals your team needs-limitless possibilities await.
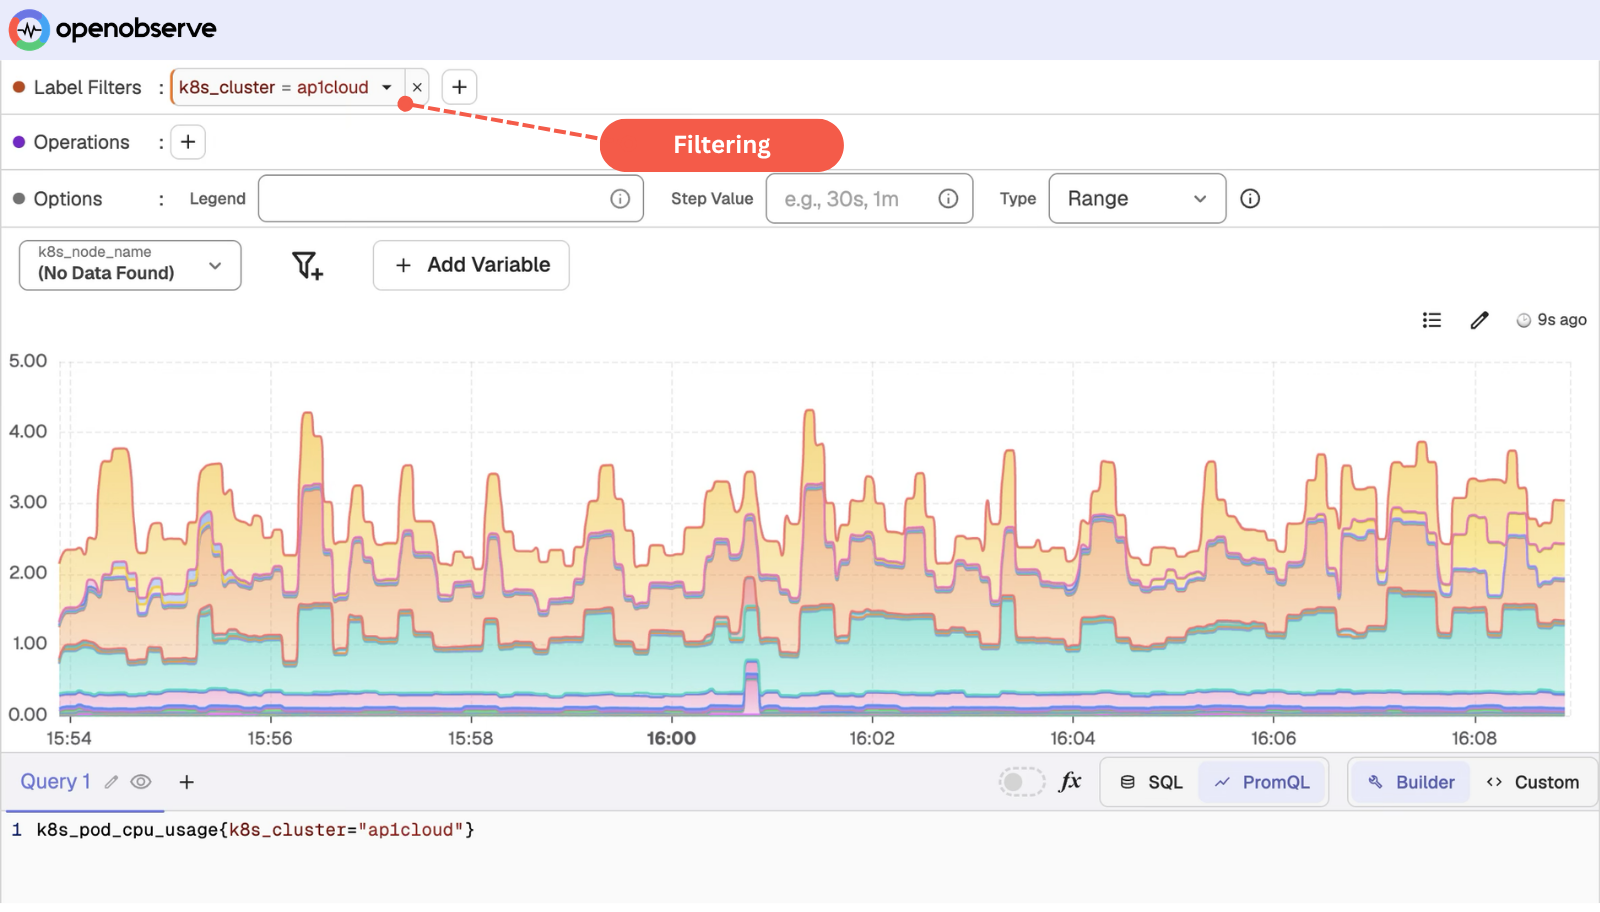
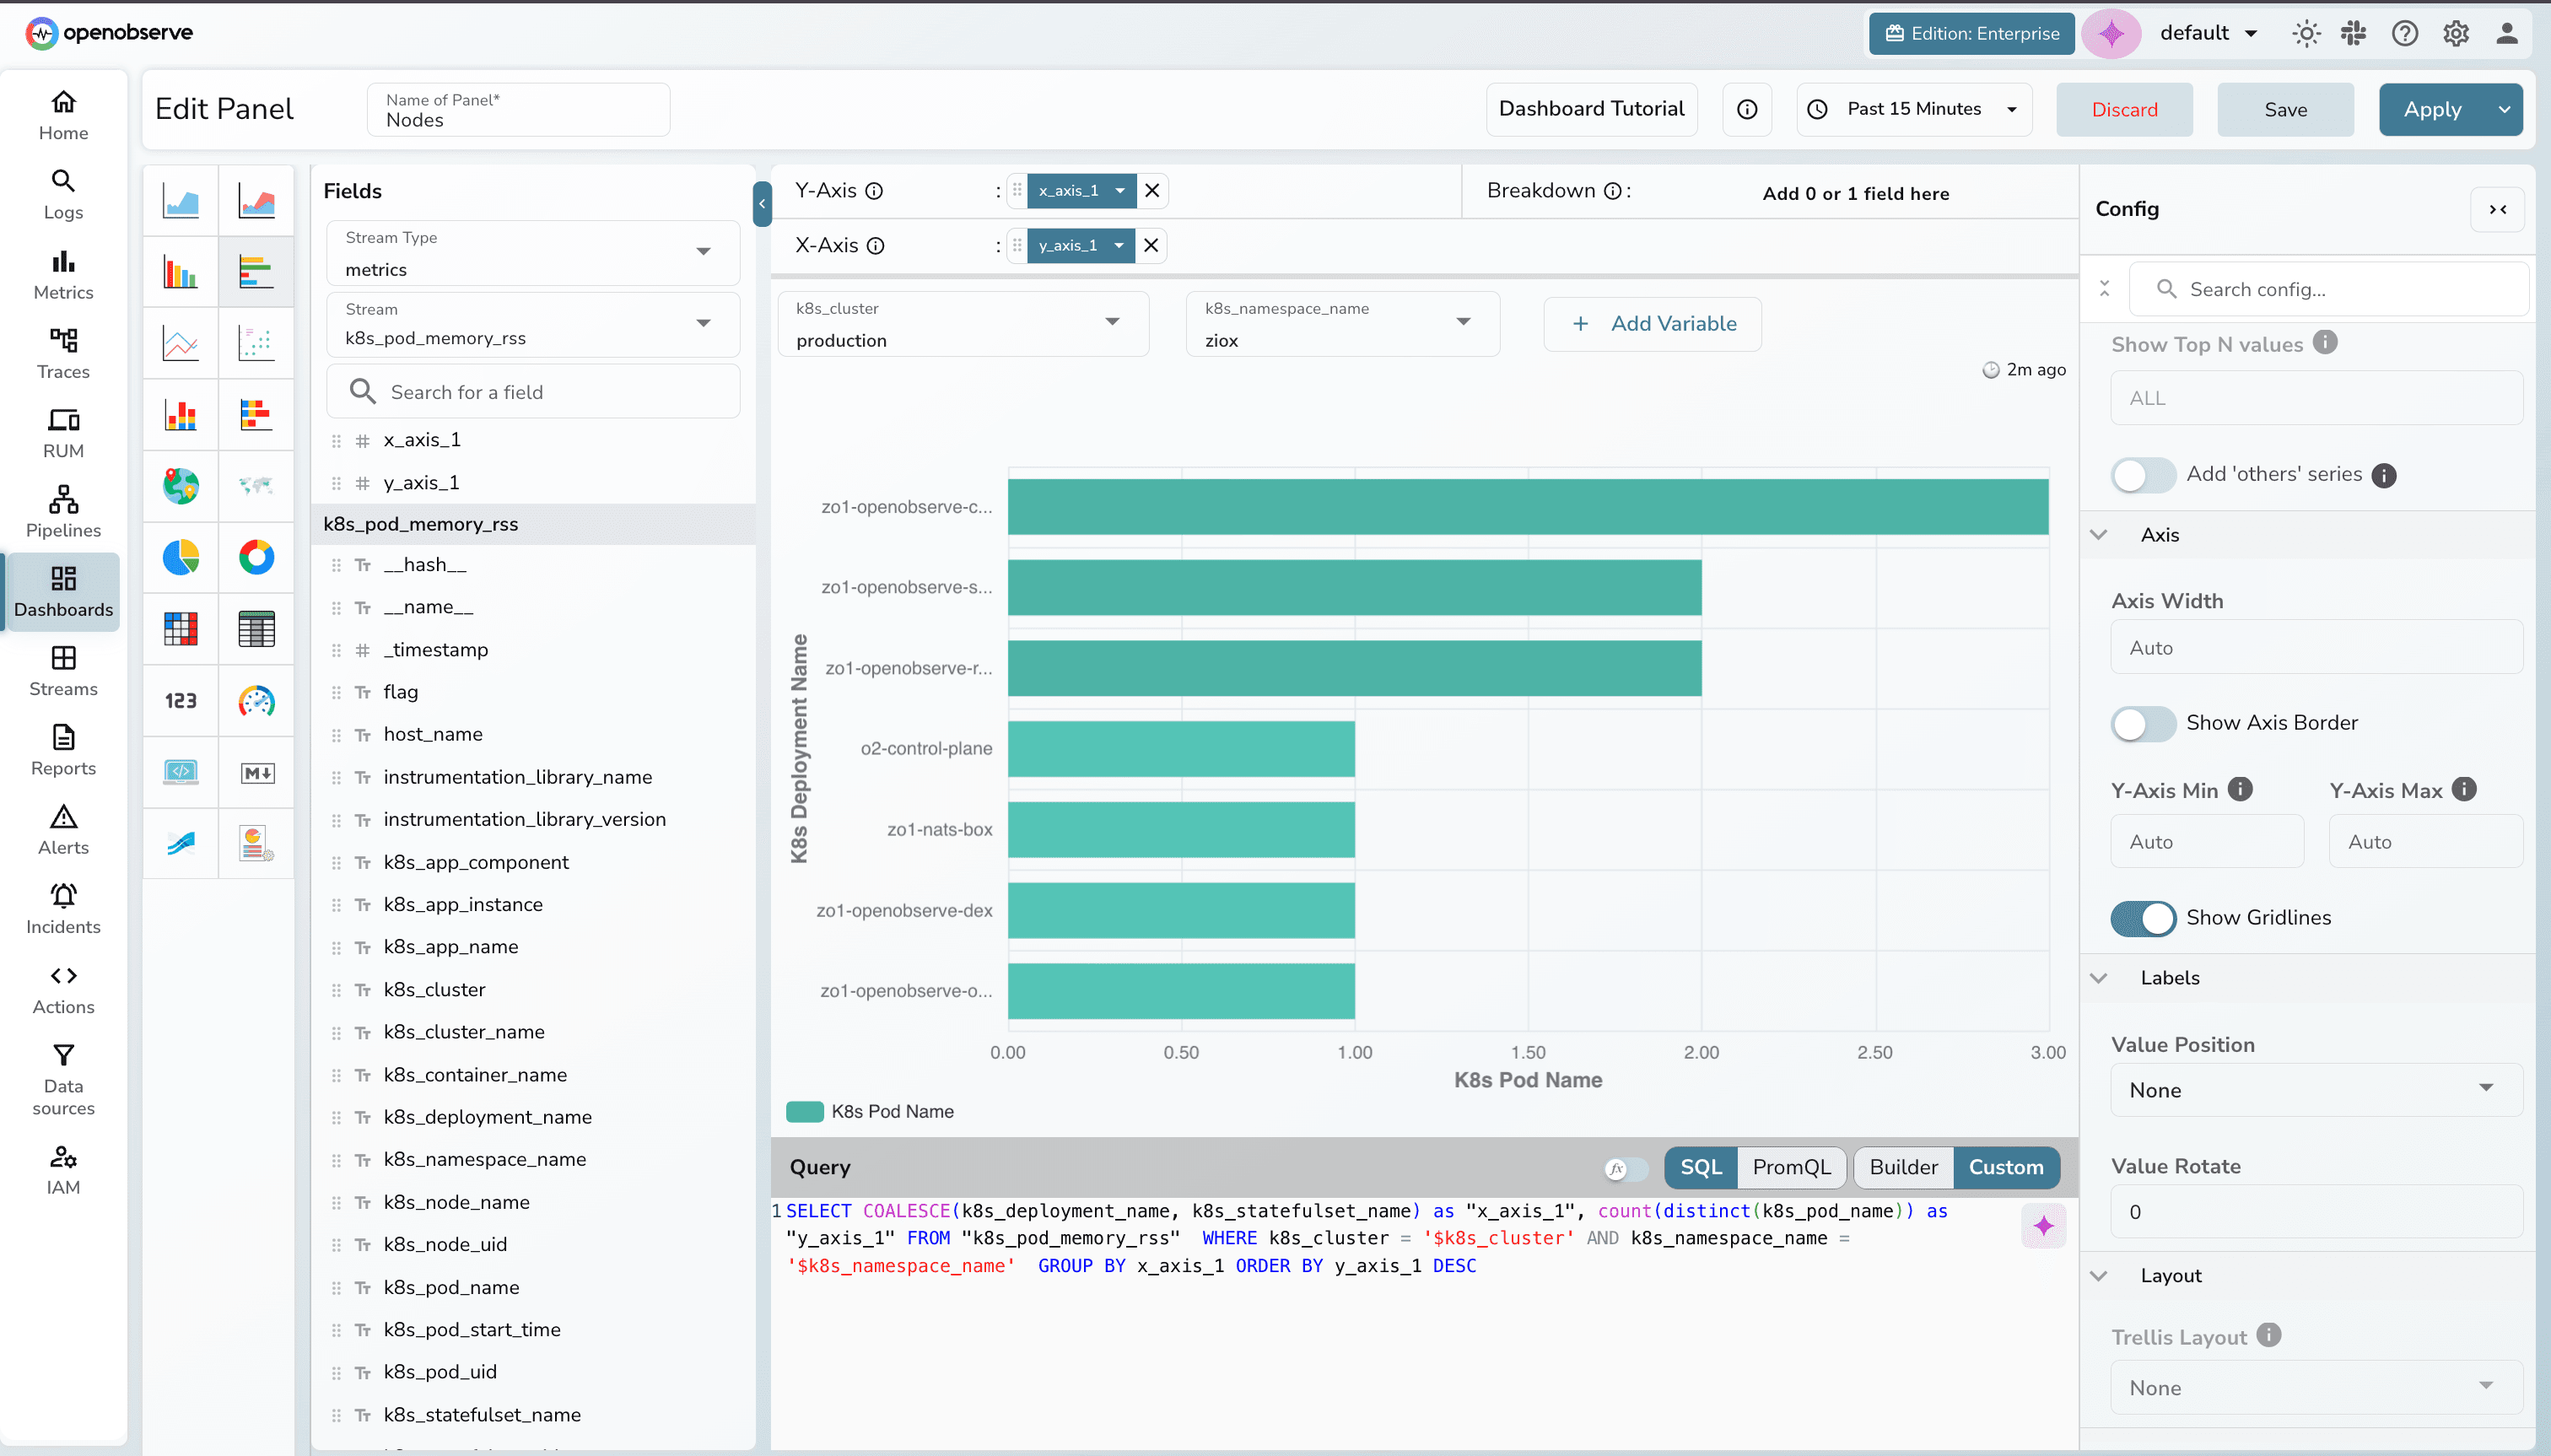
Harness the full power of SQL and PromQL to build sophisticated analyses that reveal deeper insights. Transform raw data instantly with VRL's precision-engineered functions.
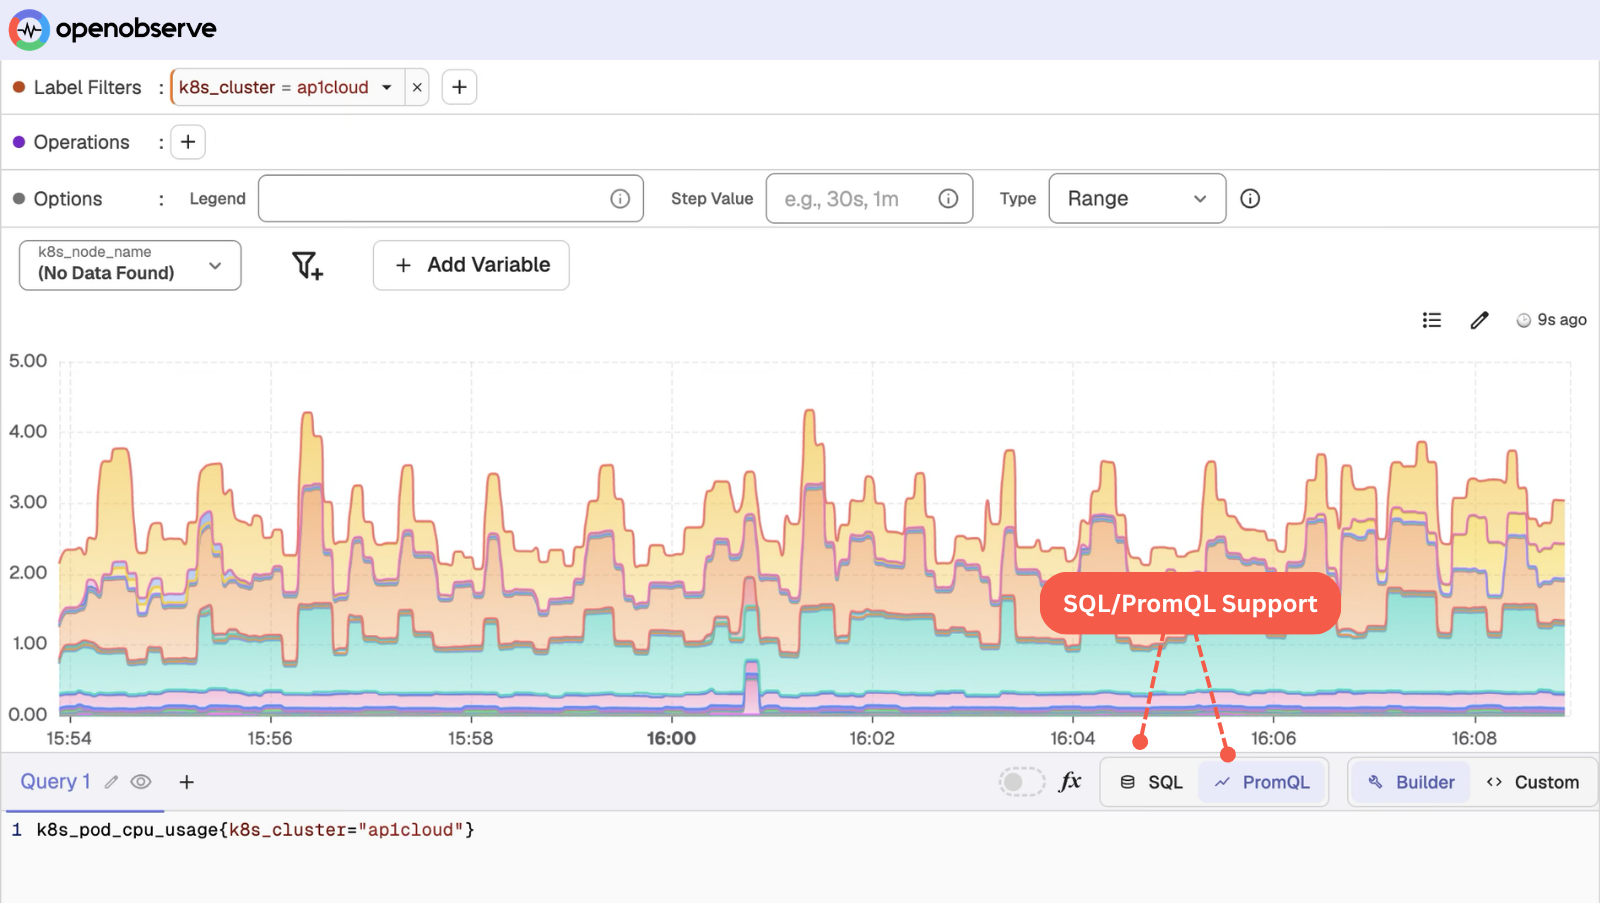
Create complex dashboards without writing a single line of code. Drag, drop, and deploy professional visualizations in minutes-no query language expertise required.
Unite your teams around critical visualizations while maintaining precise access controls. Import and export dashboards instantly-turning reliability into a true team sport.
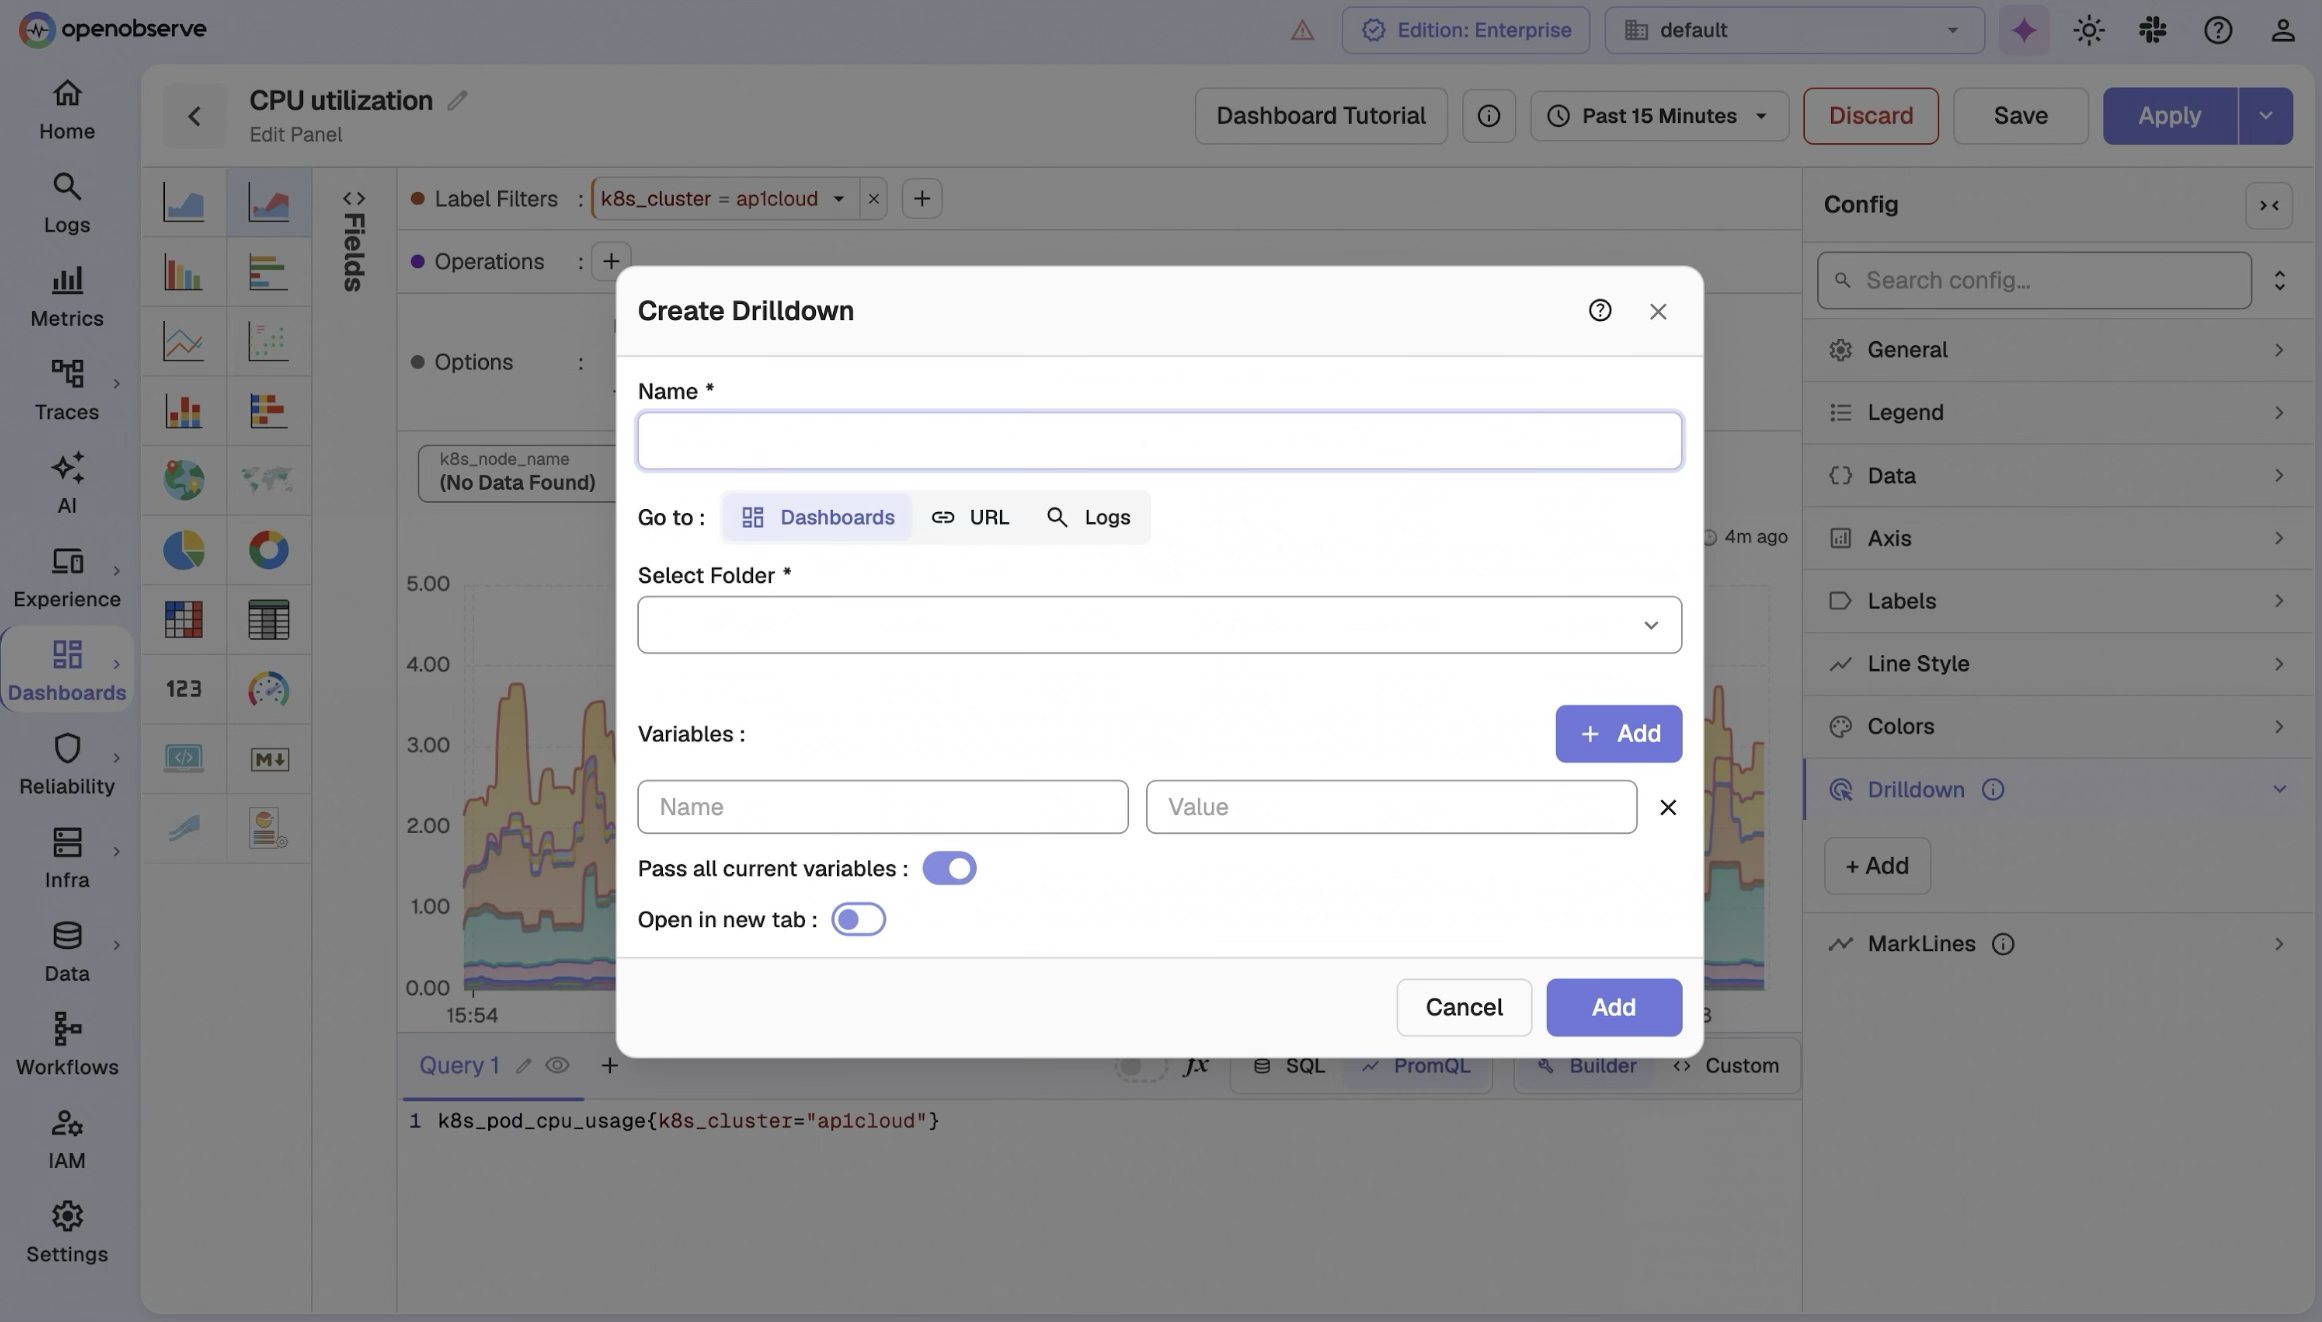
Zoom from bird's-eye metrics to granular logs without losing your place. Preserve vital context across views to cut investigation time in half and resolve issues before they escalate.
Same telemetry, same workloads, one platform. Every number is OpenObserve against a named vendor - not an industry average.
vs. Datadog
8×
more cost-effective
8x cost reduction means you can unify your observability into a single platform.
Read case studyvs. Elastic
140×
storage efficiency
140x storage means longer retention doesn't necessarily mean expensive bills.
Read case studyvs. Grafana stack
5–15×
faster performance
5x to 15x faster queries mean dashboards load in milliseconds, not minutes.
Read case studySee how much you would save switching today.
Correlate between the environments and signals across various sources with OpenObserve built-in correlation engine.
“OpenObserve helped us migrate from Datadog in under an hour... reducing observability costs by 4x.”
4x
Lower observability cost
< 1 hour
Migrated off Datadog
Flat pricing
No month-end surprises
to help you get the most out of Dashboards.
Try OpenObserve today for more efficient and performant observability.

AI Observability by OpenObserve
OpenTelemetry-native observability for agents and LLMs.