









Bring your own shipper
Ship logs with what you already run
Vector, Fluent Bit, Fluentd, Filebeat, Logstash, Telegraf, Kinesis - point them at OpenObserve over OTLP, the Elasticsearch bulk API, or syslog. No rip-and-replace.
OpenObserve ships 100+ OpenTelemetry-native integrations covering frontend, AI and LLM frameworks, APIs, applications, databases, networks, and cloud infrastructure. Logs, metrics, and traces from every layer of your stack land in one place, and because ingestion is OTLP-first, any tool that emits OpenTelemetry works today without a proprietary agent.

16 of 168 shown
Namespace, node, and storage metrics.
nosql-dbLightweight agent framework, traced end to end.
ai-frameworksTrace foundation-model invocations.
llm-providersTrace Bedrock agent orchestration.
ai-frameworksMulti-agent Bedrock traces per action group.
ai-frameworksEdge access logs at global scale.
awsAuth events and sign-in logs.
awsThrottles, capacity, and latency.
nosql-dbInstance logs and host-level metrics.
awsContainer task logs and metrics.
awsCapture and route event-bus traffic.
awsSlow queries and engine metrics.
awsNetwork flows for cost and forensics.
awsAI gateway routing, fully traced.
ai-gatewaysPlaybook runs and task results.
ci-cdTypeScript-first Claude tracing via OTel.
llm-providersOpenObserve speaks OpenTelemetry and Prometheus remote-write, and pulls your AWS services telemetry in directly through CloudWatch. If your tool emits OTLP, it ships to OpenObserve today. No proprietary agent, no waiting on a connector.
Vector, Fluent Bit, Fluentd, Filebeat, Logstash, Telegraf, Kinesis - point them at OpenObserve over OTLP, the Elasticsearch bulk API, or syslog. No rip-and-replace.
Instrument once with OpenTelemetry SDKs and send every signal to a single OTLP endpoint - no proprietary agent, no lock-in, full context across your stack.
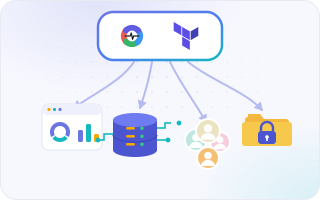
Define your OpenObserve setup with the Terraform provider - version-controlled, reviewed in pull requests, and reproducible across every environment.

AI Observability by OpenObserve
OpenTelemetry-native observability for agents and LLMs.