DataDog vs OpenObserve Part 6: Real User Monitoring - Session Replay, SQL Analytics, Core Web Vitals




Ready to get started?
Try OpenObserve Cloud today for more efficient and performant observability.
DataDog vs OpenObserve Part 6: Real User Monitoring - Session Replay, SQL Analytics, Core Web Vitals
We tested DataDog and OpenObserve as Real User Monitoring platforms for production web applications. The results show how these platforms differ in query flexibility, correlation capabilities, error analysis, and operational workflows for understanding user behavior and debugging frontend issues.
OpenObserve transforms the fundamental question from "can we afford to monitor this?" to "what do we need to monitor?" The platform provides comprehensive system visibility without cost-driven compromises.
Beyond basic RUM capabilities, query language and data analysis flexibility matter. SQL support for user analytics, correlation with backend telemetry through unified queries, and programmatic data access directly impact how teams debug production issues and optimize user experience.
This hands-on comparison tests capabilities across both platforms: session tracking, performance monitoring, error detection, query flexibility, and full-stack correlation.
This is Part 6 in a series comparing DataDog and OpenObserve for observability (security use cases excluded):
- Full comparison
- Part 1: Logs - Automatic Field Discovery, SQL Queries, and 90% Cost Savings
- Part 2: Metrics - Drag & Drop, SQL, PromQL, High Cardinality
- Part 3: Traces/APM - OTel Native, No Hidden Tiers
- Part 4: Dashboards - Prebuilt, Drag & Drop, Custom
- Part 5: Alerts, Monitors, Destinations
- Part 6: Real User Monitoring
- Part 7: Pipelines
- Part 8: IAM SSO, RBAC
- Part 9: Cost
TL;DR: 8 Key Findings
- Query Languages: DataDog uses proprietary RUM Explorer syntax. OpenObserve supports SQL for complex user behavior analysis, conversion funnels, and business metric correlation.
- Backend Correlation: DataDog correlates through UI tabs. OpenObserve uses SQL joins to query across RUM, logs, metrics, and traces in a single query.
- Performance Monitoring: Both track Core Web Vitals (LCP, INP, CLS). DataDog provides out-of-the-box optimization dashboards. OpenObserve provides SQL-based custom analysis with programmatic export.
- Session Replay: Both provide session replay with privacy masking (
mask,mask-user-input,allow). Feature parity on visual debugging capabilities. - Error Tracking: DataDog provides frustration signals (rage clicks, dead clicks, error clicks) for UX analysis. OpenObserve provides SQL-based error analysis with backend correlation.
- User Segmentation: DataDog uses RUM Explorer filters and dashboards. OpenObserve uses SQL for cohort analysis, conversion funnels, and custom segmentation.
- Data Export: DataDog has limited export options through UI. OpenObserve supports SQL-based export to any BI tool or data warehouse.
- SDK Setup: Both use npm packages with familiar configuration patterns for modern web applications.
What Is Real User Monitoring (RUM)?
Real User Monitoring captures actual user interactions with web applications in production. Unlike synthetic monitoring (simulated tests), RUM tracks real users: page load times, click interactions, JavaScript errors, navigation patterns, and device/browser characteristics.
RUM answers critical questions:
- How fast do pages load for users in different regions?
- Which features cause the most errors?
- Where do users abandon workflows?
- What's the impact of performance on conversion rates?
Both DataDog and OpenObserve provide comprehensive RUM capabilities. The comparison focuses on query flexibility, correlation capabilities, and operational workflows.
SDK Setup and Configuration
Both platforms provide Browser SDKs via npm packages (@openobserve/browser-rum) with familiar configuration patterns. Installation and initialization follow standard practices for modern RUM tools, with core configuration options for applicationId, clientToken, service, env, version, and tracking settings (trackResources, trackLongTasks, trackUserInteractions).
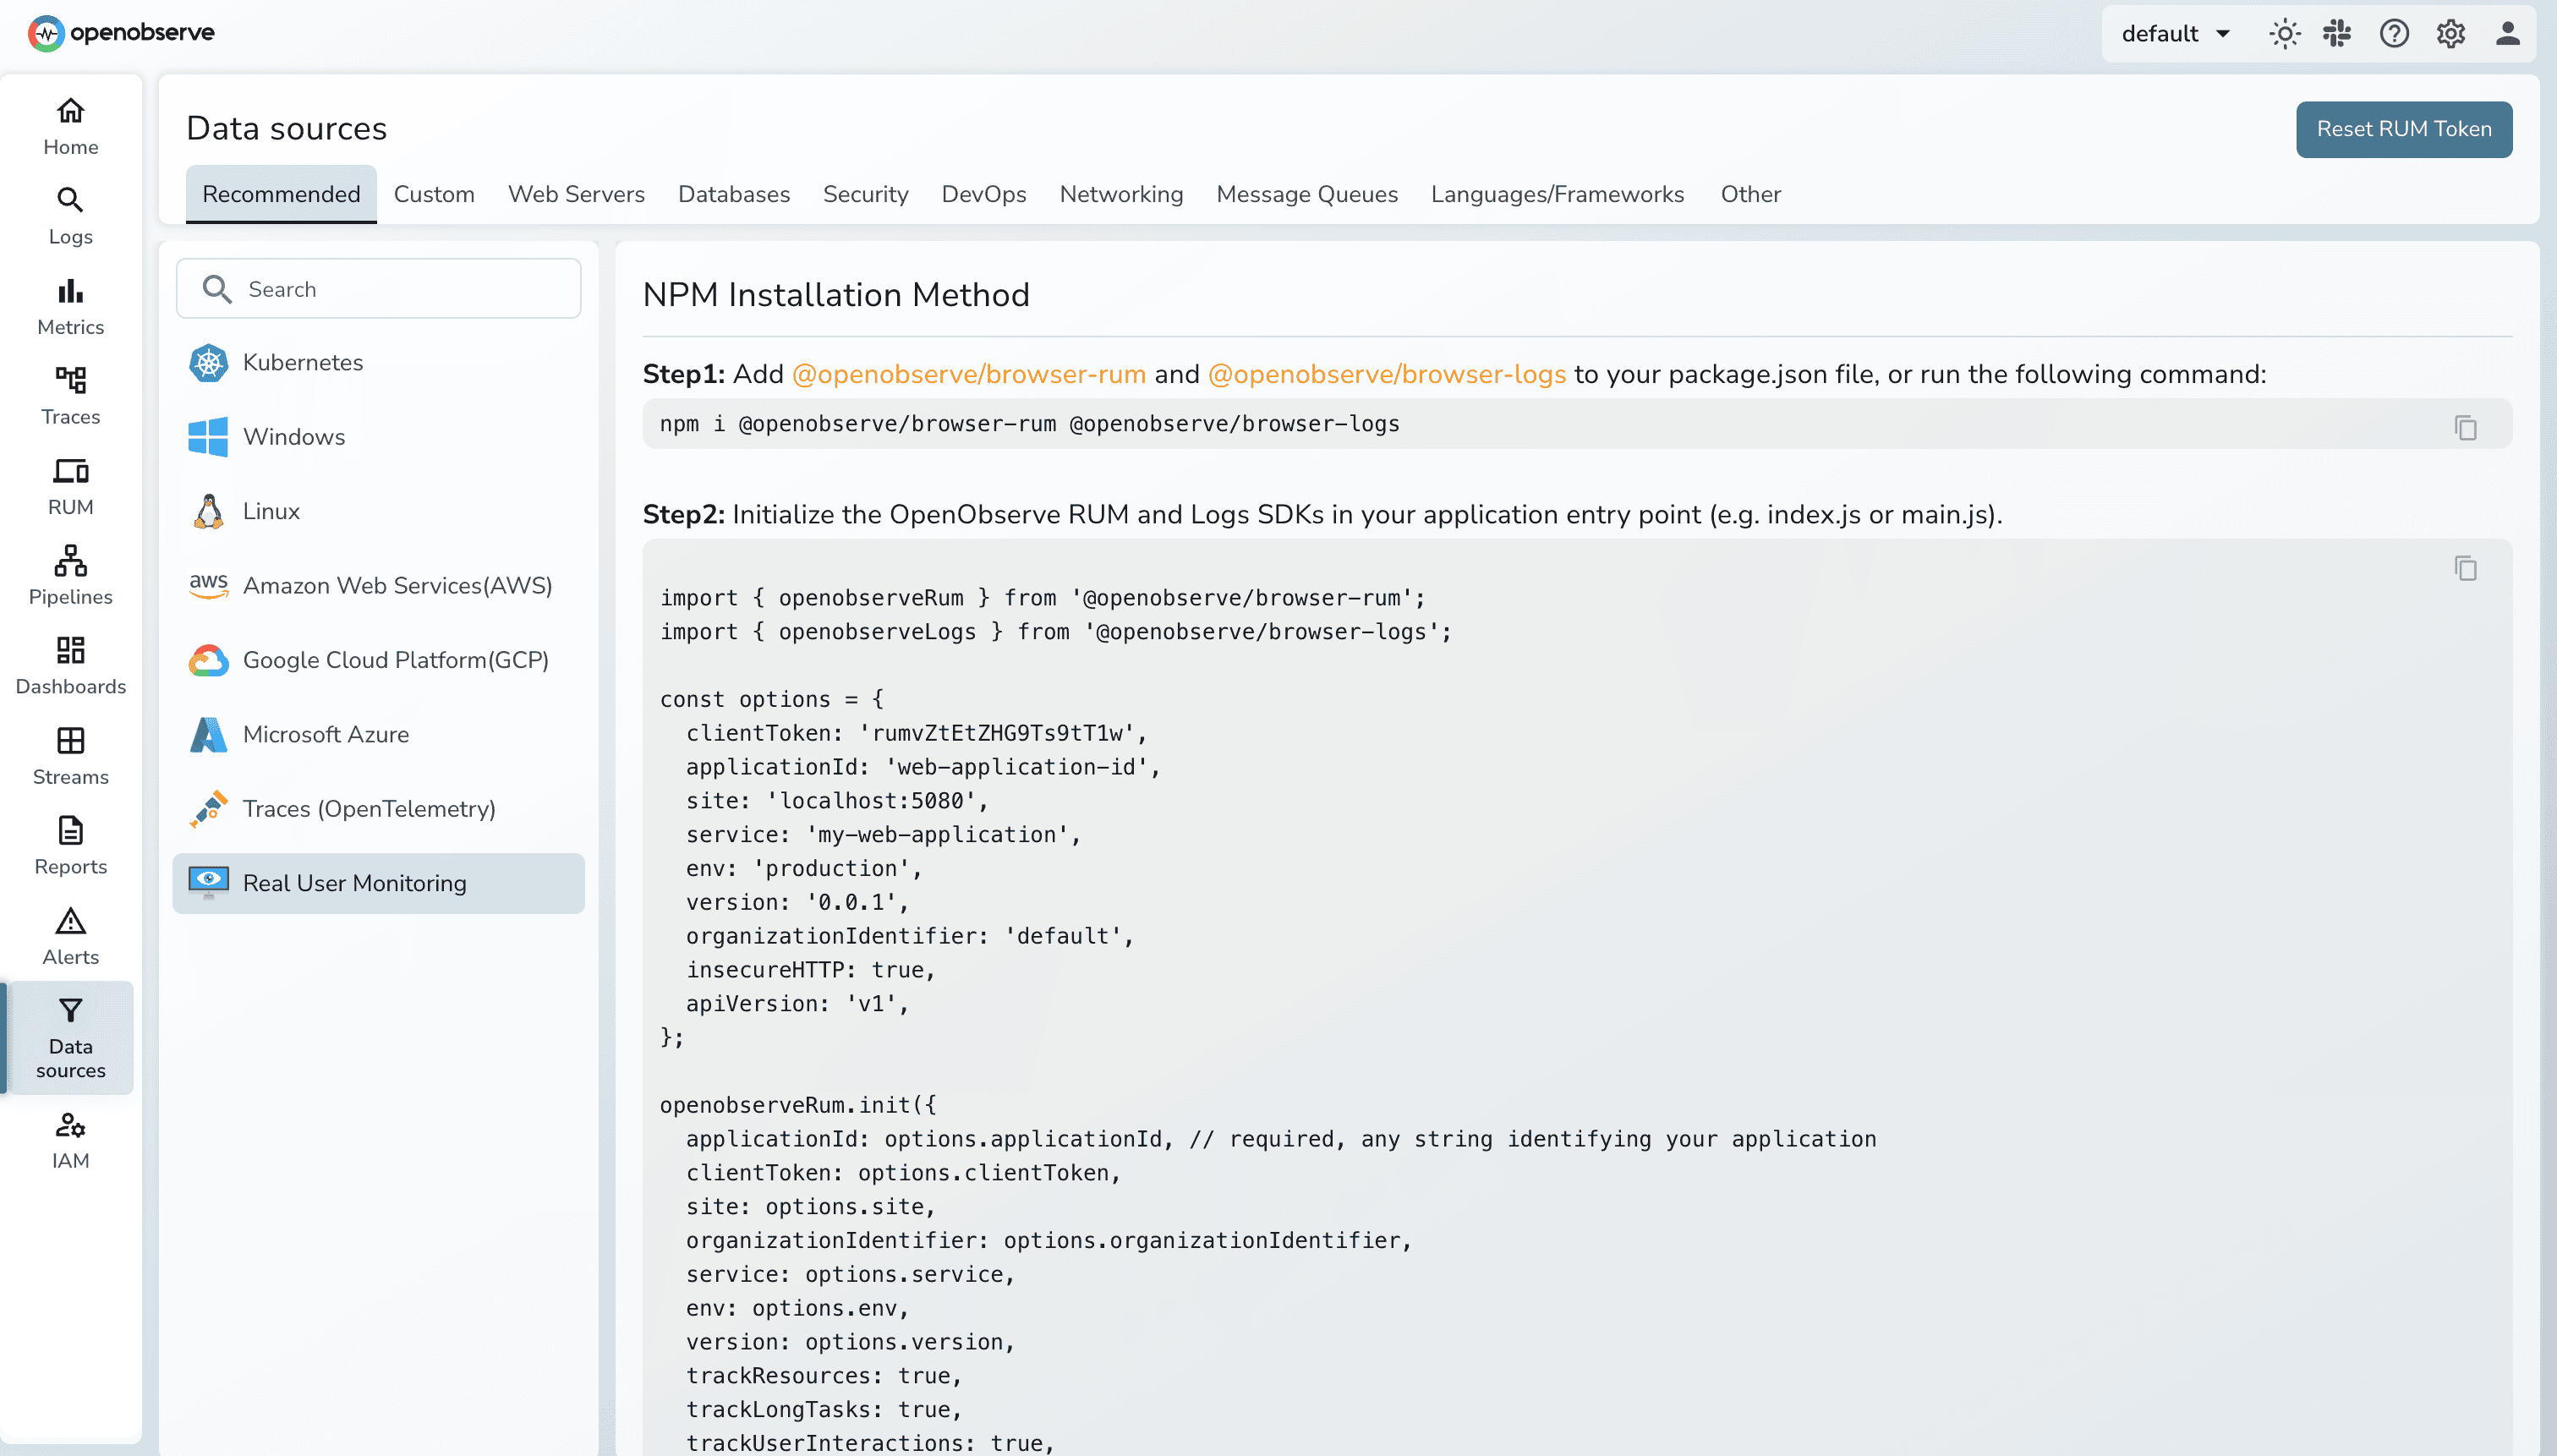
Both support privacy masking levels (mask, mask-user-input, allow), session sampling, and automatic error forwarding to logs. Setup time for both platforms: ~15-30 minutes for initial instrumentation.
Learn more: RUM Setup Guide
Performance Monitoring: Core Web Vitals
Both platforms automatically collect Core Web Vitals: the Google-defined metrics that measure user experience.
Tracked Metrics
Core Web Vitals:
- Largest Contentful Paint (LCP): Time until largest content element renders (target: <2.5s)
- Interaction to Next Paint (INP): Responsiveness to user interactions (target: <200ms)
- Cumulative Layout Shift (CLS): Visual stability, unexpected layout shifts (target: <0.1)
Additional Metrics:
- First Contentful Paint (FCP): Time until first content renders
- Time to First Byte (TTFB): Server response time
- First Input Delay (FID): Time until first user interaction responds
DataDog Core Web Vitals
DataDog RUM automatically collects Core Web Vitals for every user session, surfacing key performance indicators in an intuitive dashboard. The Web App Performance dashboard shows p75 values for each Core Web Vital as it relates to Google's defined thresholds.
Element-level tracking: DataDog reports the CSS selector of elements contributing to poor metrics. For LCP, see which image or text block caused slow rendering. For CLS, identify which element shifted unexpectedly.
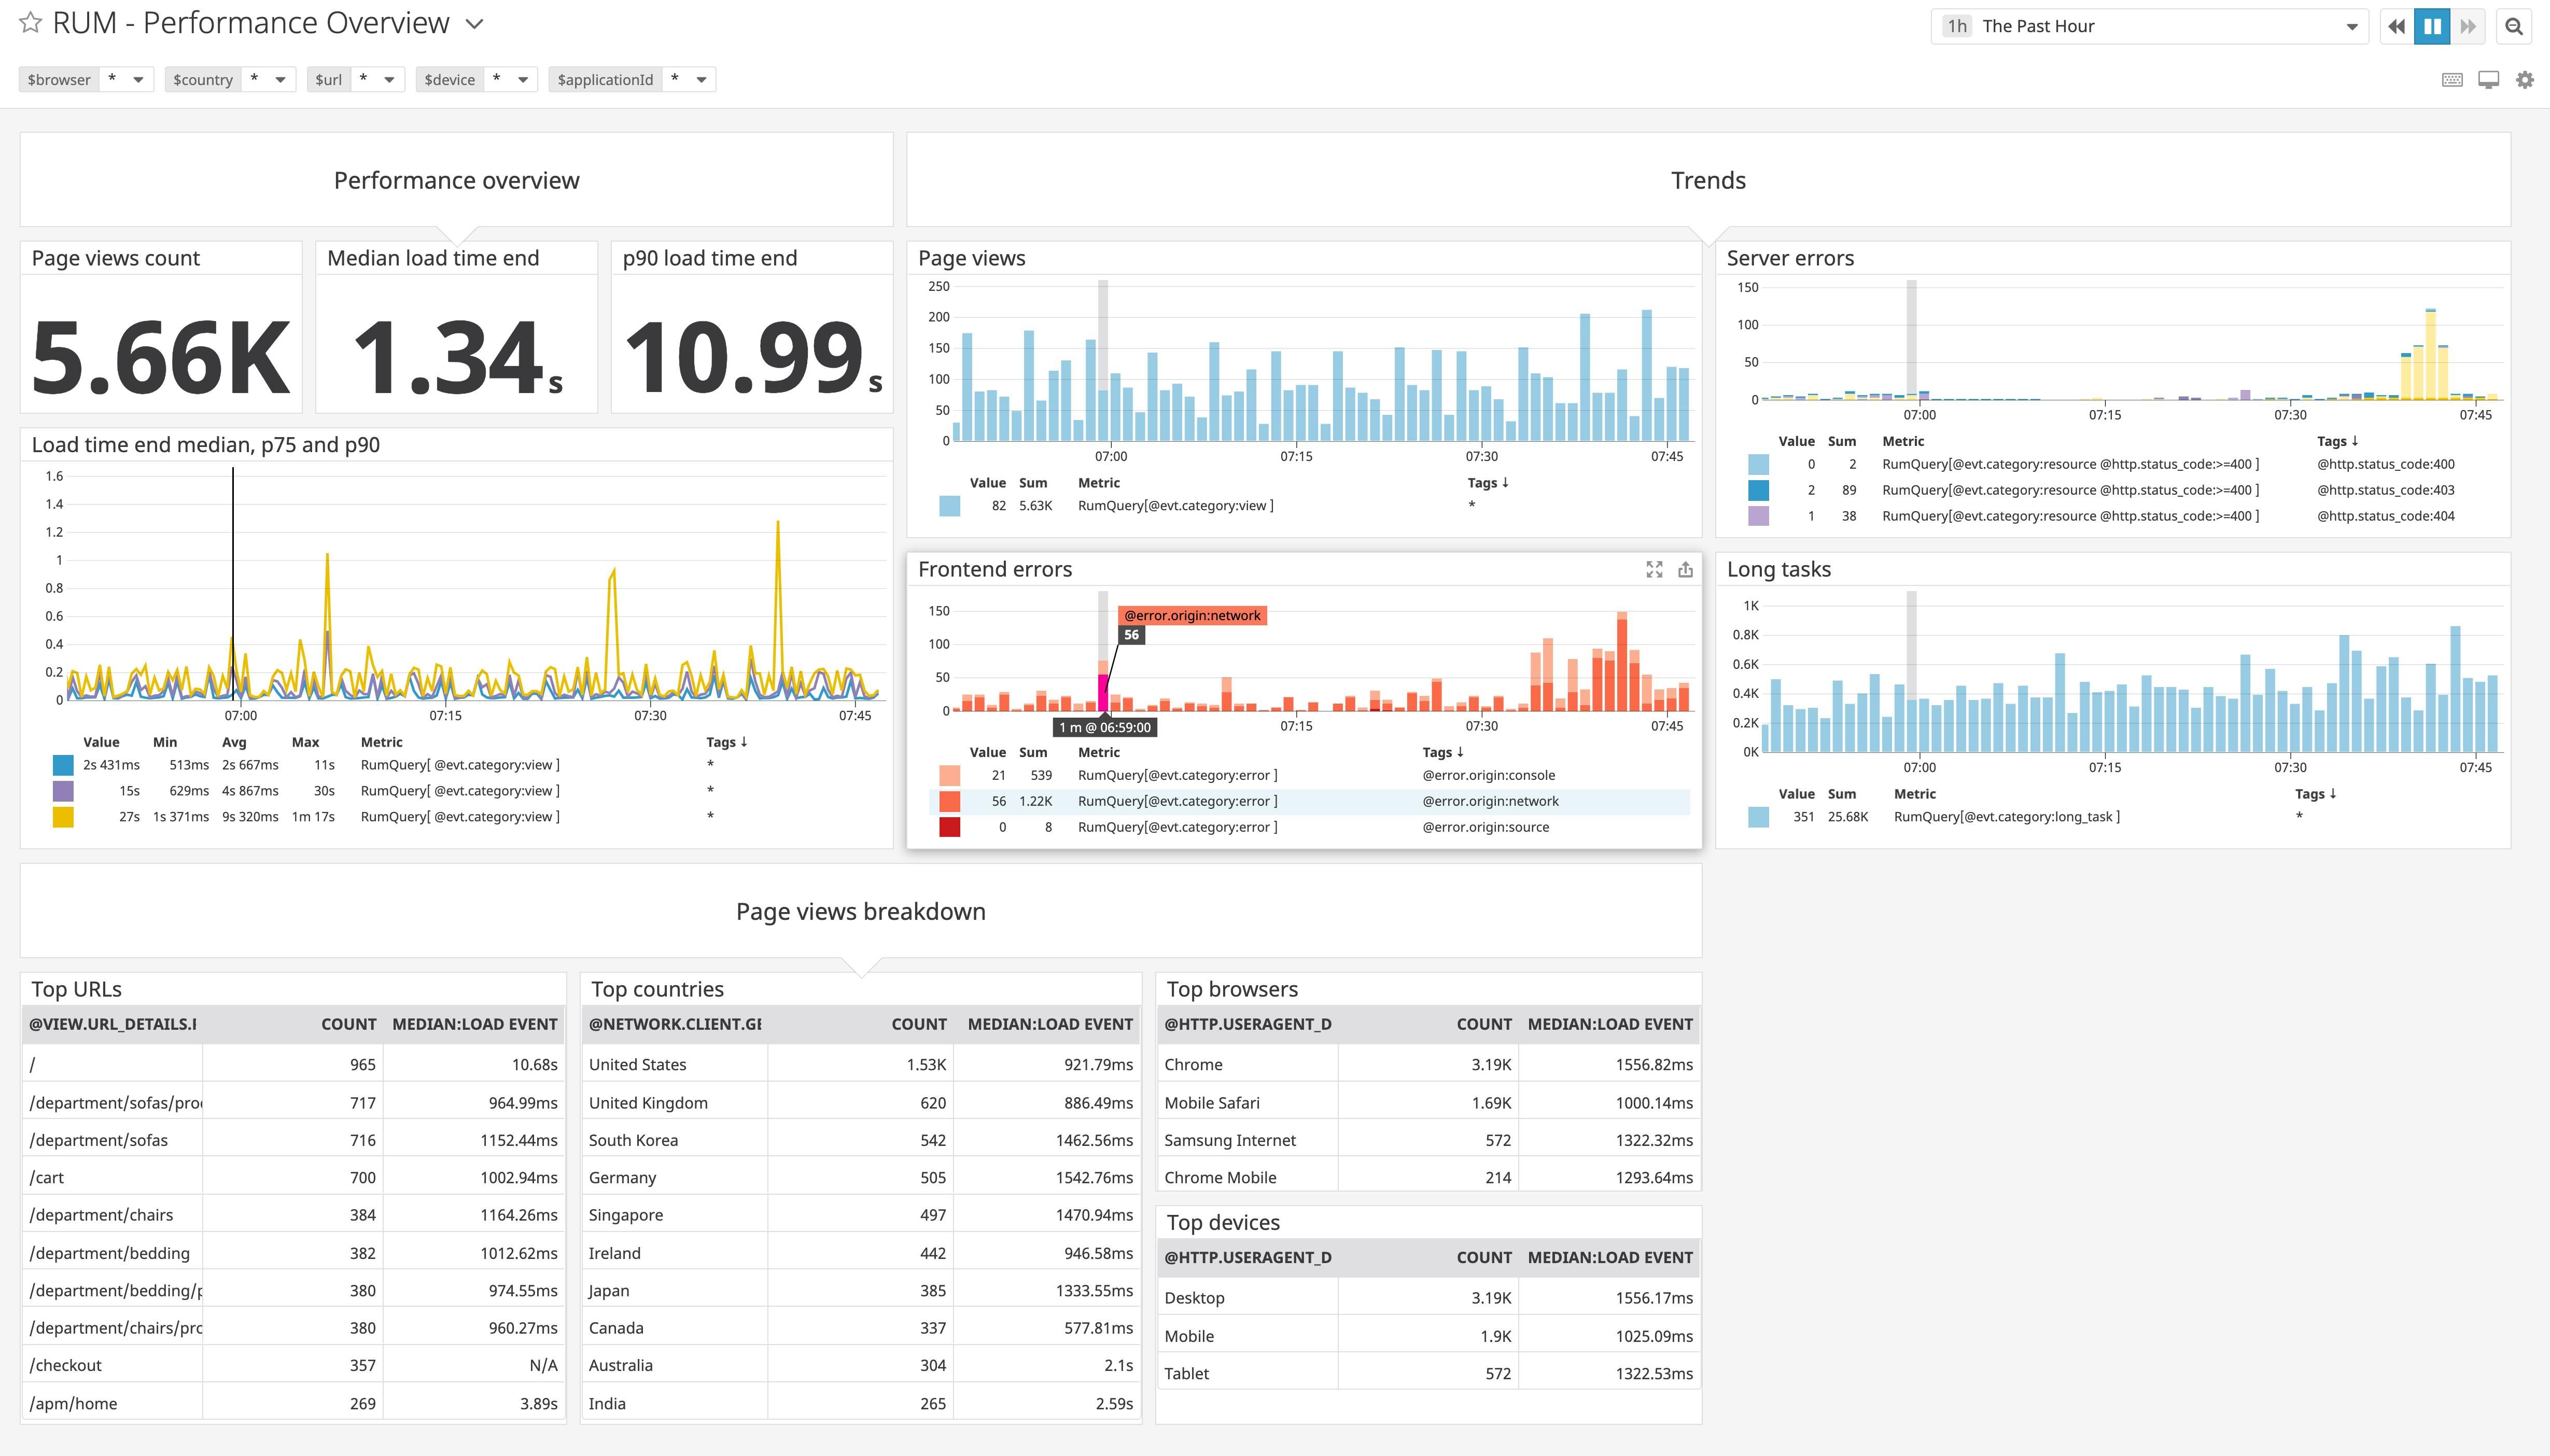
Optimization page: DataDog RUM includes the Optimization page, a tool that helps teams pinpoint the root cause of browser performance issues using real traffic data. The Optimization workflow provides deep insights about performance trends, resource loading for URL groups, and recurring errors.
Out-of-the-box dashboards: Pre-built performance dashboards cover standard use cases: page load analysis, resource timing, user experience trends.
OpenObserve Core Web Vitals
OpenObserve RUM collects the same Core Web Vitals metrics, storing them as structured data queryable via SQL.
SQL-based analysis:
SELECT
    resource_url,
    resource_status_code,
    COUNT(*) as requests,
    AVG(resource_duration) as avg_duration
  FROM  "_rumdata"
  WHERE type = 'resource'
  GROUP BY resource_url, resource_status_code
  ORDER BY requests DESC
  LIMIT 25
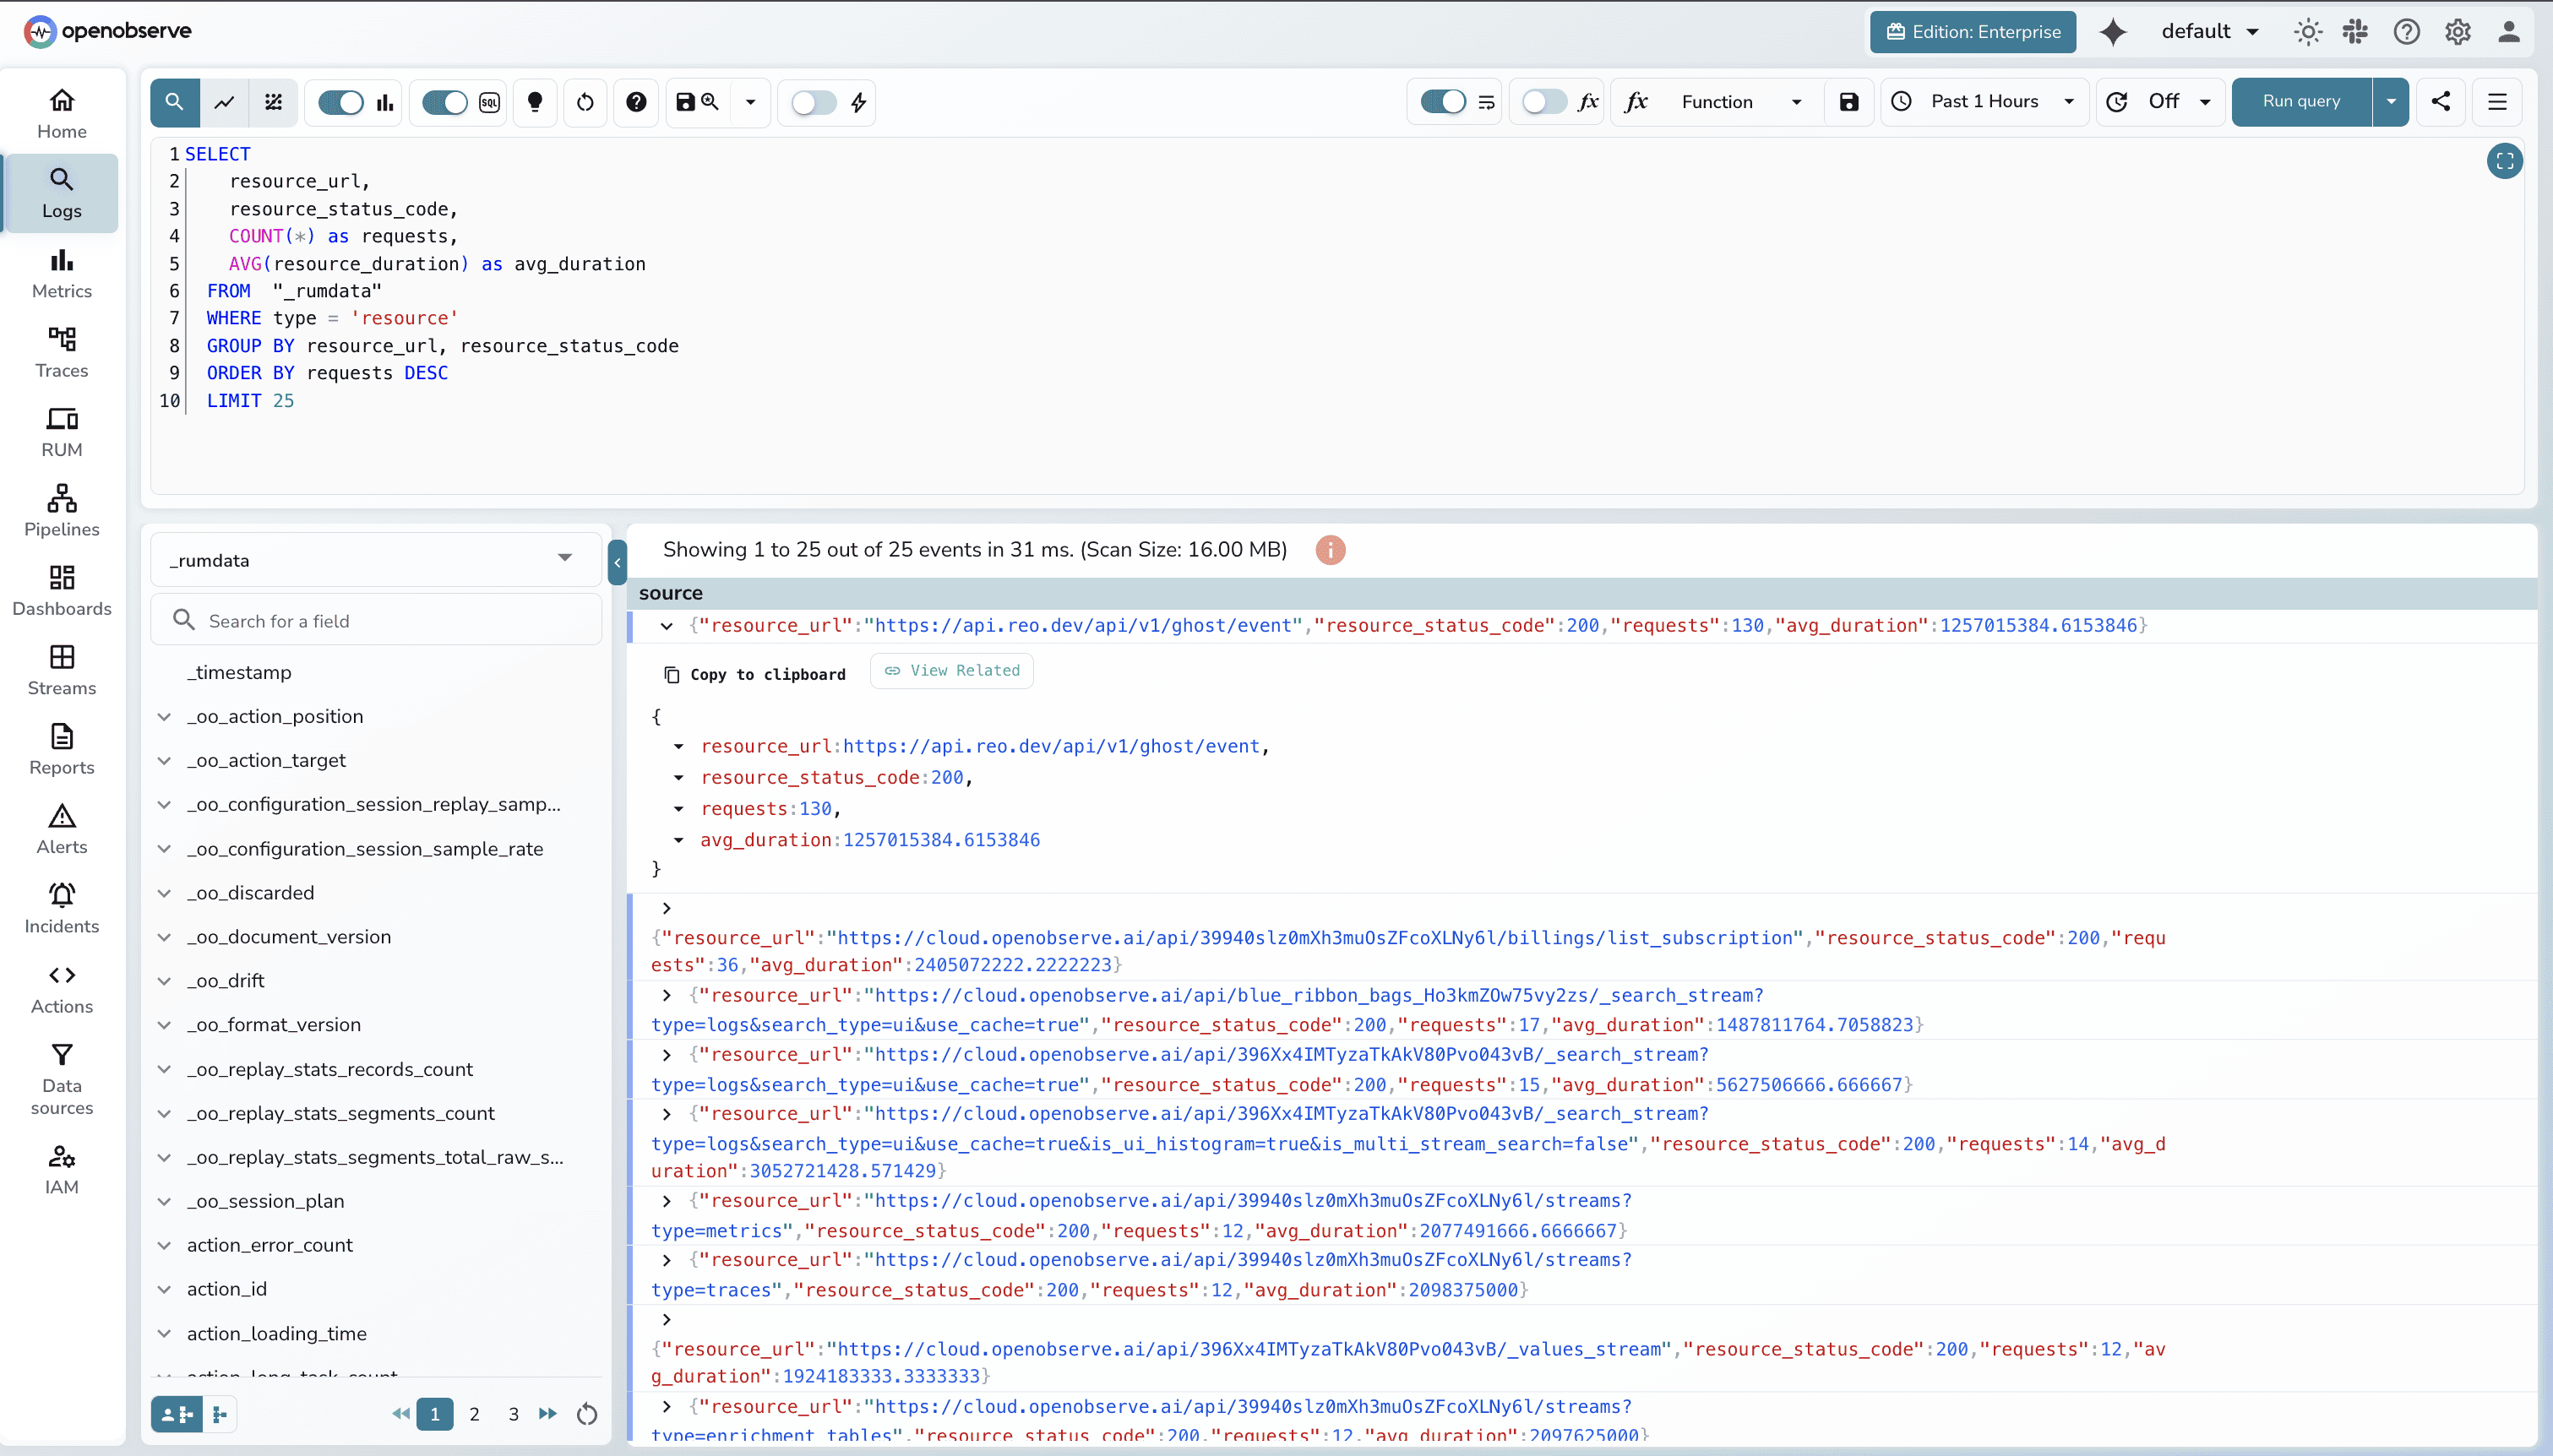
Custom analysis capabilities:
- Correlate performance with user attributes (region, device, plan tier)
- Track performance trends over time with window functions
- Join performance data with error data for impact analysis
- Export to BI tools via SQL connectors
- Schedule automated performance reports
Custom dashboards: Build performance dashboards using SQL queries. Visualize Web Vitals by browser, region, device type, or custom user segments.
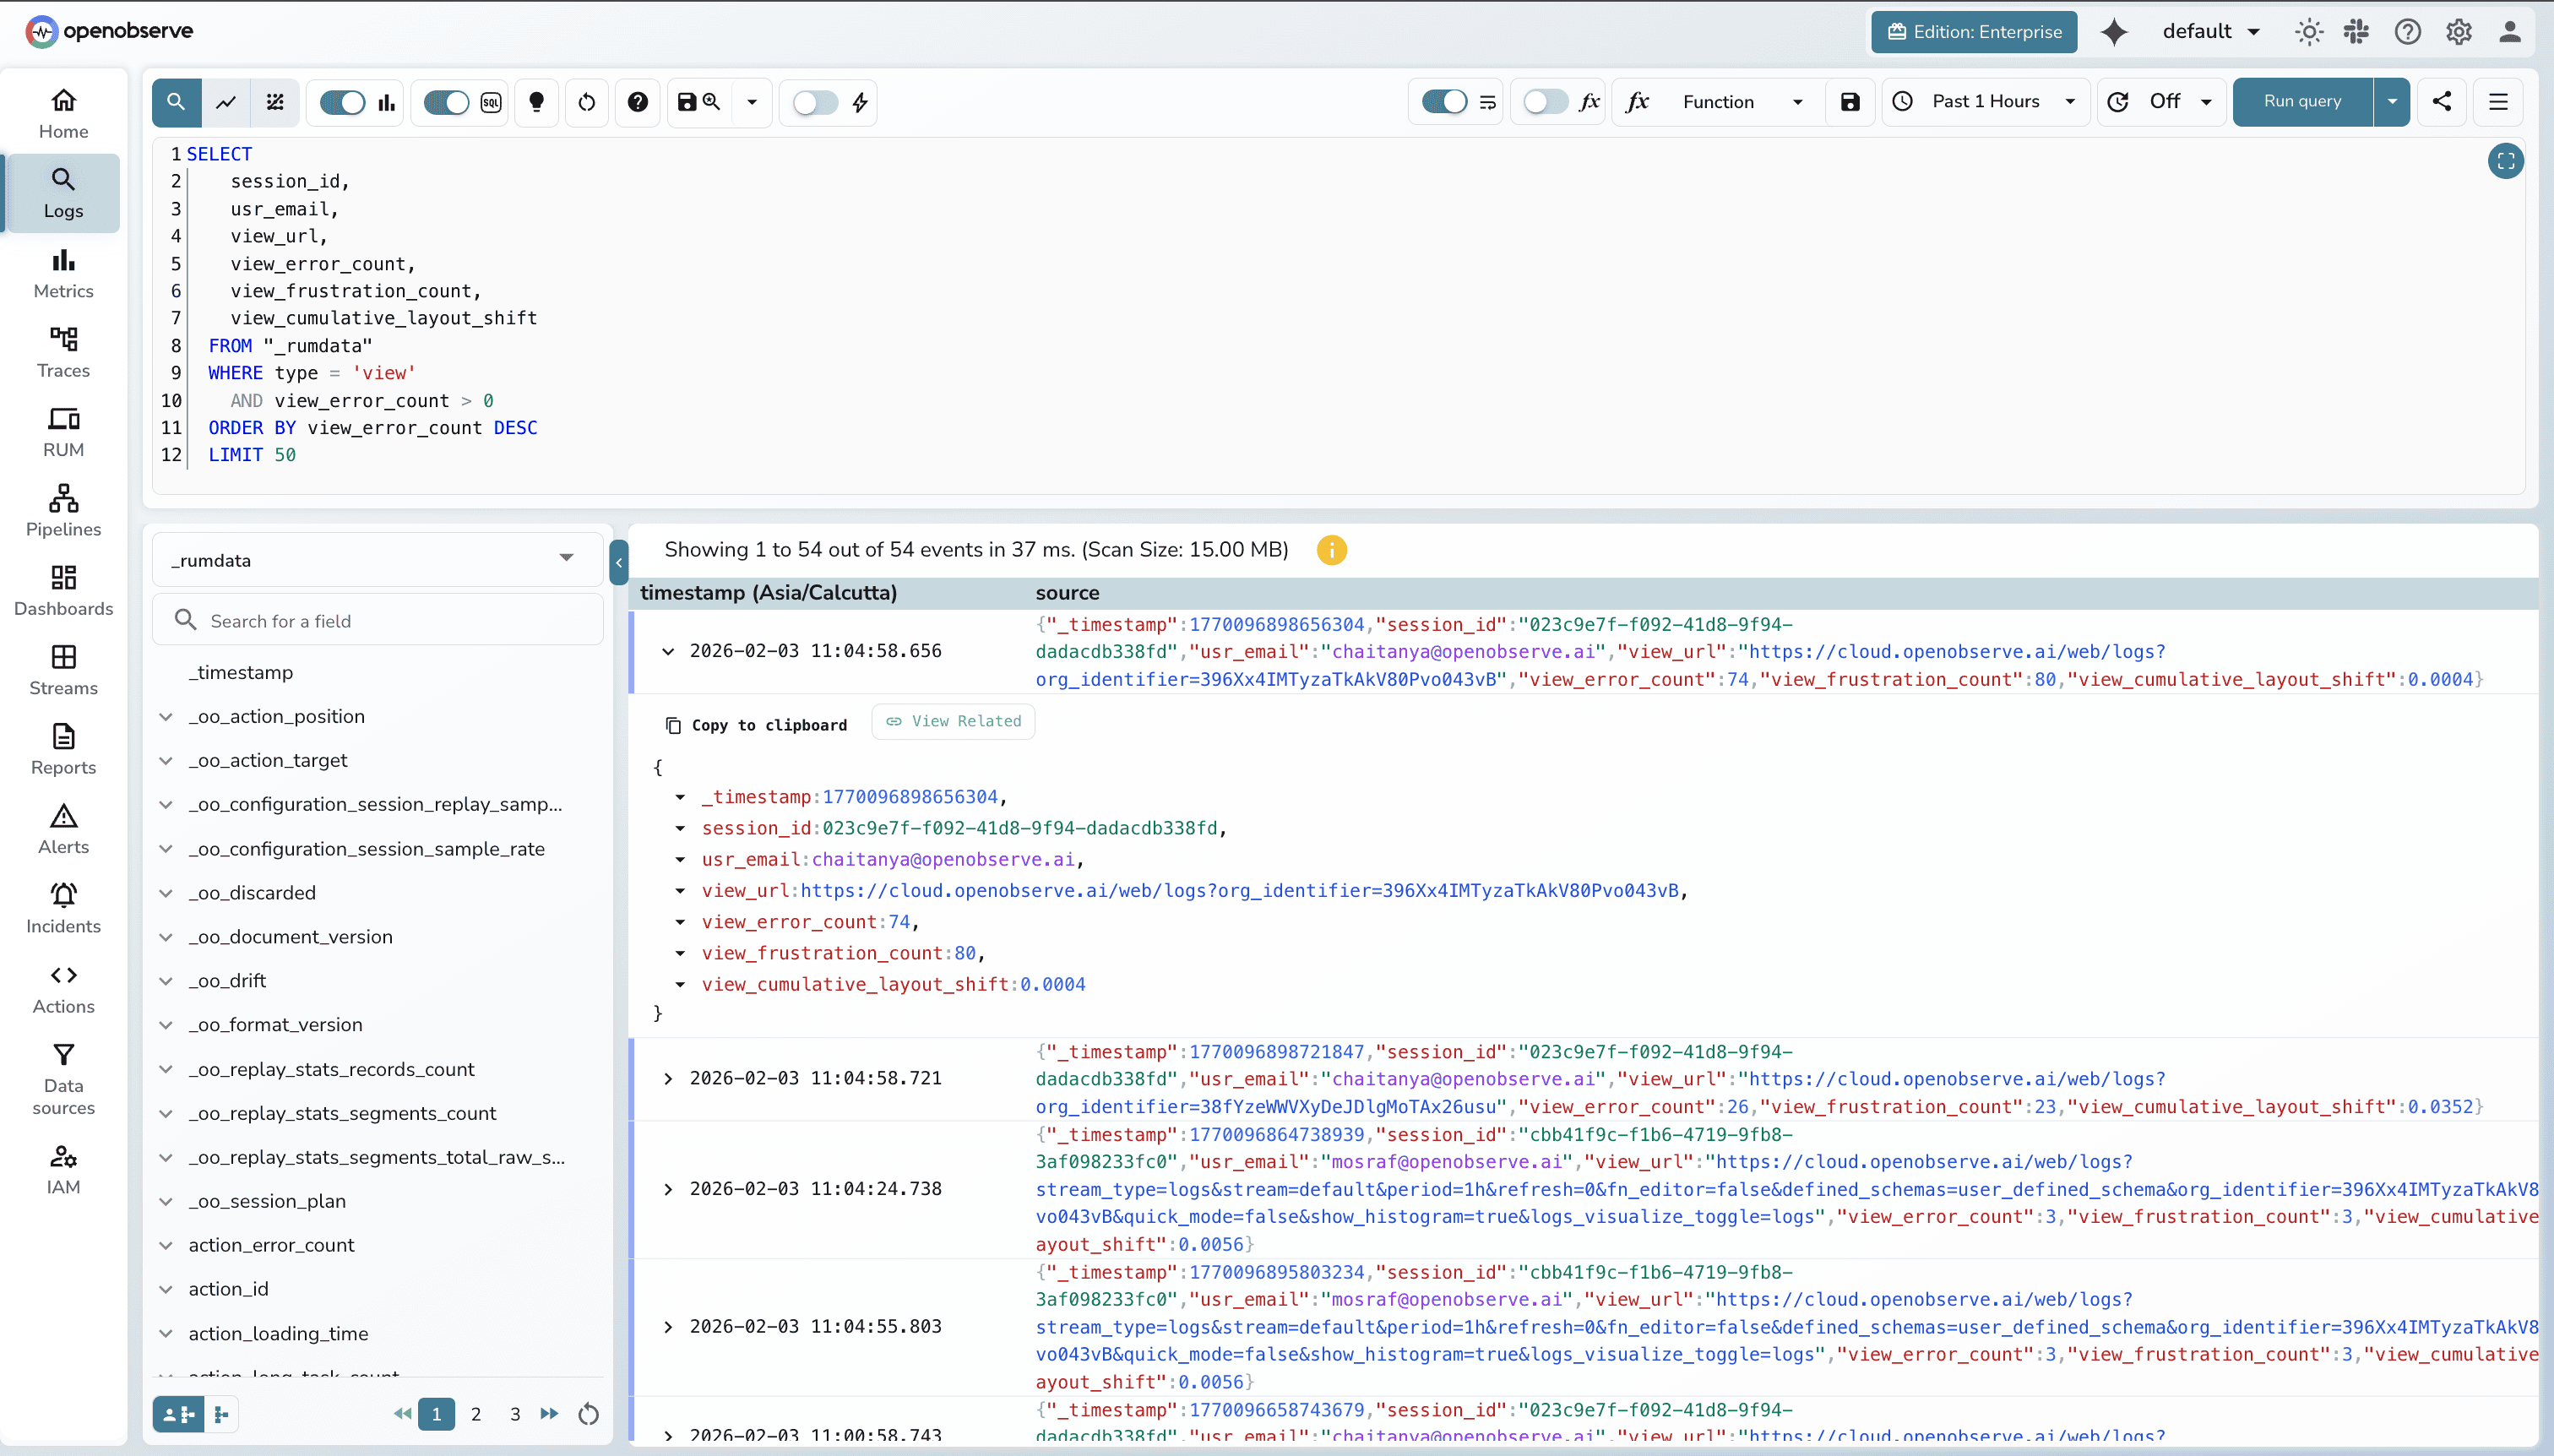
Both platforms collect Core Web Vitals effectively. DataDog provides out-of-the-box optimization dashboards and UI-driven analysis. OpenObserve provides SQL query flexibility for custom analysis and programmatic export.
Session Replay: Visual Debugging
Available in OpenObserve Cloud.
Session replay records user interactions, replaying them as video-like recordings. Debug issues by watching exactly what users experienced: clicks, scrolls, page transitions, errors.
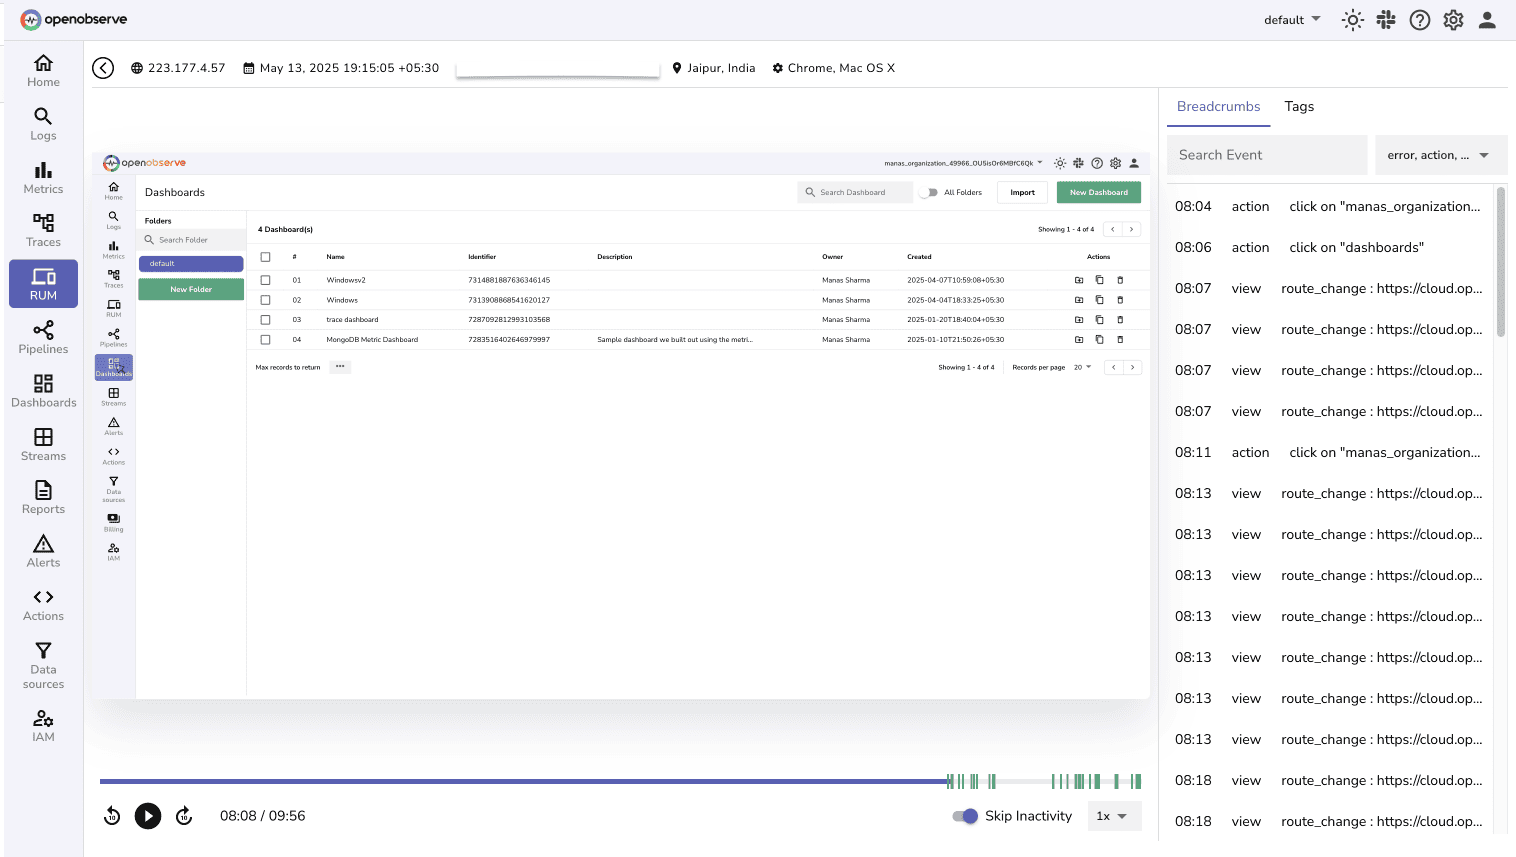
Feature parity on session replay capabilities and privacy controls. DataDog uses UI-based search. OpenObserve adds SQL flexibility for complex session queries.
Error Tracking: Frontend Issues
Available in OpenObserve Cloud.
Both platforms automatically capture JavaScript errors, unhandled promise rejections, and network failures.
DataDog Error Tracking
DataDog collects frontend errors from multiple sources, including manual error collection and React error boundaries. Errors appear in the RUM Explorer with stack traces, user context, and correlated sessions.
Frustration signals: DataDog tracks user frustration patterns that indicate UX problems:
- Rage clicks: User clicks element 3+ times in <1 second
- Dead clicks: Click on static element that produces no action
- Error clicks: Click right before JavaScript error occurs
These signals identify UX friction points and help prioritize fixes based on actual user frustration.
OpenObserve Error Tracking
OpenObserve captures JavaScript errors with automatic forwarding to logs for centralized error management. SQL-based error analysis aggregates by error message, affected sessions, affected users, and performance impact:
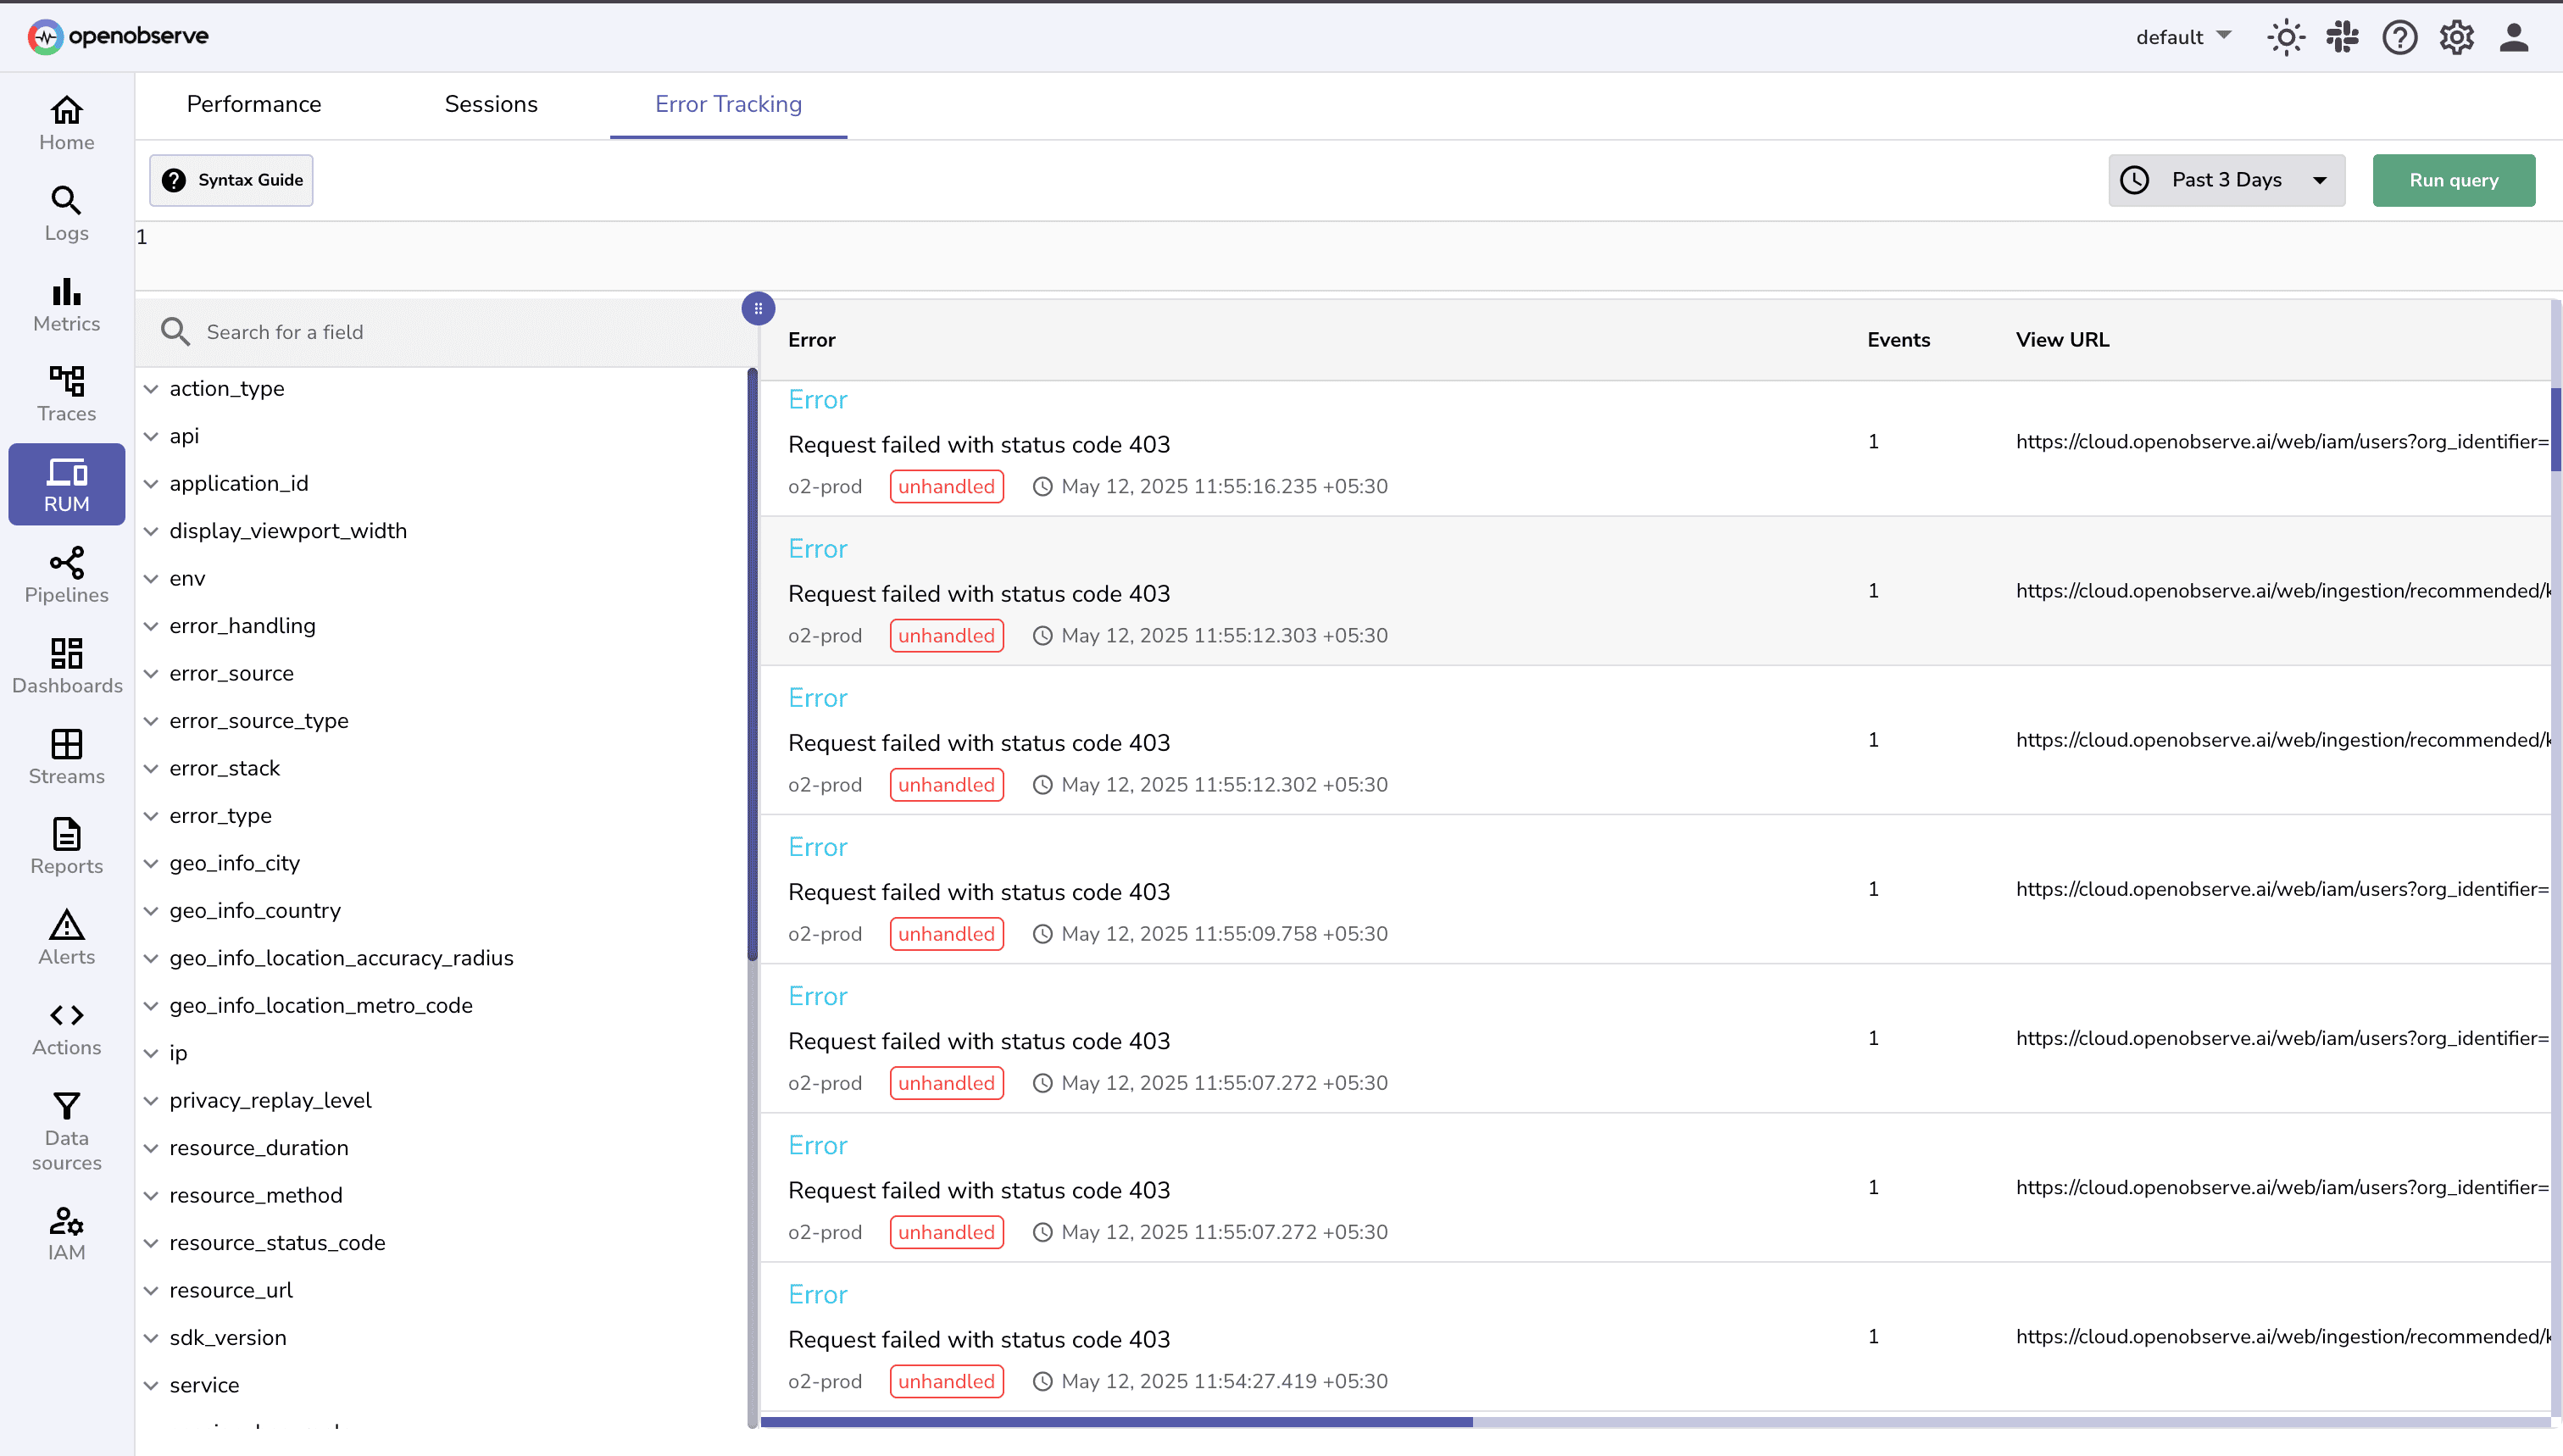
Correlation with backend errors: Since OpenObserve uses SQL for all signals (logs, metrics, traces, RUM), correlate frontend errors with backend issues in a single query:
SELECT
  rum.error_message as frontend_error,
  logs.error_message as backend_error,
  rum.session_id,
  rum.user_id,
  rum.view_name,
  logs.service_name,
  traces.duration_ms as backend_latency
FROM "_rumdata"
JOIN logs logs ON rum.trace_id = logs.trace_id
JOIN traces traces ON rum.trace_id = traces.trace_id
WHERE rum._timestamp > now() - interval '1 hour'
  AND logs.level = 'ERROR'
ORDER BY rum._timestamp DESC
This cross-signal analysis reveals whether frontend errors stem from backend failures or client-side issues.
Use case: SQL correlation discovered that checkout errors only occurred when backend payment API response time exceeded 3 seconds, causing frontend timeouts. The issue wasn't frontend code but slow backend service.
DataDog provides frustration signals for UX-specific analysis. OpenObserve provides SQL for custom error analysis and backend correlation through unified queries.
User Context and Tracking
Both platforms support user identity tracking (setUser()) and global context attributes (setGlobalContext(), setGlobalContextProperty()) for session analysis. Add custom attributes like user plan, feature flags, A/B test variants, or business context to all RUM events.
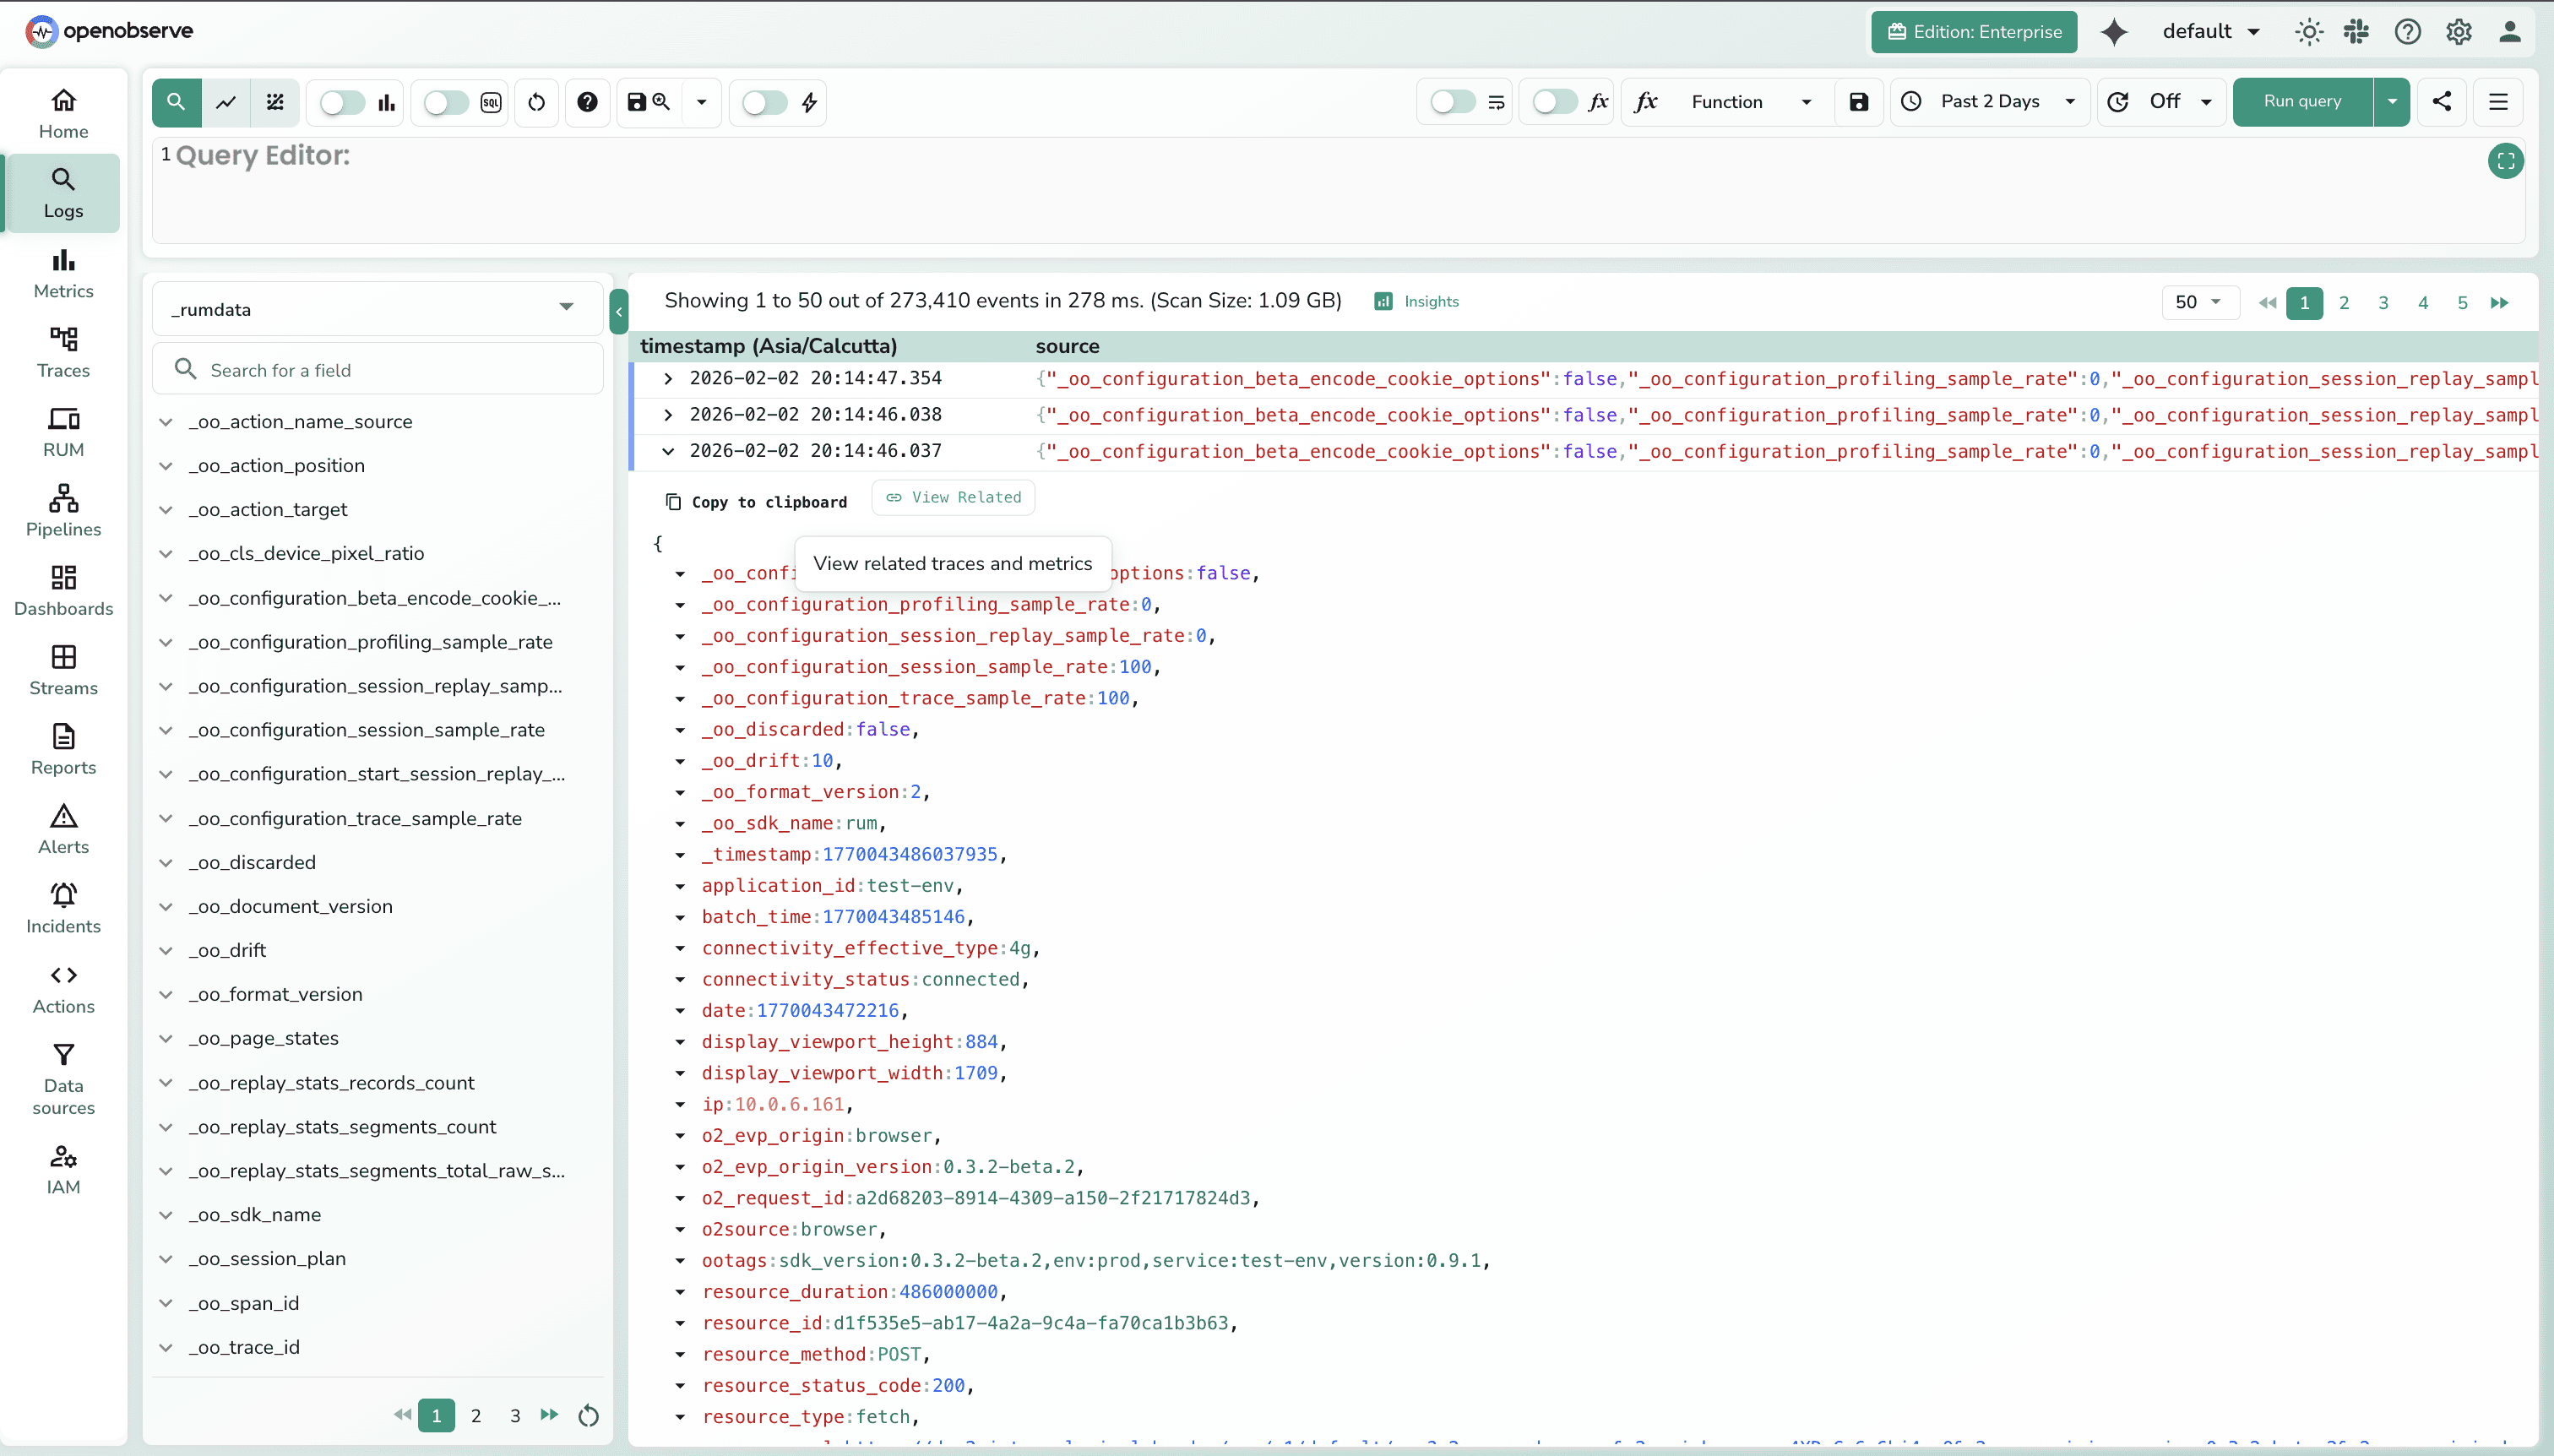
This reveals whether performance varies by user segment (free vs. premium, region, device type). Export segmentation data for business analysis.
Use case: Segmentation analysis showed premium users in APAC experienced 2x slower LCP than premium users in US/EU. Investigation revealed CDN configuration issue specific to APAC region.
Both platforms provide user tracking capabilities. OpenObserve adds SQL flexibility for segmentation analysis and programmatic export.
Query Languages: RUM Explorer vs SQL
The most significant operational difference: how you query and analyze RUM data.
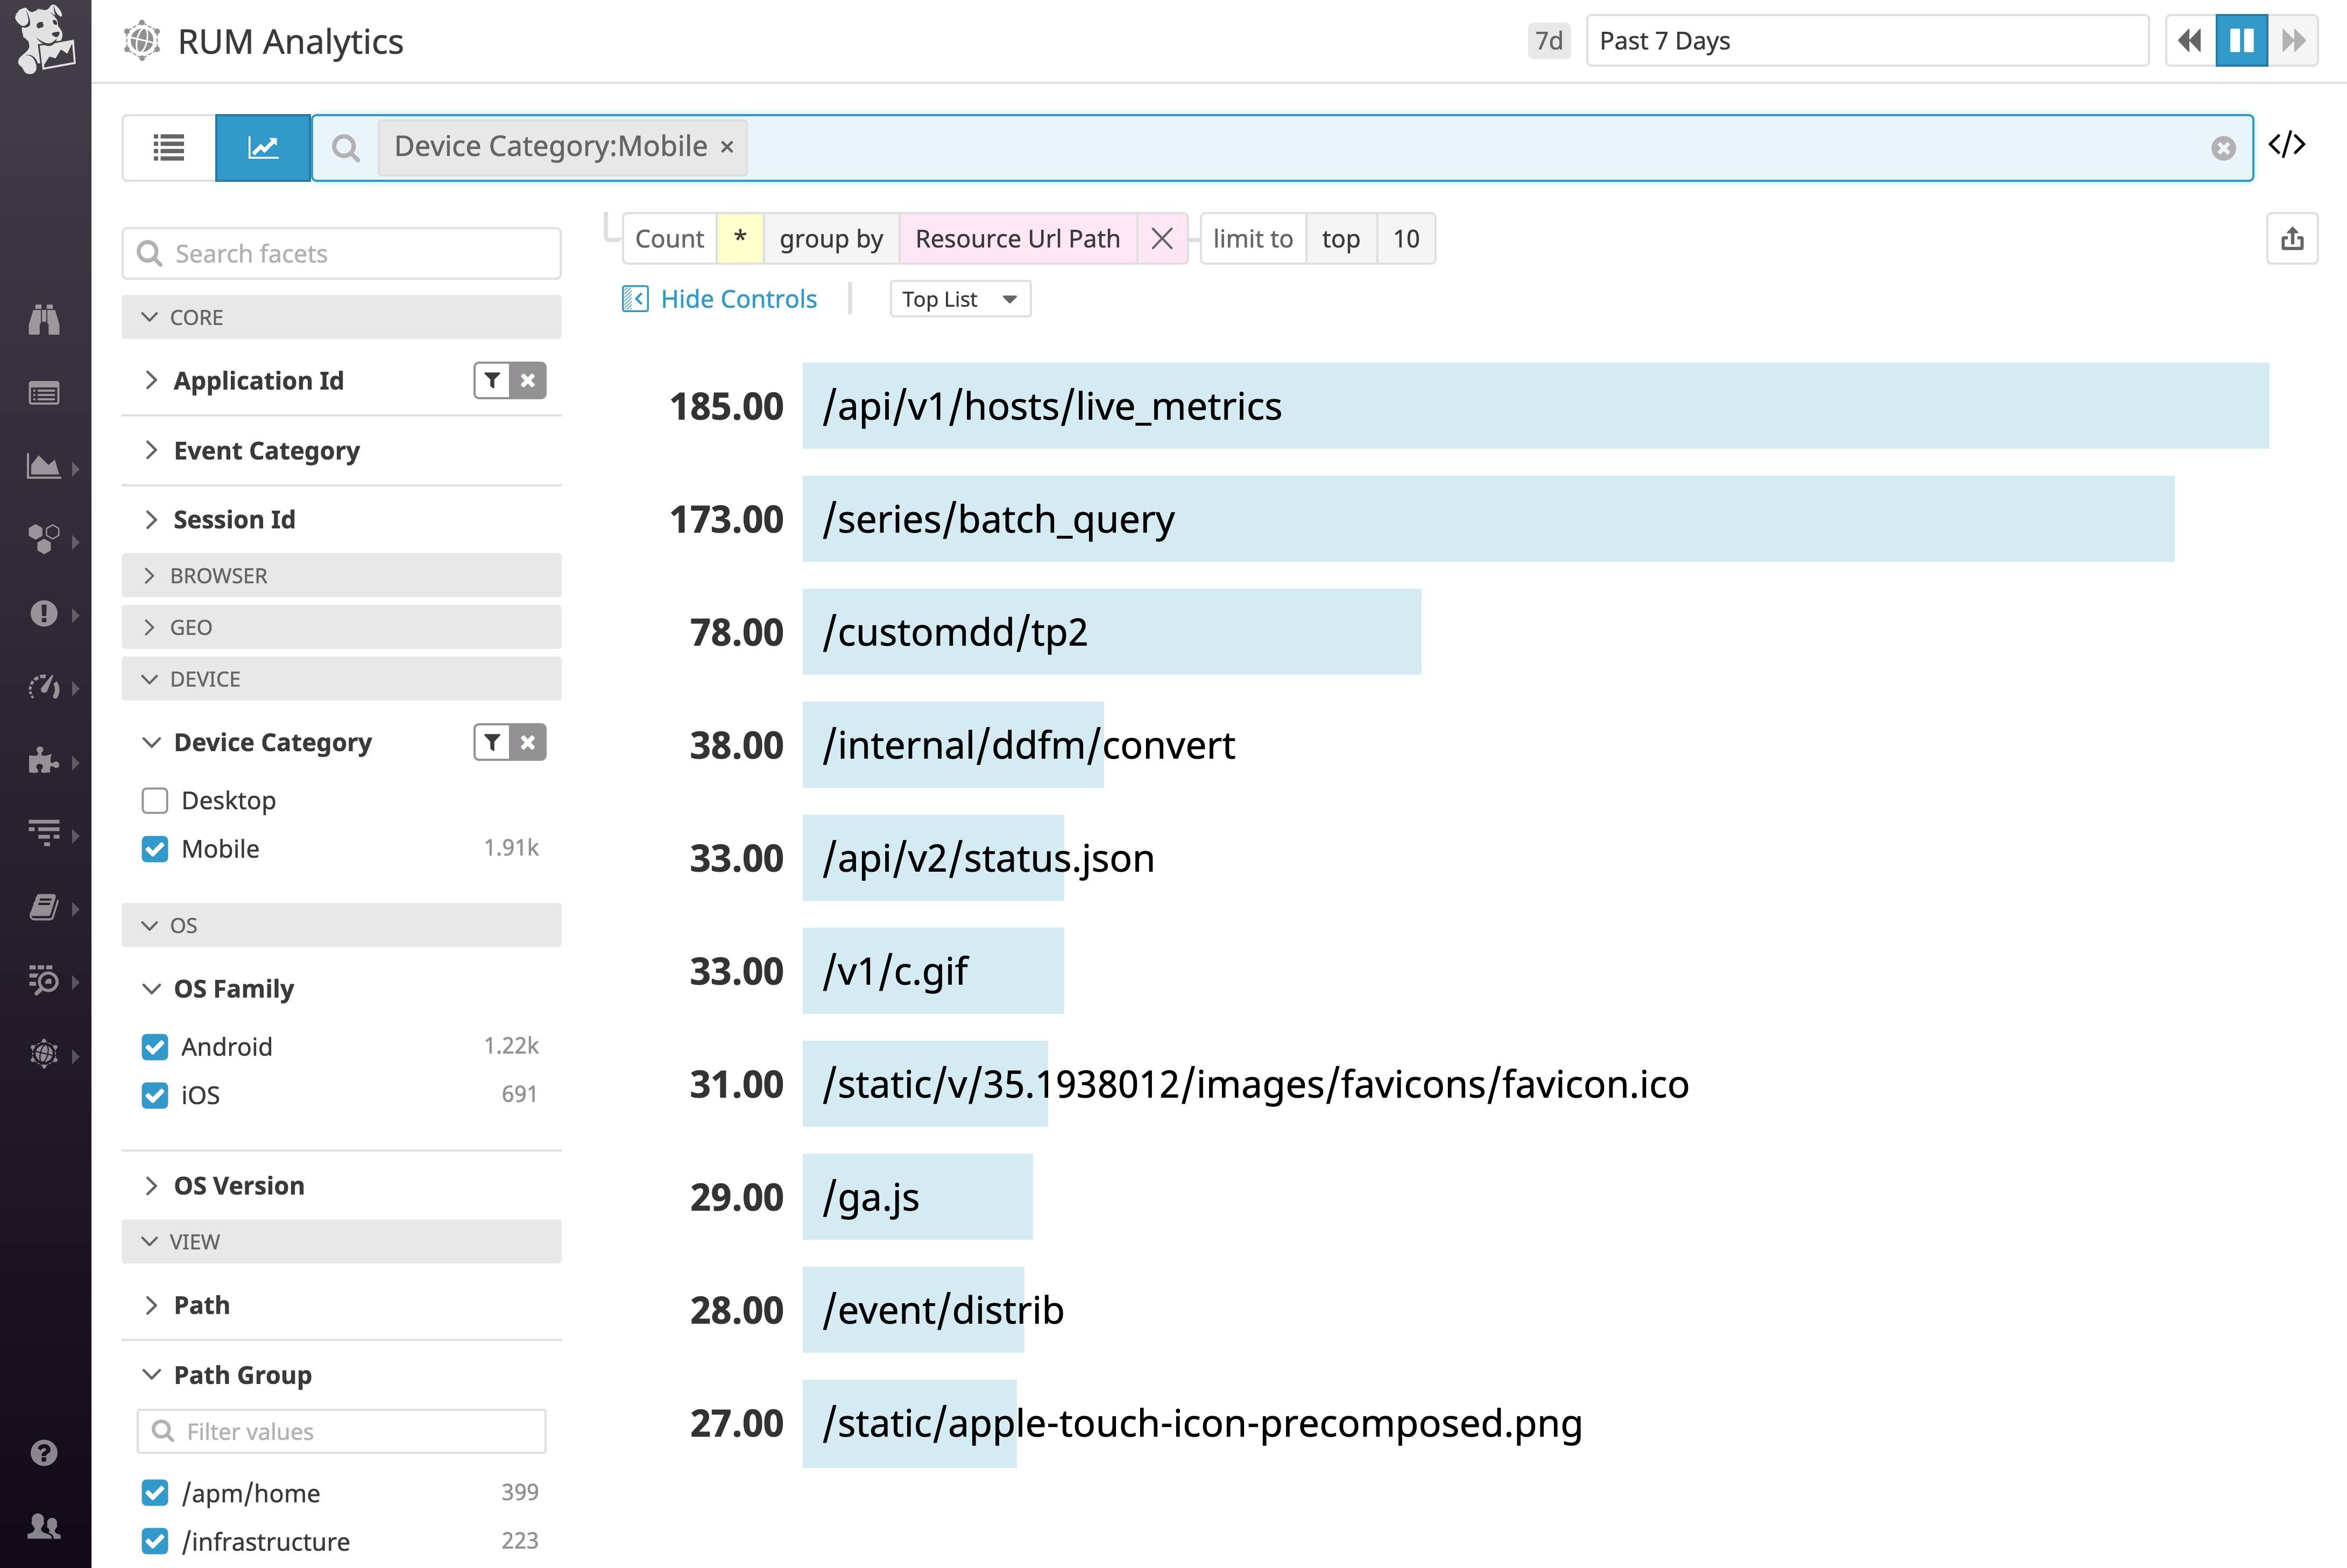
DataDog RUM Explorer
DataDog uses the RUM Explorer with tag-based proprietary search syntax:
This works for filtering and searching sessions. Build dashboards through UI with drag-and-drop widgets.
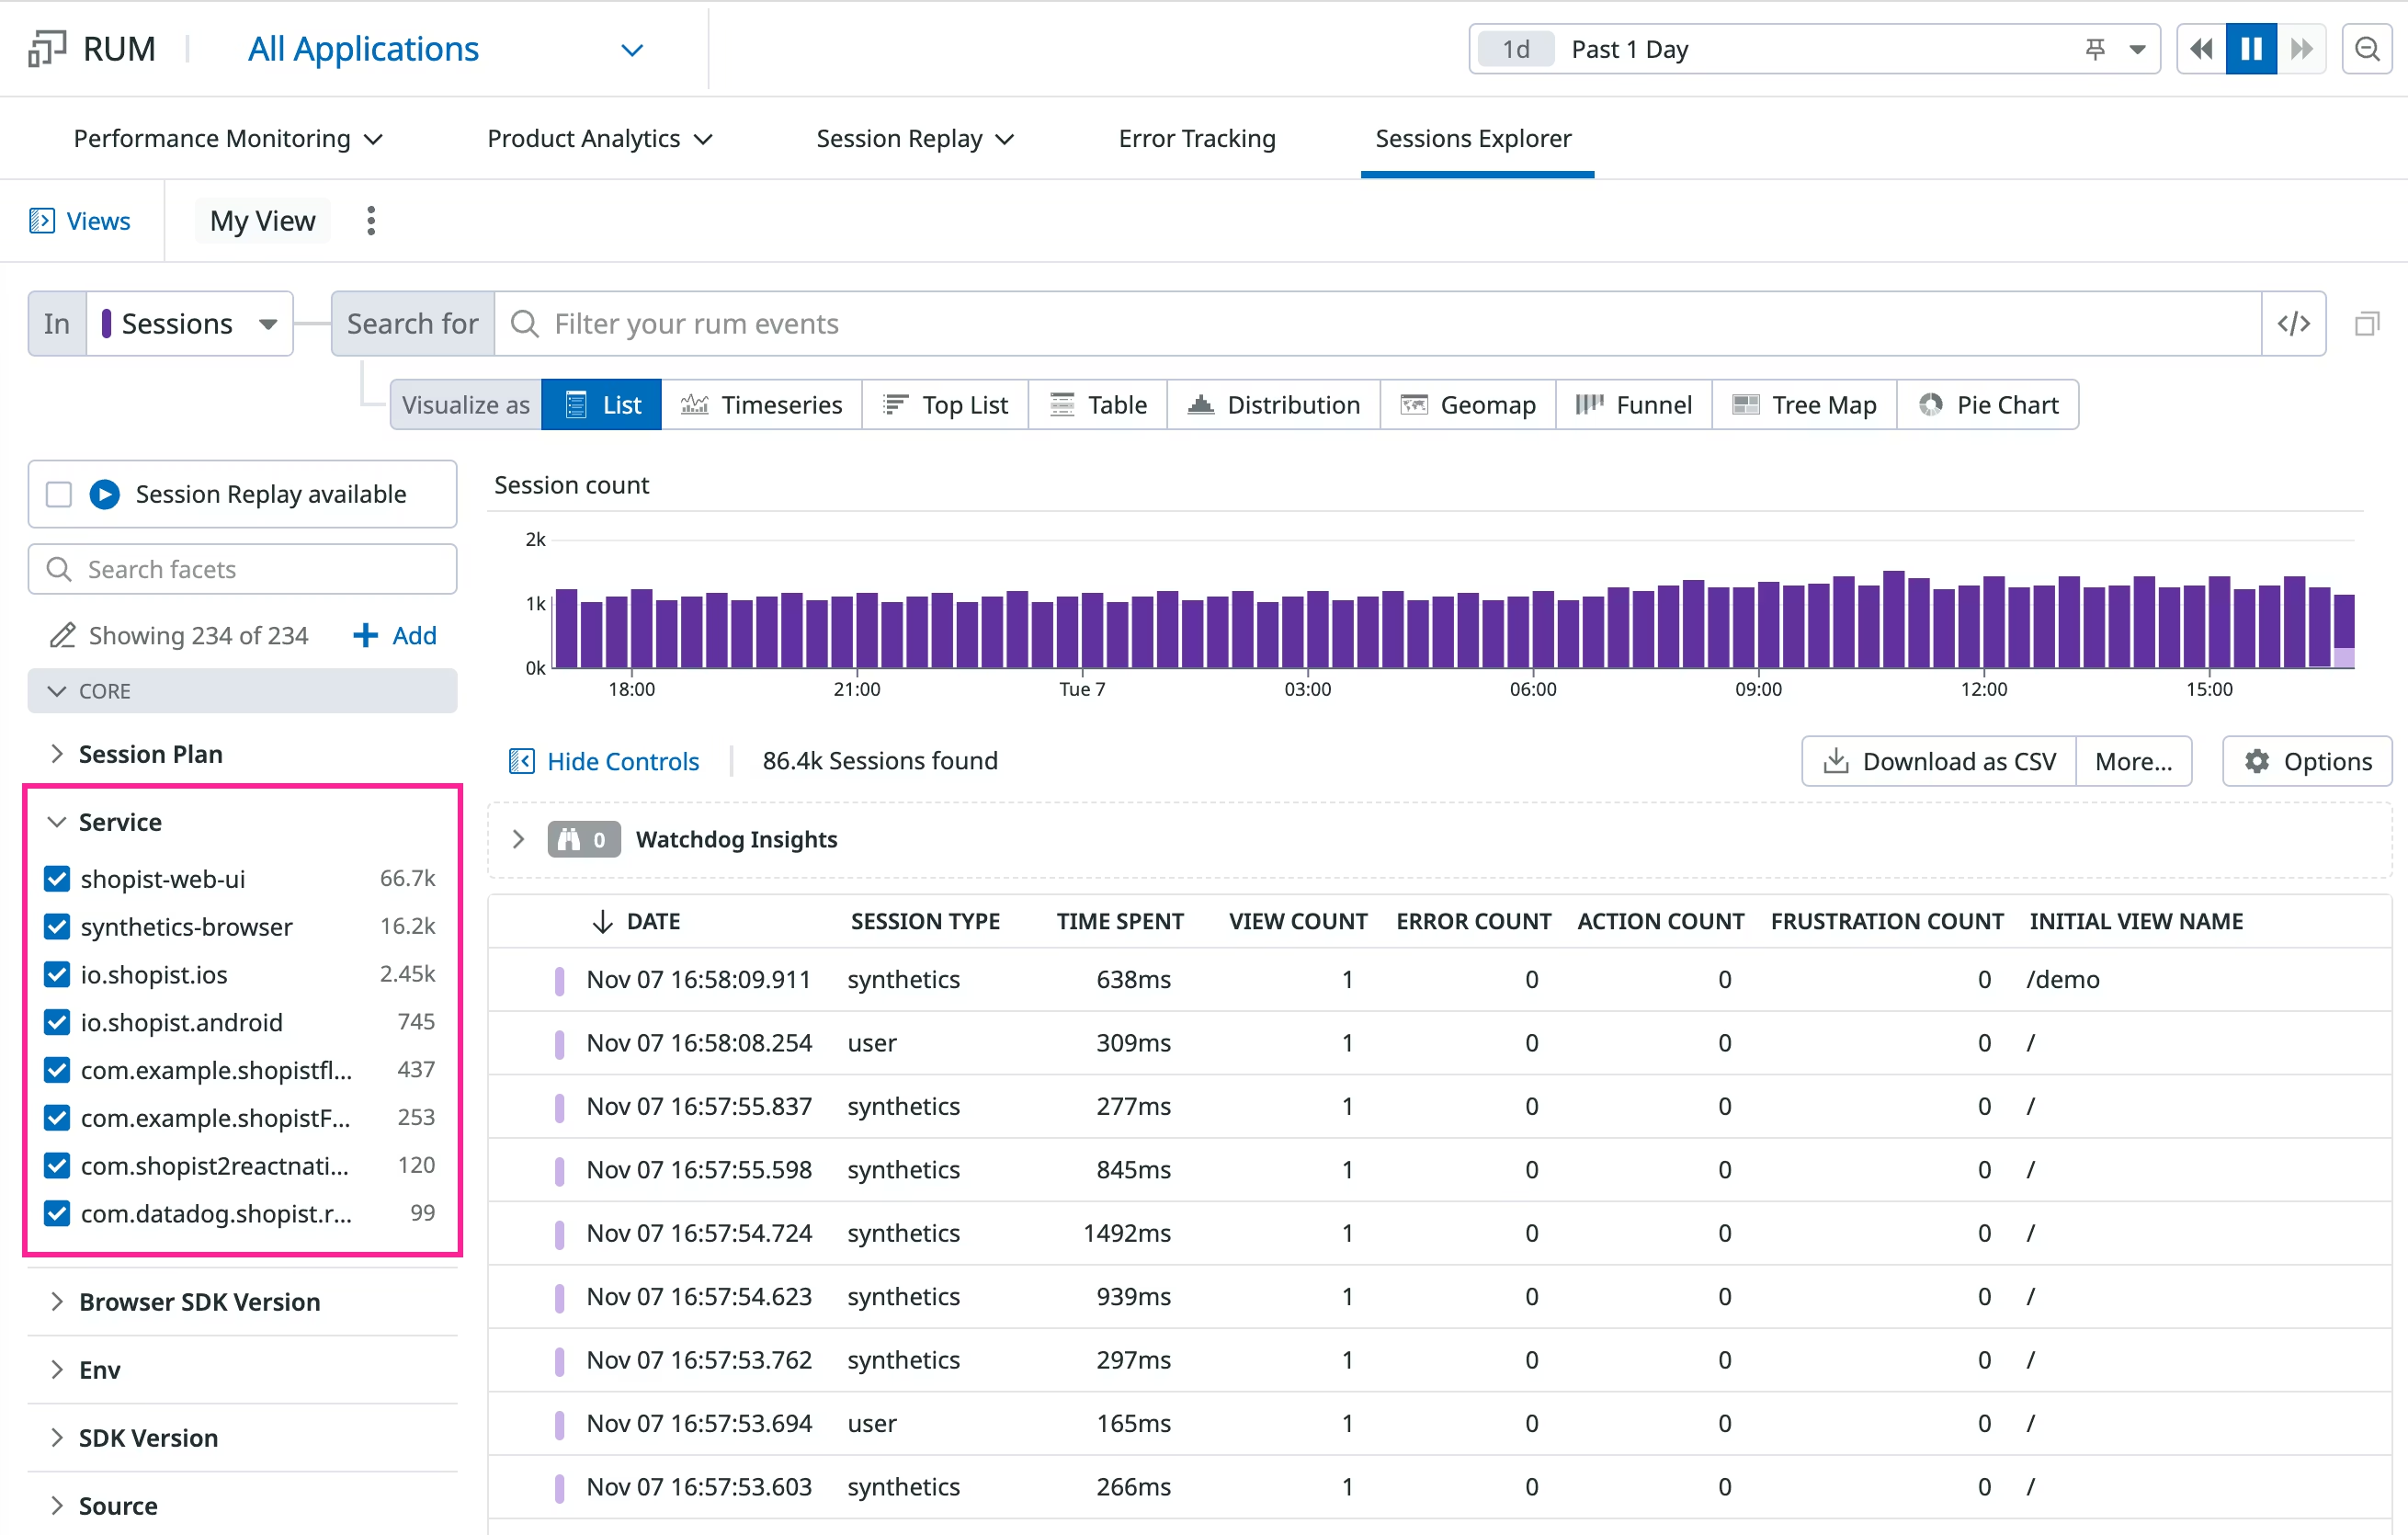
Capabilities:
- Filter sessions by tags, user attributes, performance metrics
- Pre-built visualizations and dashboards
- Click-through navigation between correlated signals (logs, traces)
- Aggregations handled through UI configuration
Limitations:
- Proprietary syntax (doesn't transfer to other tools)
- Complex analytics require multiple UI steps
- Limited programmatic access for automation
- Export options constrained by UI
DataDog's RUM Explorer works for standard use cases and provides excellent UI-driven workflows. OpenObserve's SQL handles complex analysis, conversion funnels, cohort analysis, and business metric correlation with programmatic export.
OpenObserve SQL for RUM
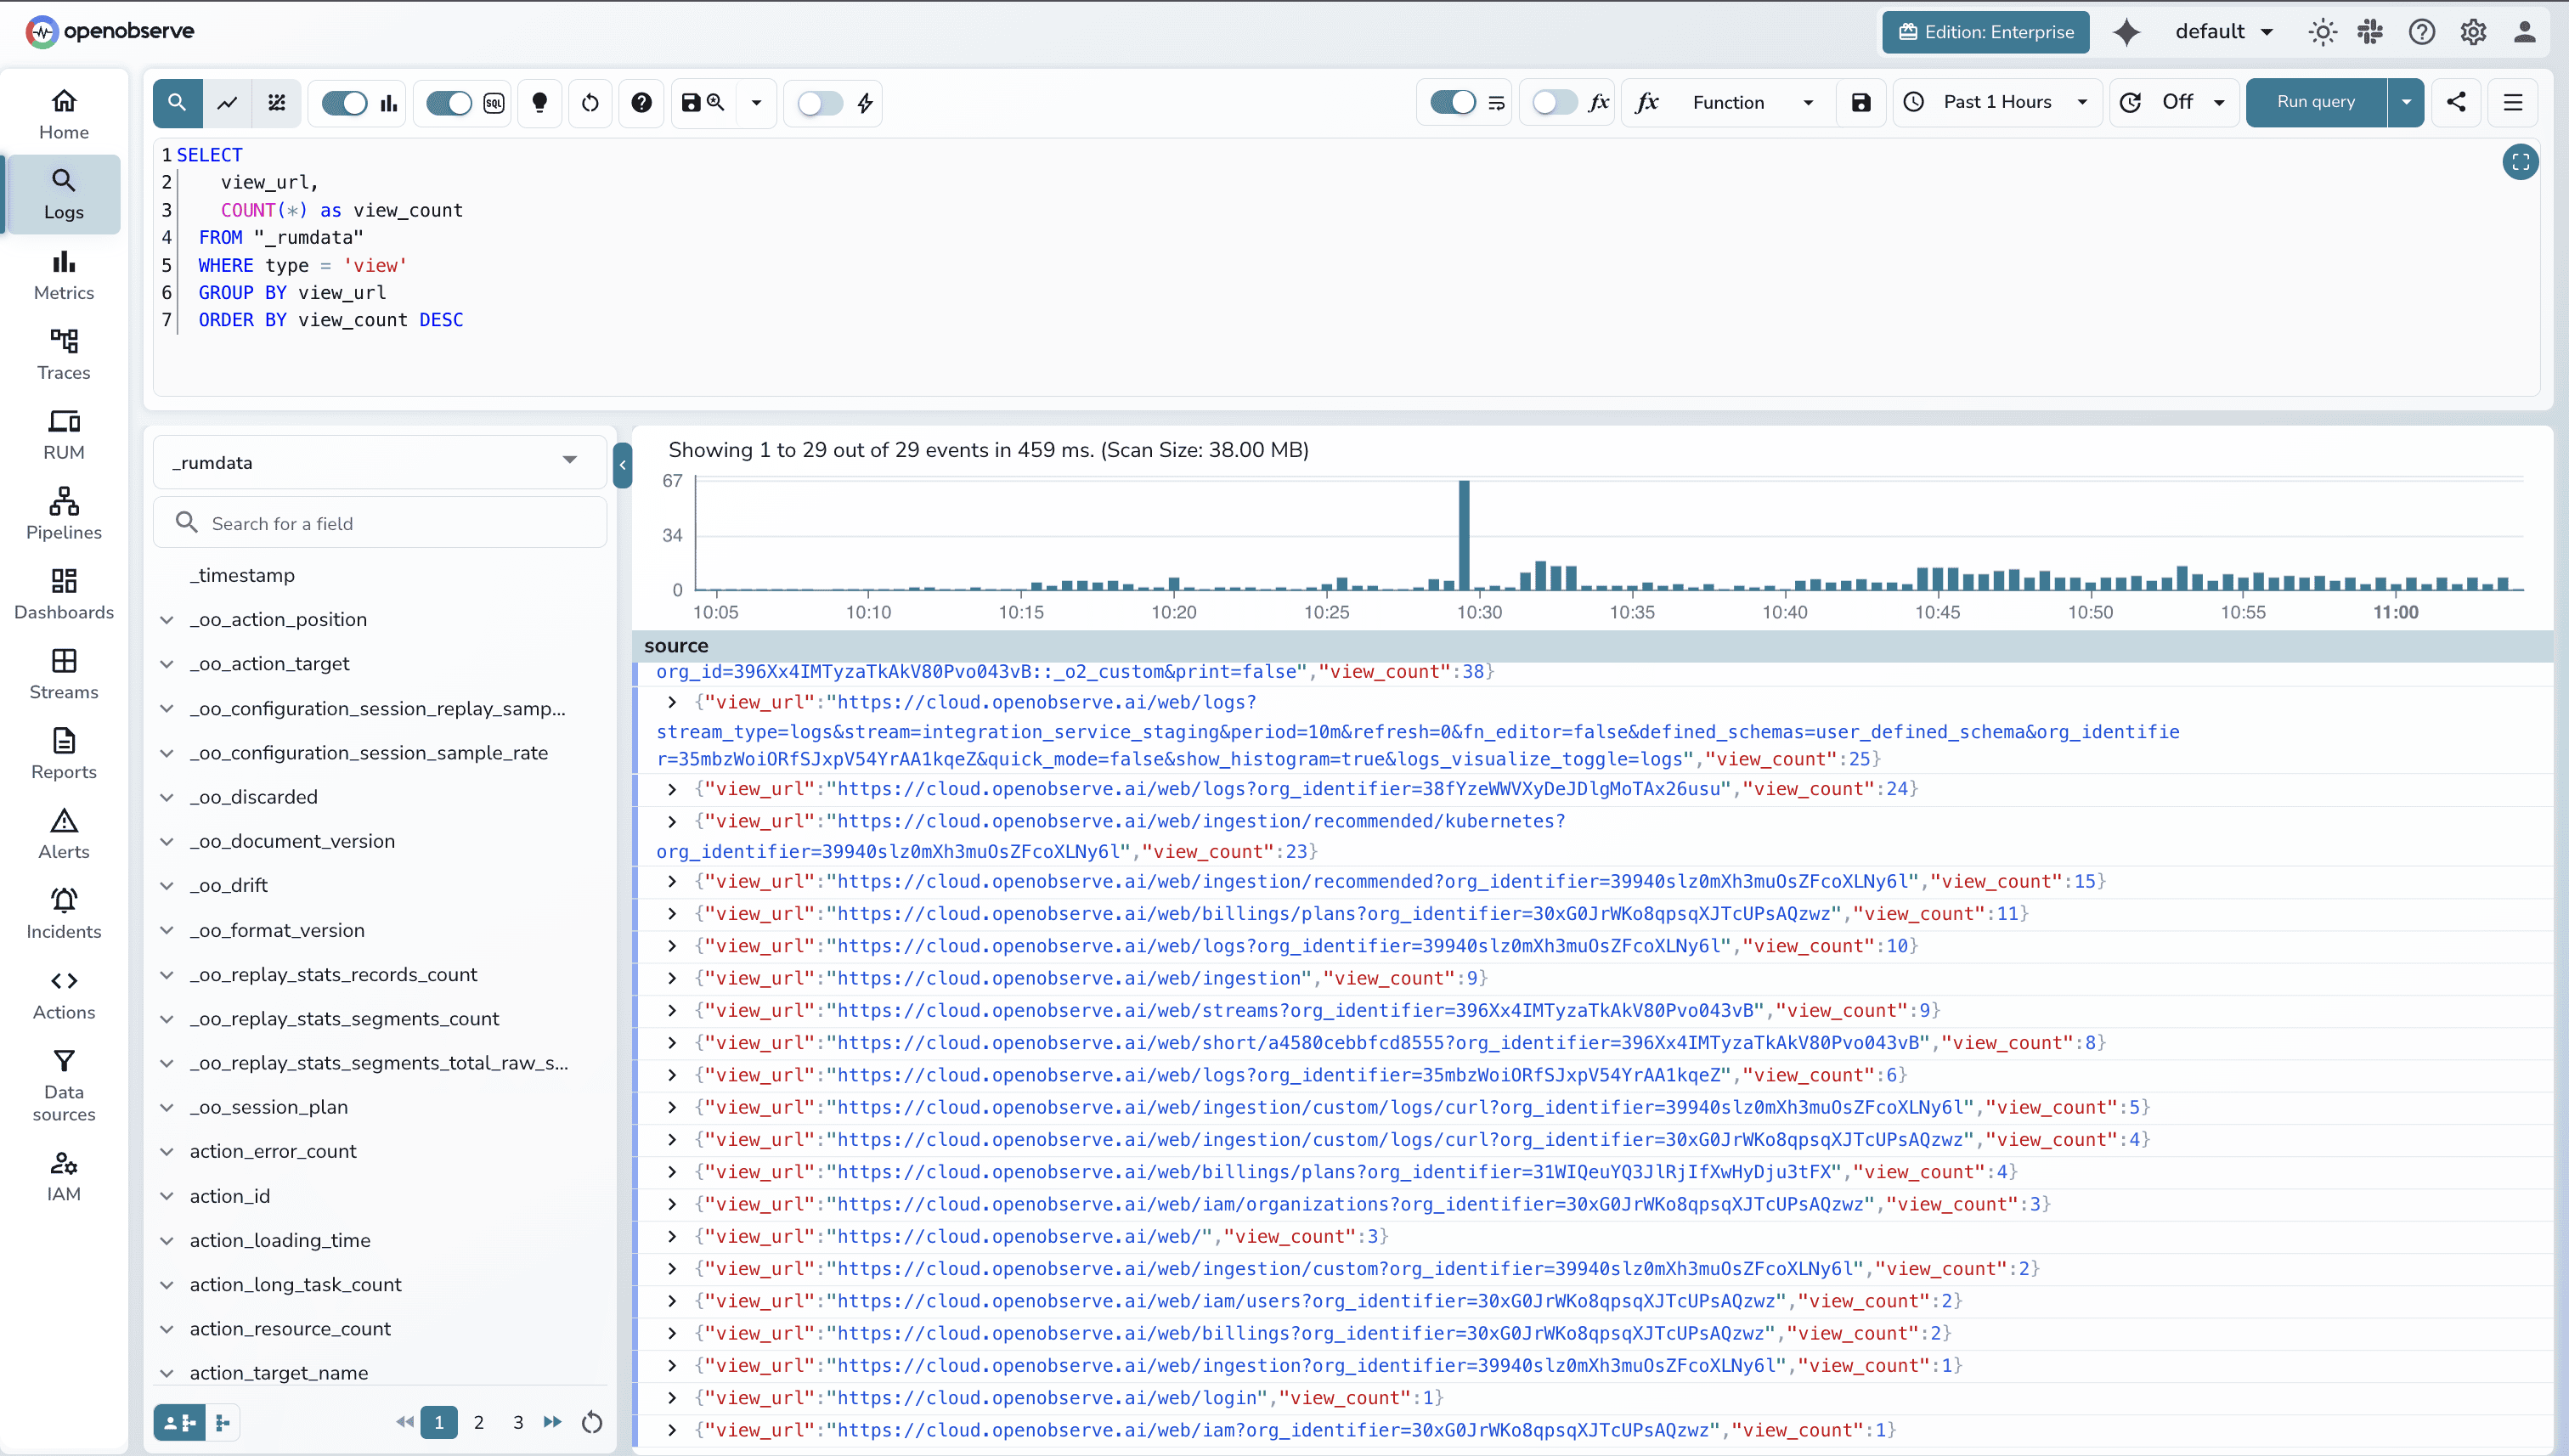
OpenObserve treats RUM data as structured tables queryable via SQL:
Simple View Count by URL
ELECT
    view_url,
    COUNT(*) as view_count
  FROM "_rumdata"
  WHERE type = 'view'
  GROUP BY view_url
  ORDER BY view_count DESC
DataDog Correlation
DataDog automatically injects trace IDs, span IDs, and service information into logs for seamless correlation. When viewing a RUM session, click the Traces or Logs tabs to see correlated backend data.
How it works:
- DataDog's RUM SDK includes trace IDs in RUM events
- Correlated backend traces appear in related tabs when viewing sessions
- Navigate between signals through UI tabs
- Works well for single-session debugging
Why SQL correlation matters:
- Join RUM data with multiple backend signals in a single query
- Aggregate across signals for trend analysis and pattern detection
- Export results programmatically to BI tools or data warehouses
- Schedule automated correlation reports for daily/weekly reviews
- Build custom alerting on correlated signals (e.g., alert when frontend errors correlate with backend latency spikes)
Advanced Features
Both platforms provide:
- View Context Management: Set view-specific context for Single Page Applications (SPAs) with route tracking
- Custom Timings: Measure application-specific operations beyond standard Web Vitals (API calls, checkout steps, data processing)
- beforeSend Hook: Intercept, modify, or discard events before sending (URL sanitization, error filtering, custom context enrichment)
- Tracking Consent Management: GDPR/privacy compliance with
trackingConsentconfiguration - Sampling Strategies: Control data volume through session sampling and conditional replay recording (critical pages, error sessions)
Quick Comparison
| Capability | DataDog | OpenObserve |
|---|---|---|
| SDK Setup | npm packages, standard config | npm packages, standard config |
| Core Web Vitals | LCP, INP, CLS tracked automatically | LCP, INP, CLS tracked automatically |
| Session Replay | Yes, with privacy masking | Yes, with privacy masking |
| Frustration Signals | Rage clicks, dead clicks, error clicks | Error tracking (frustration signals roadmap) |
| Query Language | Proprietary RUM Explorer syntax | SQL for all RUM data |
| Conversion Funnels | Through UI configuration | SQL queries (unlimited flexibility) |
| Cohort Analysis | Through UI filtering | SQL window functions, CTEs, subqueries |
| User Segmentation | RUM Explorer filters | SQL GROUP BY with custom dimensions |
| Backend Correlation | UI tabs (single session focus) | SQL joins (aggregate analysis) |
| Data Export | Limited export through UI | SQL export to any BI tool |
| Custom Dashboards | RUM Explorer + drag-and-drop | SQL queries + visualizations |
| Programmatic Access | Limited API access | Full SQL access via connectors |
| Automated Reporting | Through UI scheduling | SQL-based scheduled queries |
The Bottom Line
If evaluating Real User Monitoring platforms, the differentiation comes from query flexibility, correlation capabilities, and operational workflows.
OpenObserve delivers additional capabilities if:
- Your team knows SQL or wants portable query skills
- You need complex analytics: conversion funnels, cohort analysis, business metric correlation
- Cross-signal correlation through unified SQL queries is essential for debugging
- You want to export RUM data to BI tools or data warehouses via SQL connectors
- Programmatic access to RUM data is important for automation and custom workflows
- You need to correlate RUM with backend performance for full-stack analysis
OpenObserve transforms the fundamental question from "can we afford to monitor this?" to "what do we need to monitor?" The platform provides comprehensive system visibility without cost-driven compromises.
The choice comes down to query flexibility and operational workflows: UI-driven exploration (DataDog) vs SQL-based programmatic analysis (OpenObserve).
This is Part 6 in a series comparing DataDog and OpenObserve for observability (security use cases excluded):
- Full comparison
- Part 1: Logs - Automatic Field Discovery, SQL Queries, and 90% Cost Savings
- Part 2: Metrics - Drag & Drop, SQL, PromQL, High Cardinality
- Part 3: Traces/APM - OTel Native, No Hidden Tiers
- Part 4: Dashboards - Prebuilt, Drag & Drop, Custom
- Part 5: Alerts, Monitors, Destinations
- Part 6: Real User Monitoring
- Part 7: Pipelines
- Part 8: IAM SSO, RBAC
- Part 9: Cost
Sign up for a free cloud trial or schedule a demo to test OpenObserve RUM with your web application.
About the Author
Manas Sharma


Manas is a passionate Dev and Cloud Advocate with a strong focus on cloud-native technologies, including observability, cloud, kubernetes, and opensource. building bridges between tech and community.