“OpenObserve helped us migrate from Datadog in under an hour... reducing observability costs by 4x.”

4x
Lower observability cost

< 1 hour
Migrated off Datadog

Flat pricing
No month-end surprises
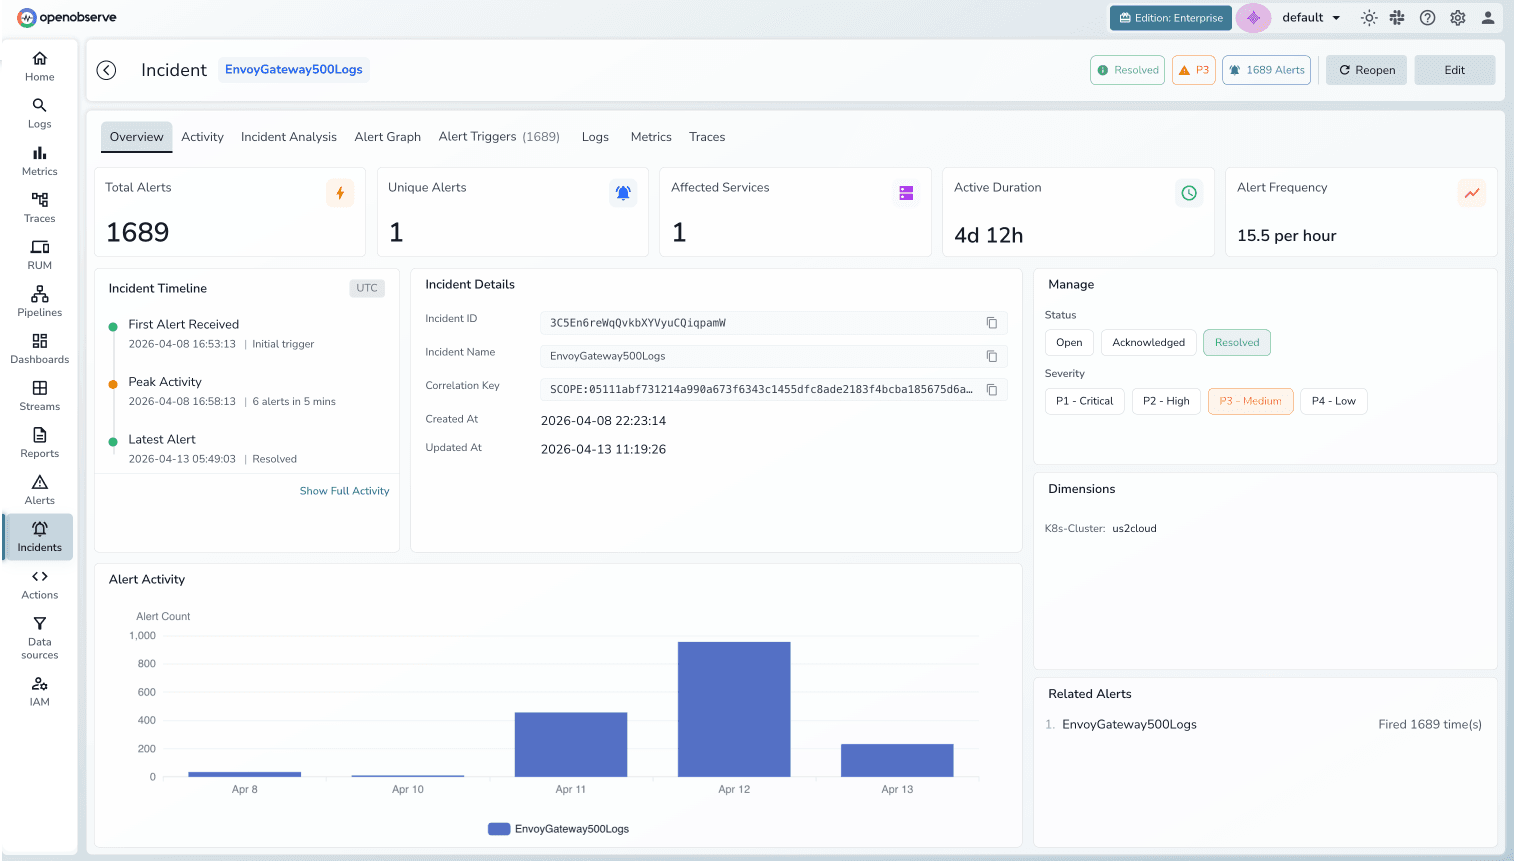
Automated investigations with full context.
Correlates logs, metrics, and traces the moment an incident fires, so your team triages and resolves with the full picture instead of piecing it together.
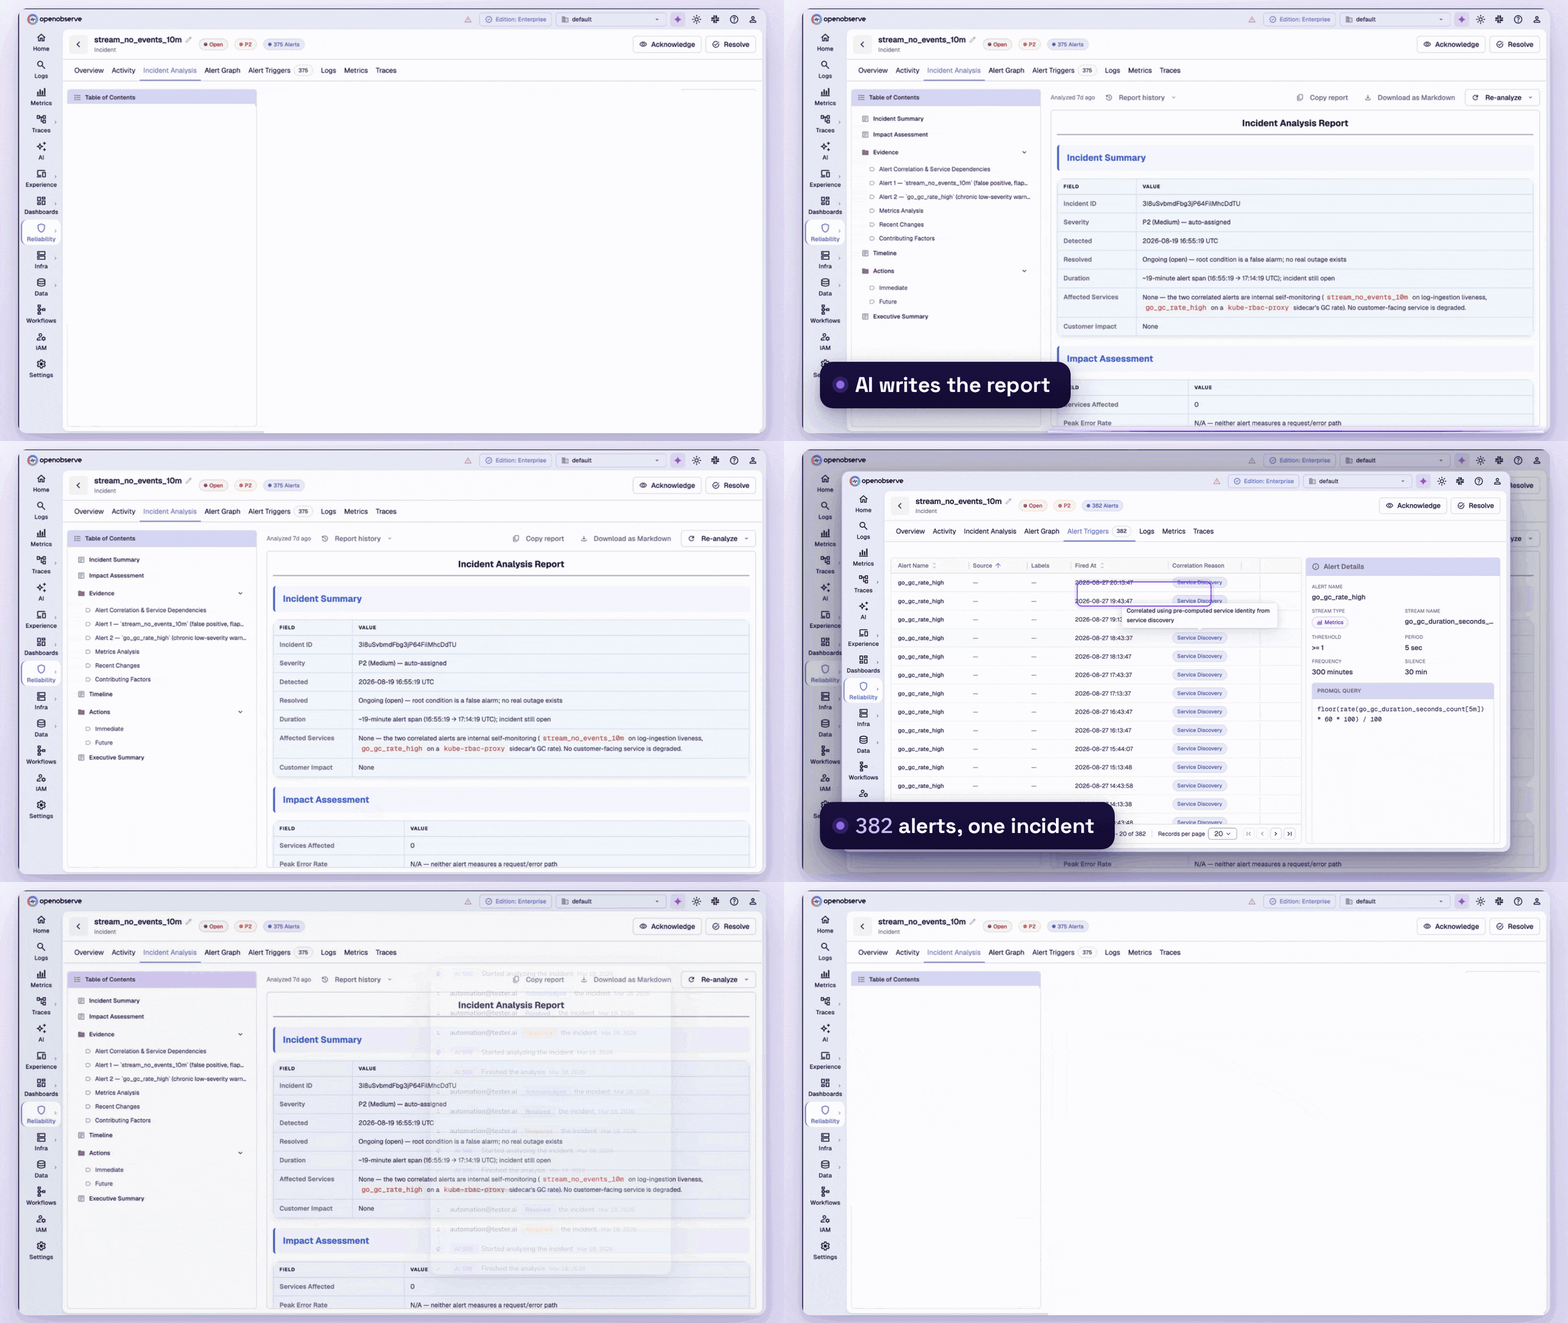
Automate investigations before your team logs in
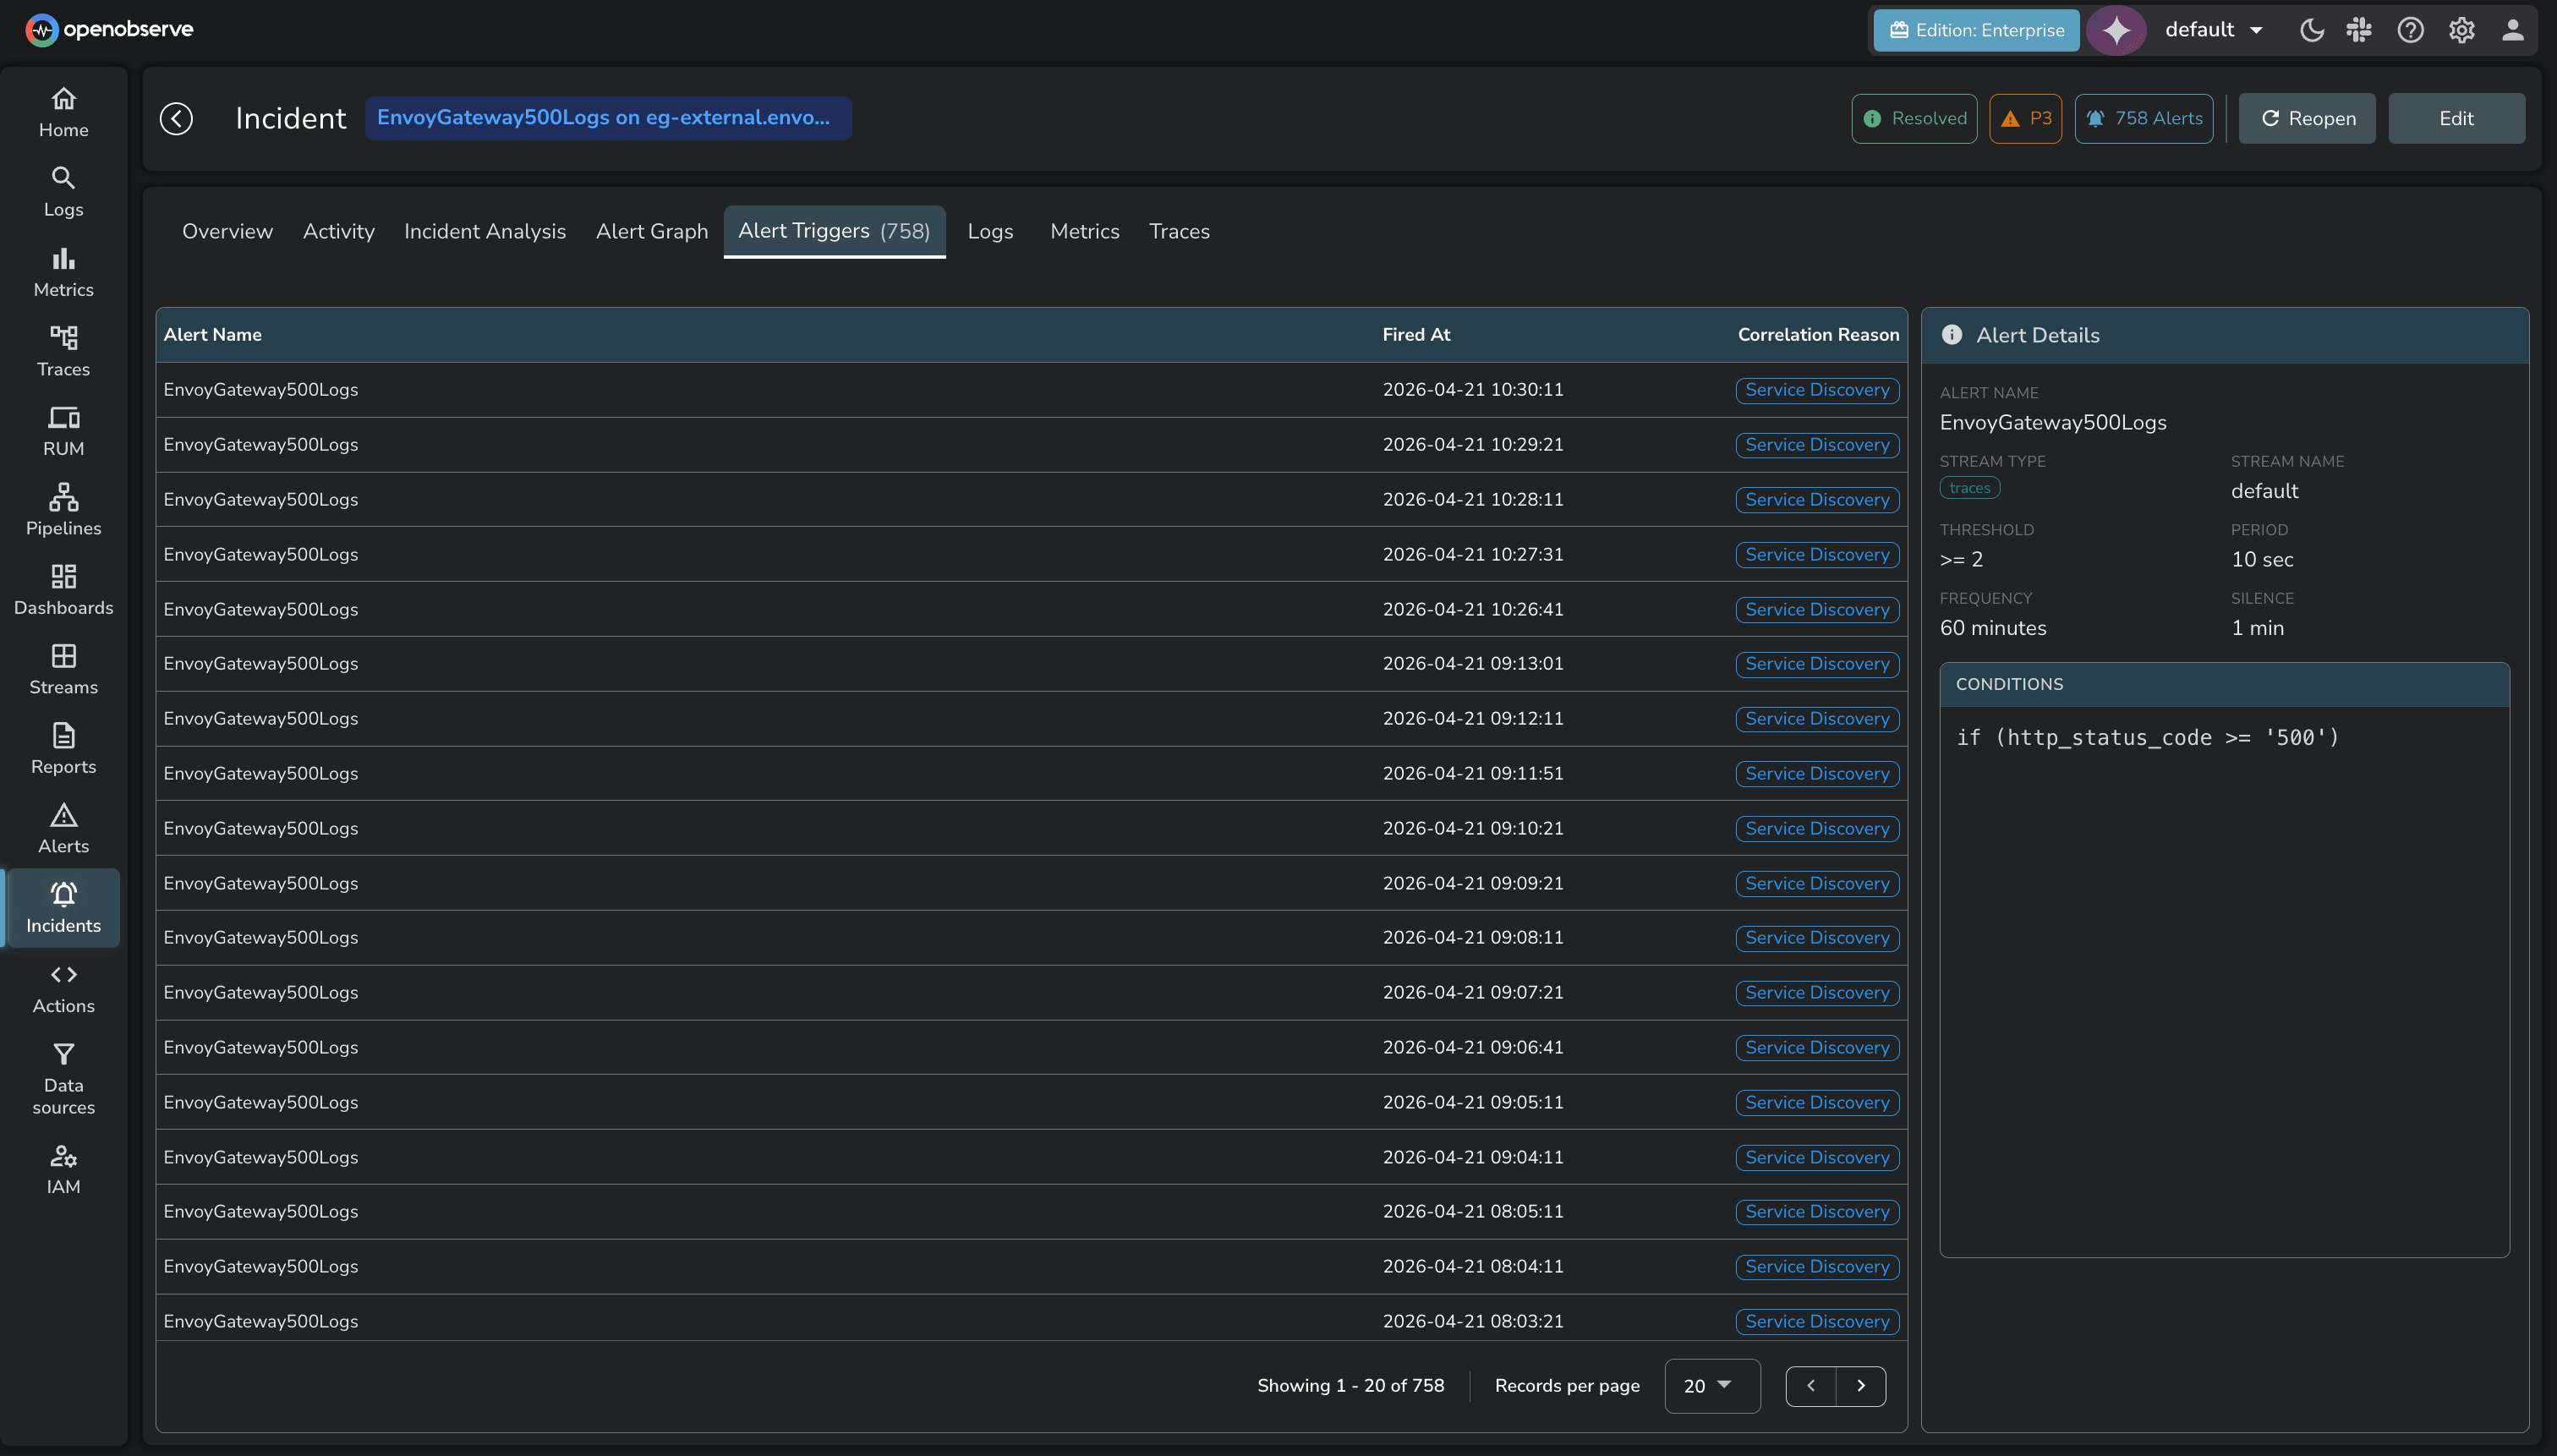
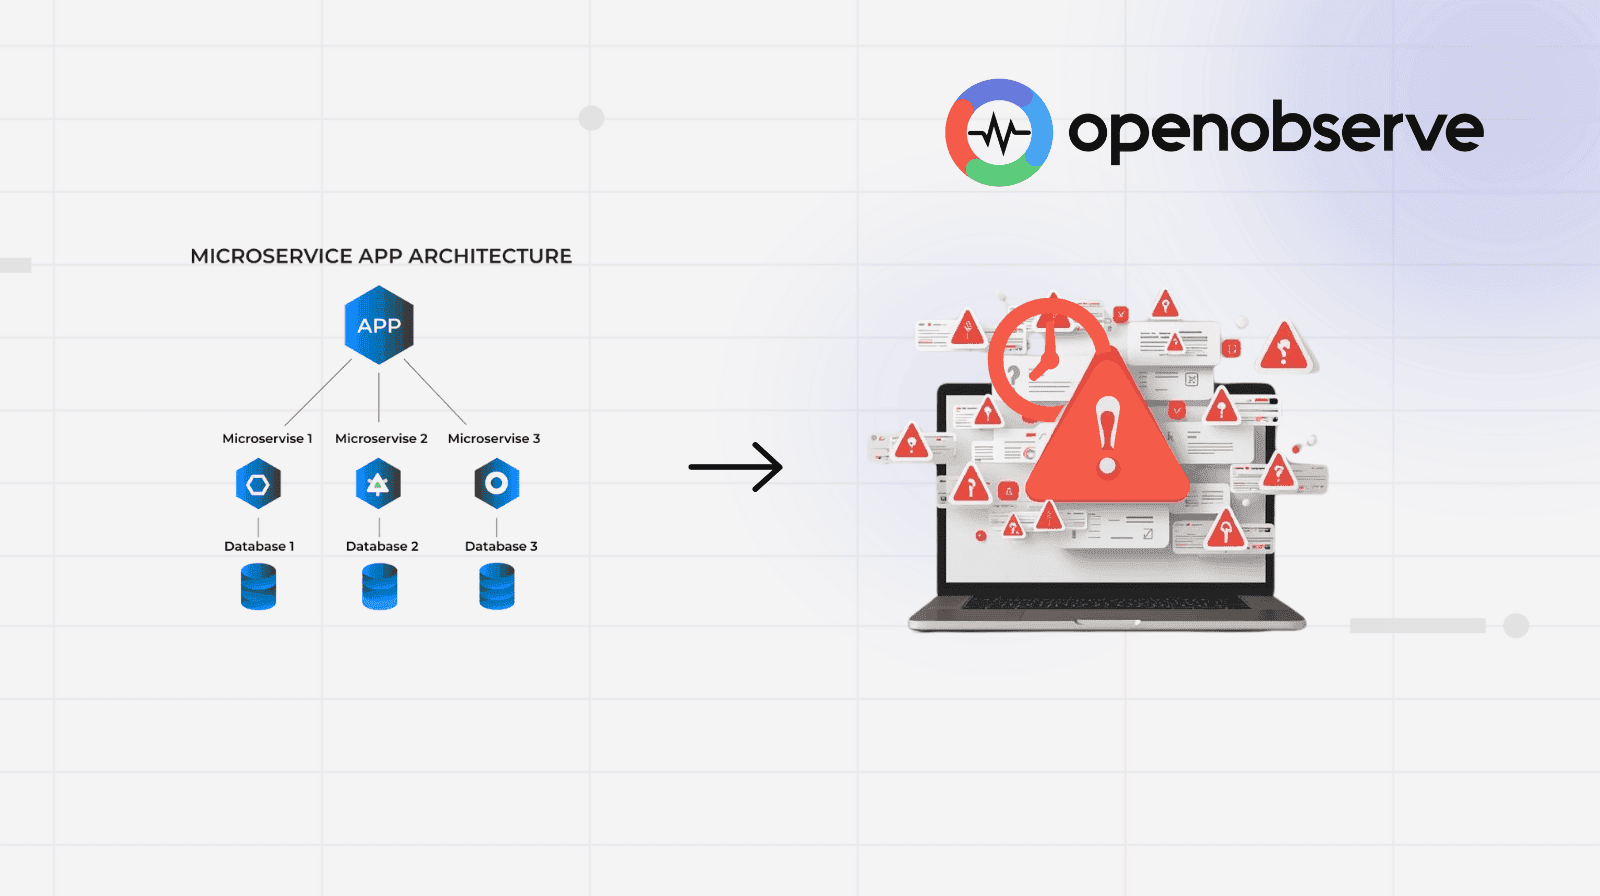
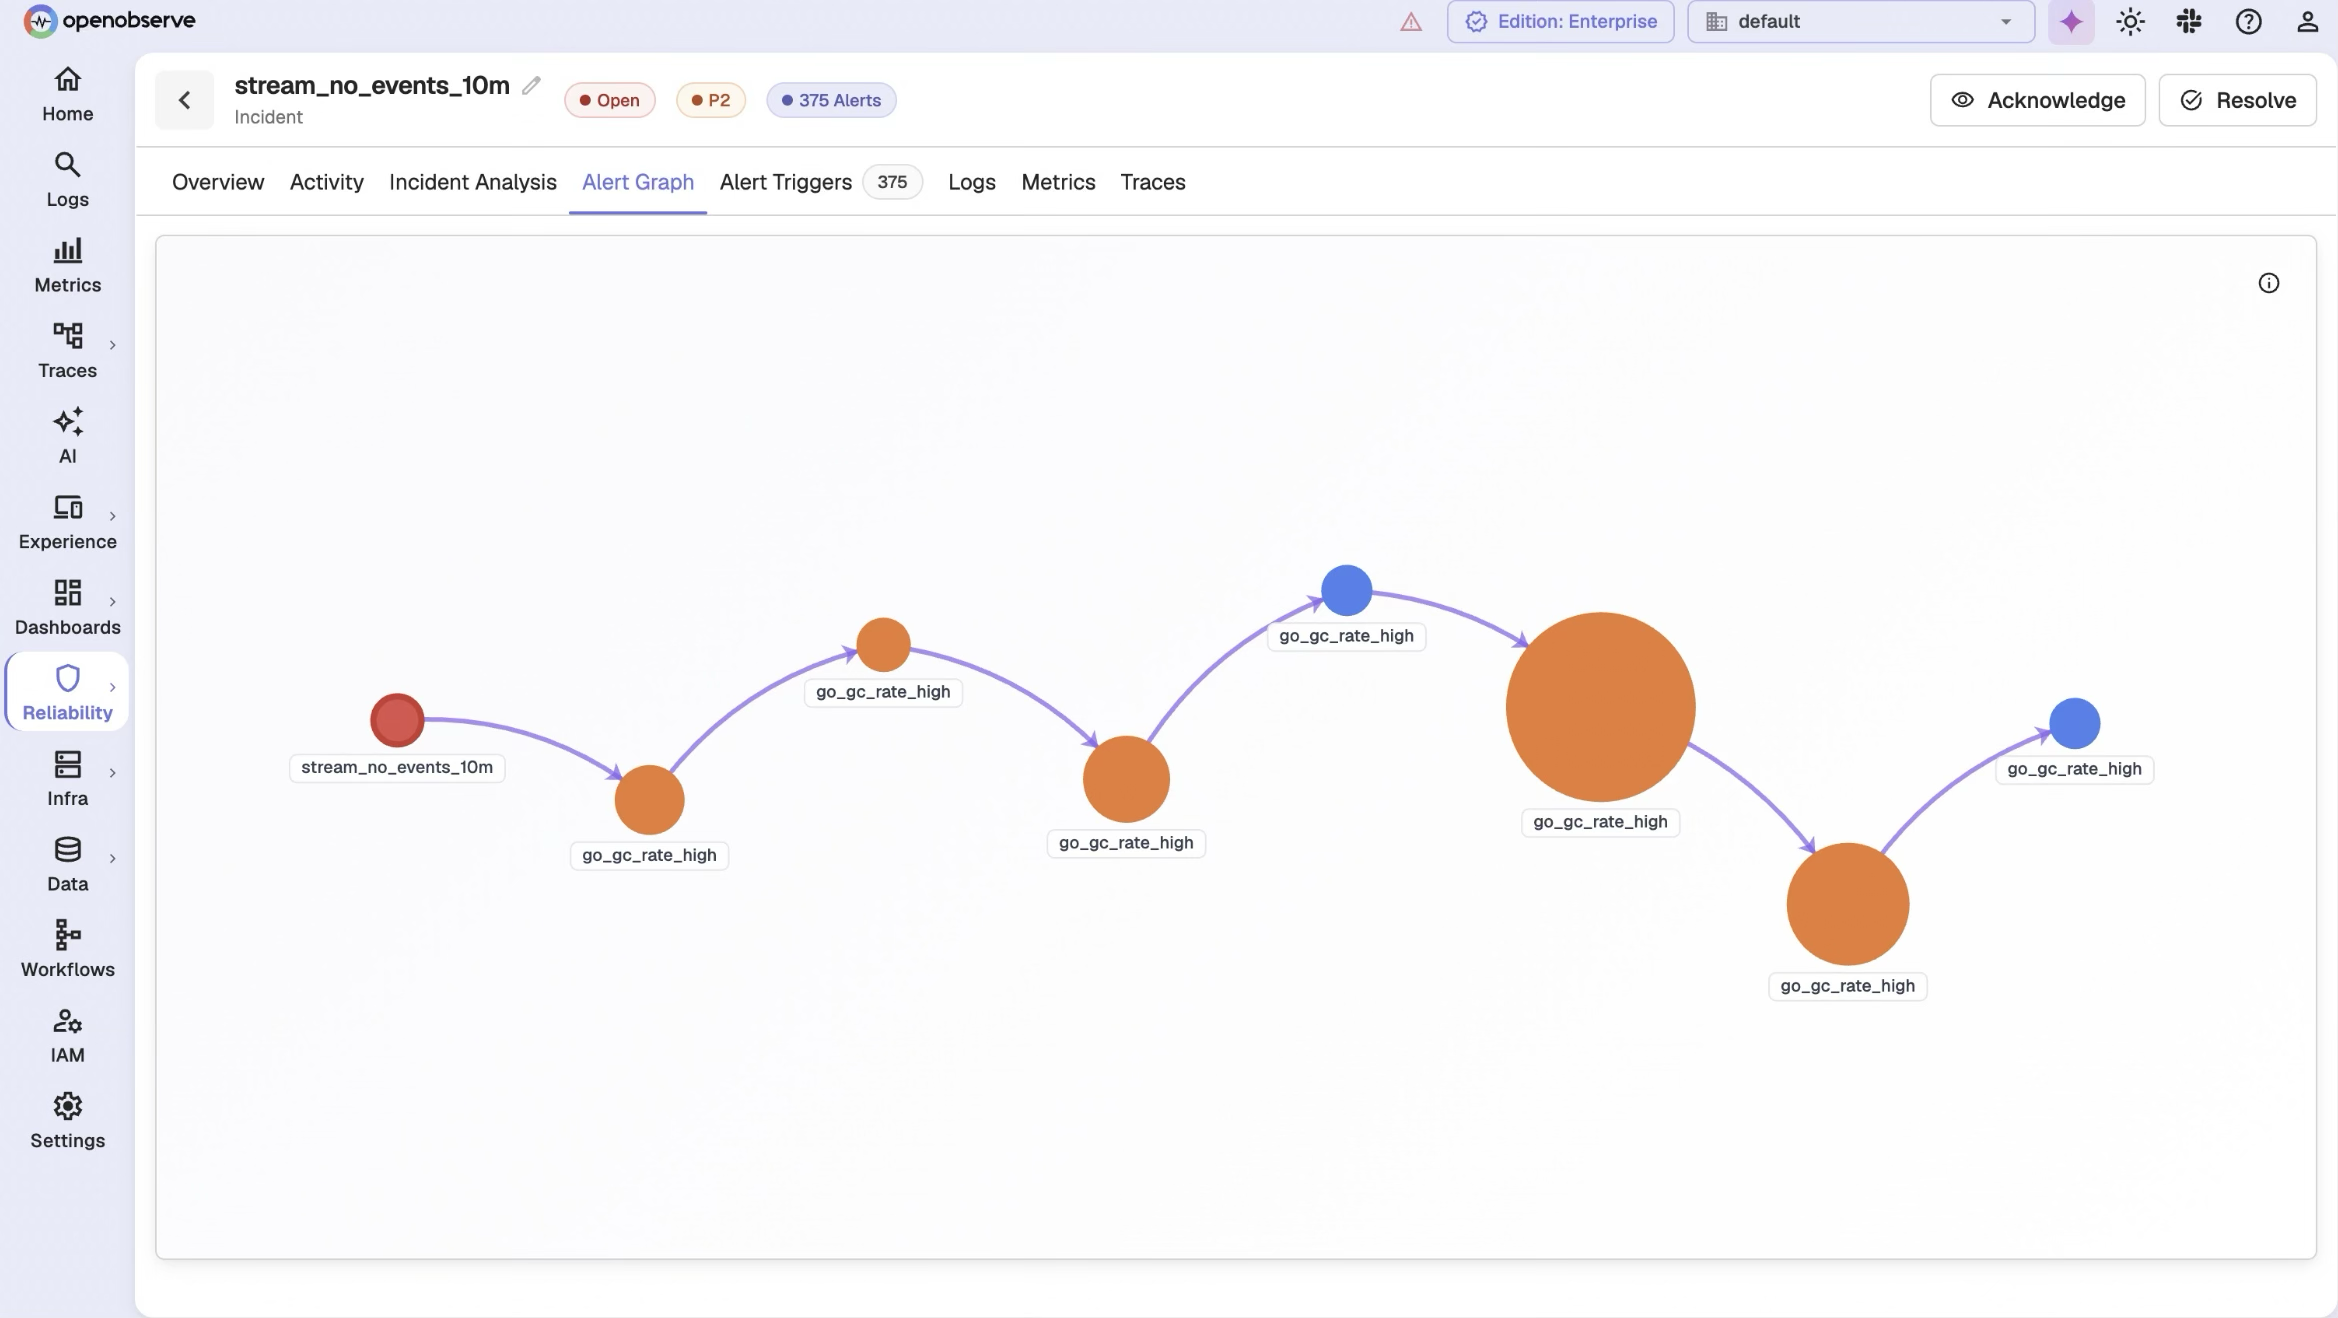
Help your team with Intelligent Alert Grouping
Retain perfect memory of all past incidents.
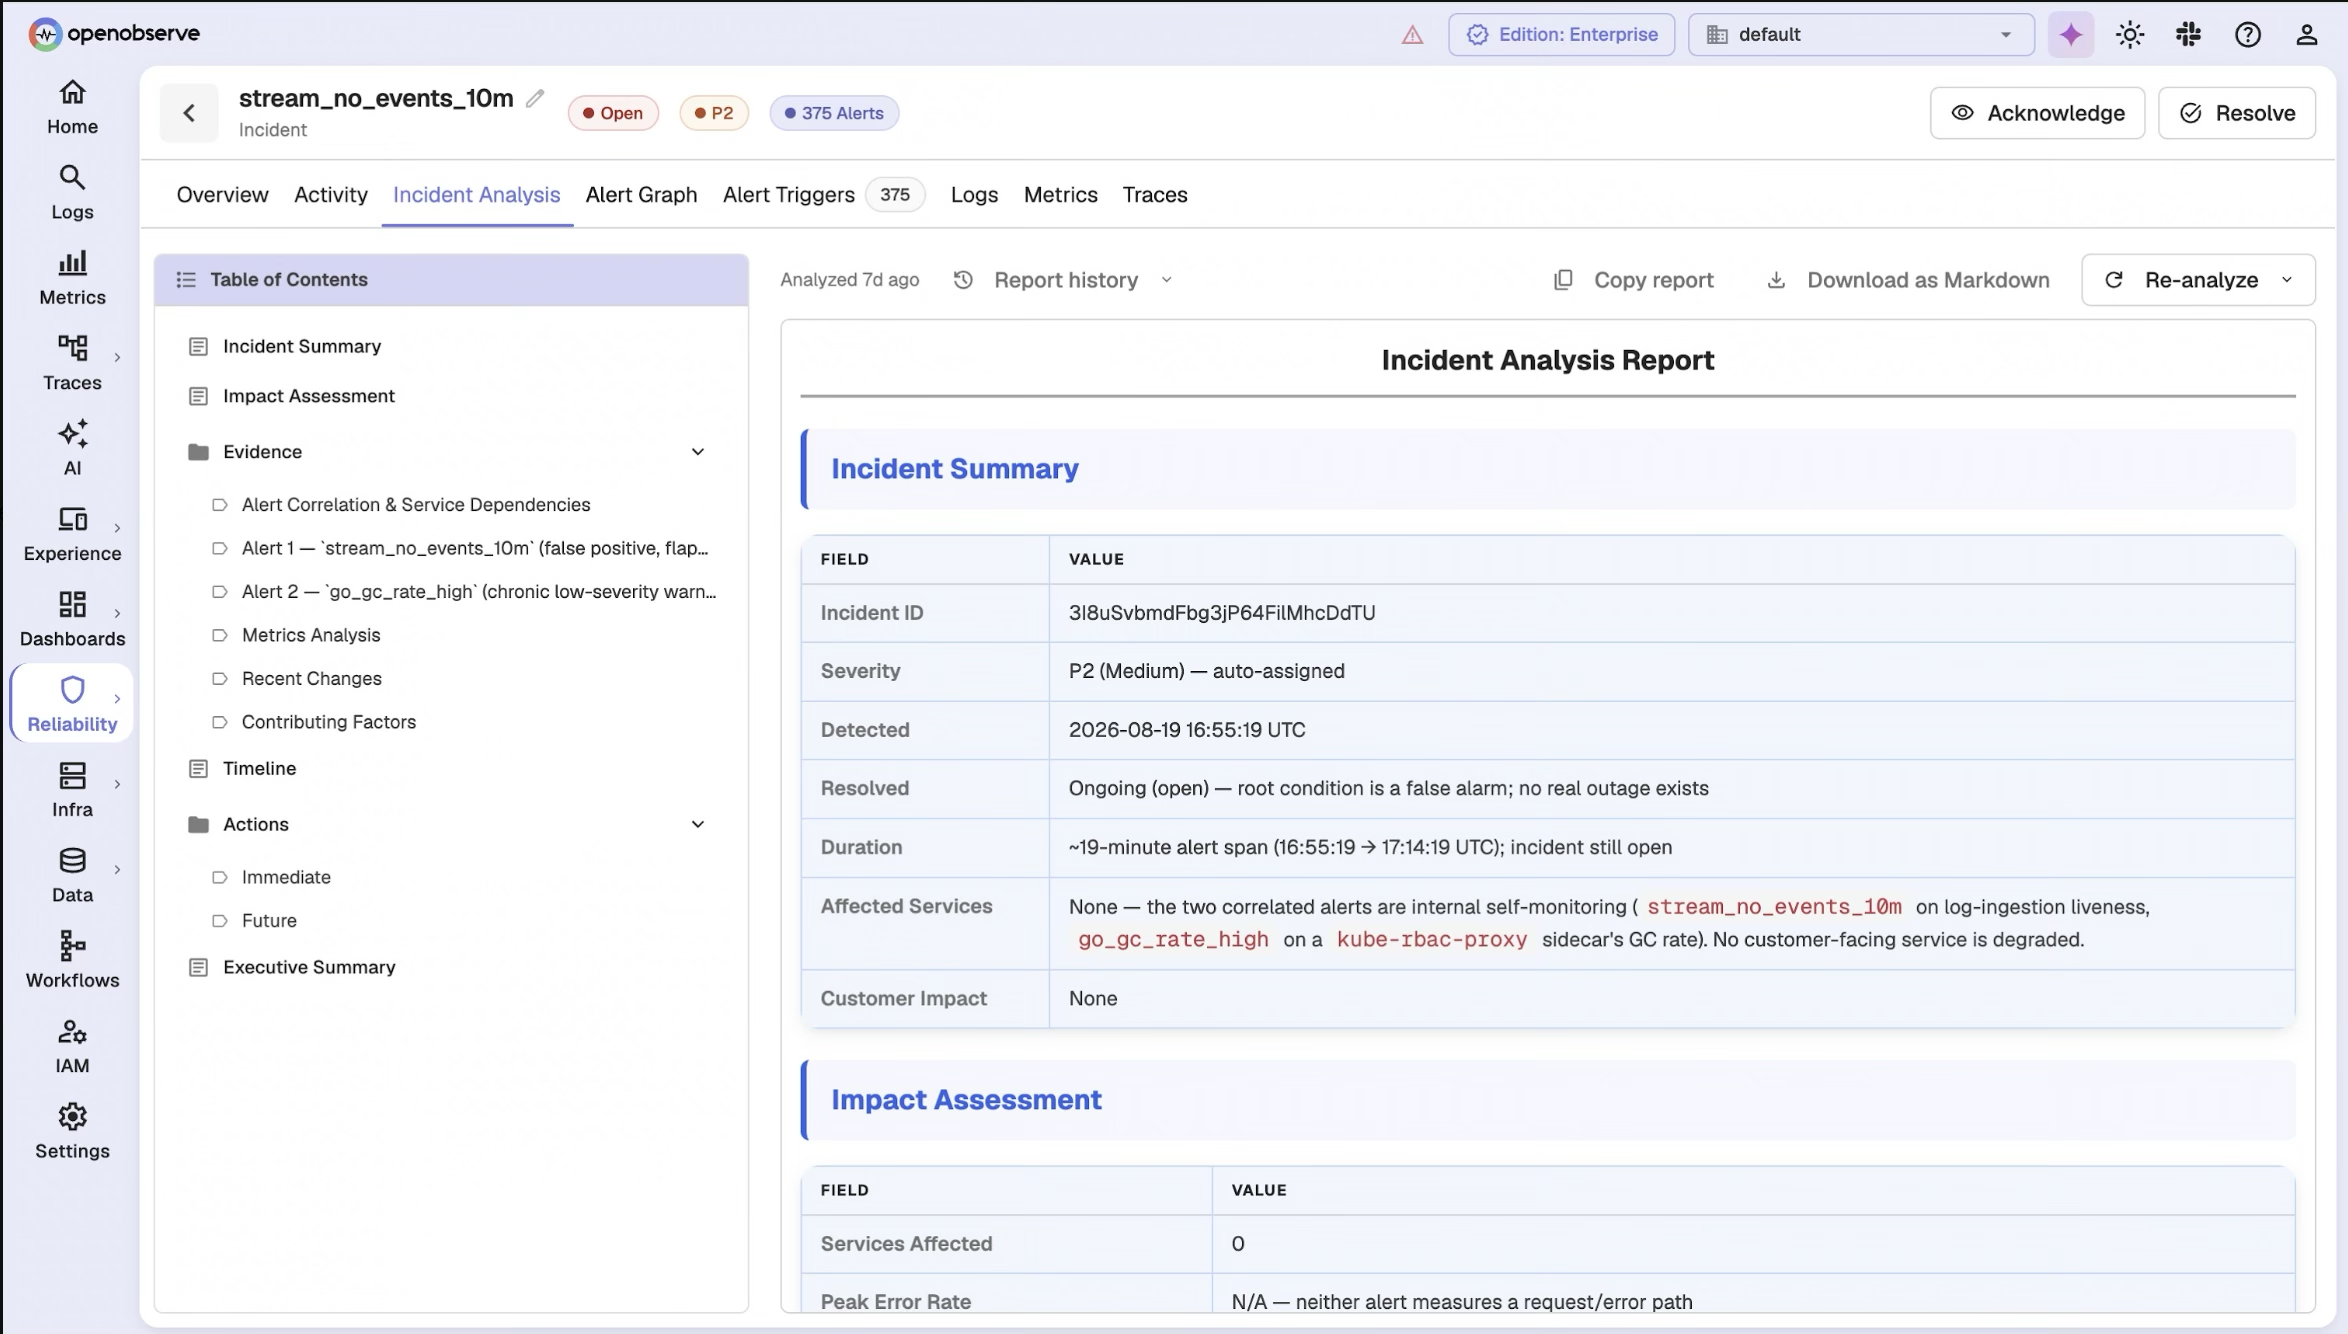
Structure every finding into contributing factors, incident timelines, immediate actions, and long-term prevention.
Correlate logs, metrics, and distributed traces in real time to map symptoms to underlying causes across your topology.
Group related alerts into single incidents automatically, reducing your total incident count by 50% from day one.
Group alerts by cluster, namespace, and deployment. Refine incidents automatically as new signals arrive within a 30-minute window.
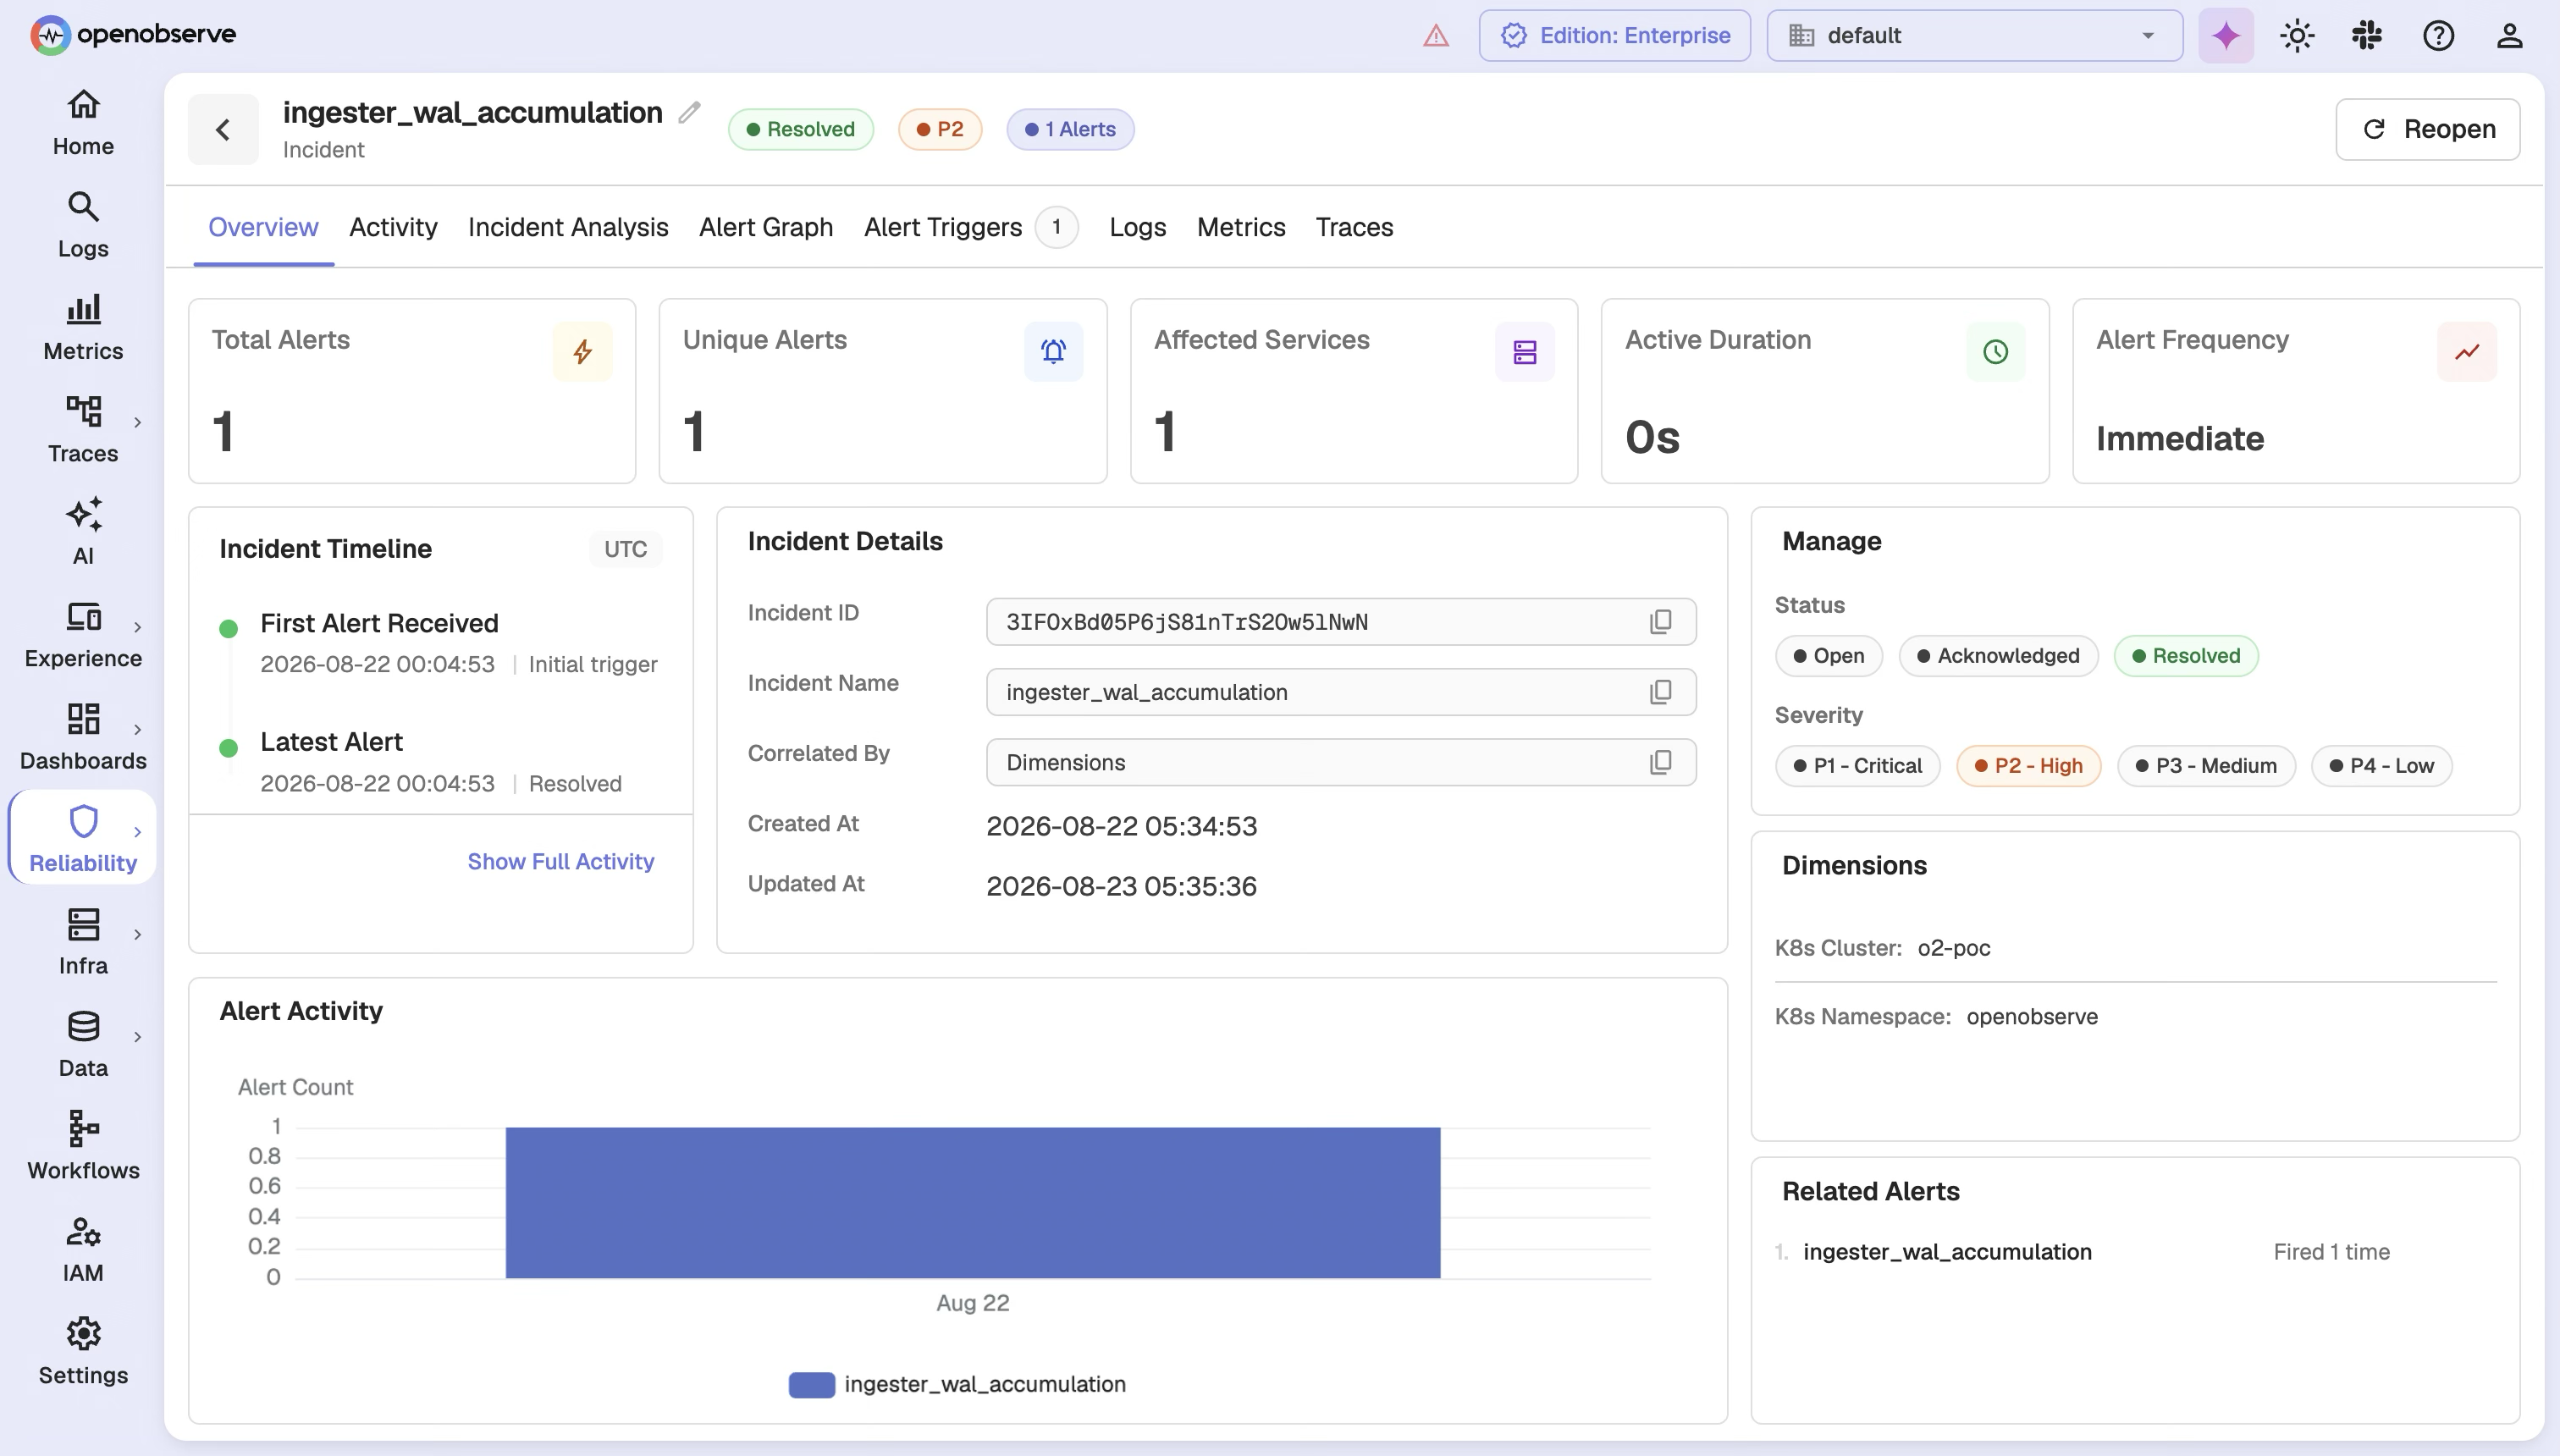
Reference past incidents to inform real-time analysis, applying proven fixes from up to 1,000 past incidents instead of starting from scratch.
Enrich your knowledge base with every resolved incident, training accuracy improvements automatically.

Generate comprehensive reports with root cause, contributing factors, and a complete timeline alongside evidence links.
Standardize root cause analysis across your organization, eliminating tribal knowledge and undocumented fixes.
Same telemetry, same workloads, one platform. Every number is OpenObserve against a named vendor - not an industry average.
vs. Datadog
8×
more cost-effective
8x cost reduction means you can unify your observability into a single platform.
Read case studyvs. Elastic
140×
storage efficiency
140x storage means longer retention doesn't necessarily mean expensive bills.
Read case studyvs. Grafana stack
5–15×
faster performance
5x to 15x faster queries mean dashboards load in milliseconds, not minutes.
Read case studySee how much you would save switching today.
Correlate between the environments and signals across various sources with OpenObserve built-in correlation engine.
“OpenObserve helped us migrate from Datadog in under an hour... reducing observability costs by 4x.”
4x
Lower observability cost
< 1 hour
Migrated off Datadog
Flat pricing
No month-end surprises
to help you get the most out of Incidents.
Try OpenObserve today for more efficient and performant observability.

AI Observability by OpenObserve
OpenTelemetry-native observability for agents and LLMs.