MCP Servers for Observability: Connect AI Assistants to Logs, Metrics, and Traces




Ready to get started?
Try OpenObserve Cloud today for more efficient and performant observability.
MCP Servers for Observability: What's Available and How to Connect Your AI Assistant to Logs
AI assistants are now part of incident response, but most still fail at one practical question: "What happened in production?"
Without access to telemetry, they return generic advice. MCP servers for observability close that gap by connecting assistants to logs, metrics, traces, alerts, and incidents through the Model Context Protocol. Teams can then ask operational questions in natural language and get answers grounded in real production data.
TL;DR
- Problem: AI assistants are blind to production observability data
- Solution: Use MCP servers for observability as a standard bridge
- Platforms: Datadog, OpenObserve, IBM Instana, OneUptime, and Grafana
- Time to start: About 2 minutes with
claude mcp add - Outcome: Faster incident diagnosis, simpler alert operations, better operator productivity
What Are MCP Servers for Observability?
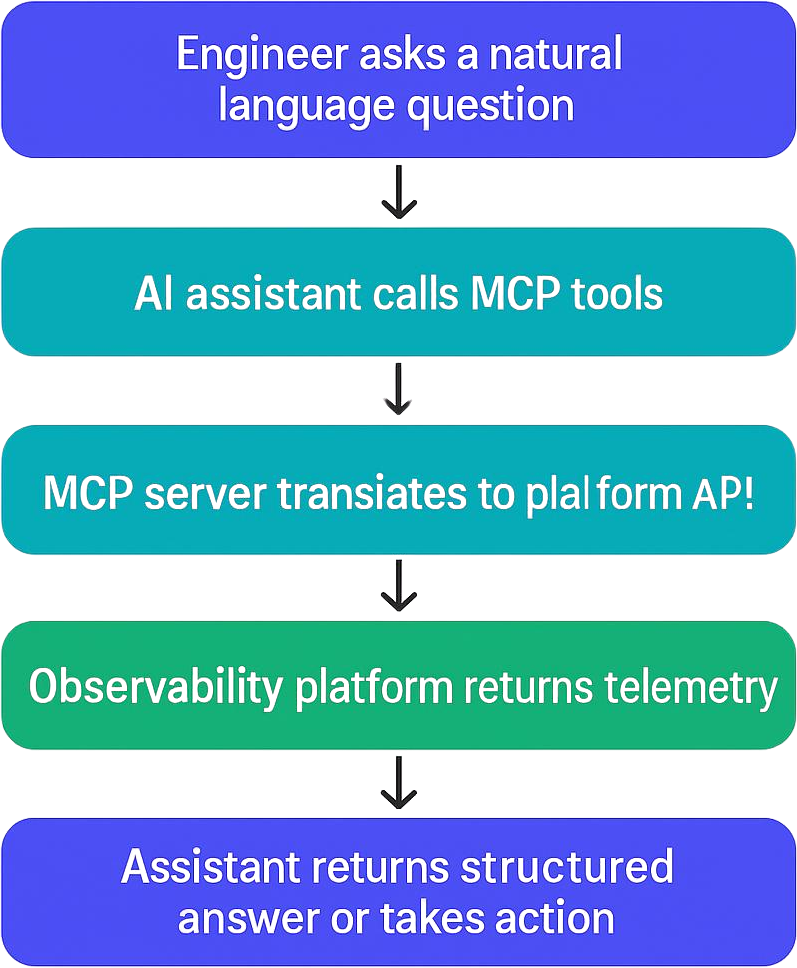
An MCP server for observability exposes telemetry capabilities as callable tools for AI assistants. Instead of manually switching dashboards, writing ad hoc SQL, and correlating timelines by hand, you can ask the assistant to fetch and analyze data for you.
How the flow works
What MCP Servers Are Available for Observability?
The main MCP servers currently available for observability are OpenObserve, Datadog, IBM Instana, OneUptime, and Grafana. Grafana ships multiple MCP server implementations: mcp-grafana (covering dashboards, Loki logs, Prometheus metrics, Tempo traces, alerting, OnCall, and incidents), a dedicated loki-mcp, a Tempo MCP server, and Grafana Cloud MCP (currently in public preview). These servers expose logs, metrics, traces, and alert operations as callable tools for AI assistants via the Model Context Protocol, making it possible to query production telemetry in natural language from any compatible client.
| Platform | MCP Support | Query Depth | Alert Ops | Dashboard Ops | Deployment Model | Open Source |
|---|---|---|---|---|---|---|
| OpenObserve | Yes | Logs, metrics, traces via AI and SQL | Full CRUD | Yes | Cloud and self-hosted | Yes |
| Datadog | Yes | Strong query and incident context | Monitor management | Limited write scope | Cloud | No |
| IBM Instana | Yes | Trace-centric workflows | Limited | Limited | Cloud and on-prem | No |
| OneUptime | Yes | Status and incident-focused | Yes | Limited | Cloud and self-hosted | Yes |
| Grafana | Yes (mcp-grafana, loki-mcp, Tempo MCP; Cloud in preview) | Dashboards, Loki logs, Prometheus metrics, Tempo traces | Full rule management | Yes | Cloud and self-hosted | Yes |
When choosing among MCP servers for observability, evaluate:
- deployment flexibility (cloud-only vs self-hosted),
- feature completeness (query-only vs full operations),
- governance/security model,
- and cost model at your expected telemetry volume.
Real-World Use Cases
1) Faster incident diagnosis
You can ask: "What caused the latency spike in checkout at 2 AM?"
The assistant can pull errors, latency trends, and trace outliers, then summarize likely causes.
For teams optimizing response time, this pairs well with mean time to resolution best practices.
2) Natural-language alert operations
You can ask: "Create an alert when p95 latency is above 500 ms for 5 minutes in payment service."
With supported platforms, the assistant can create or update alert conditions directly.
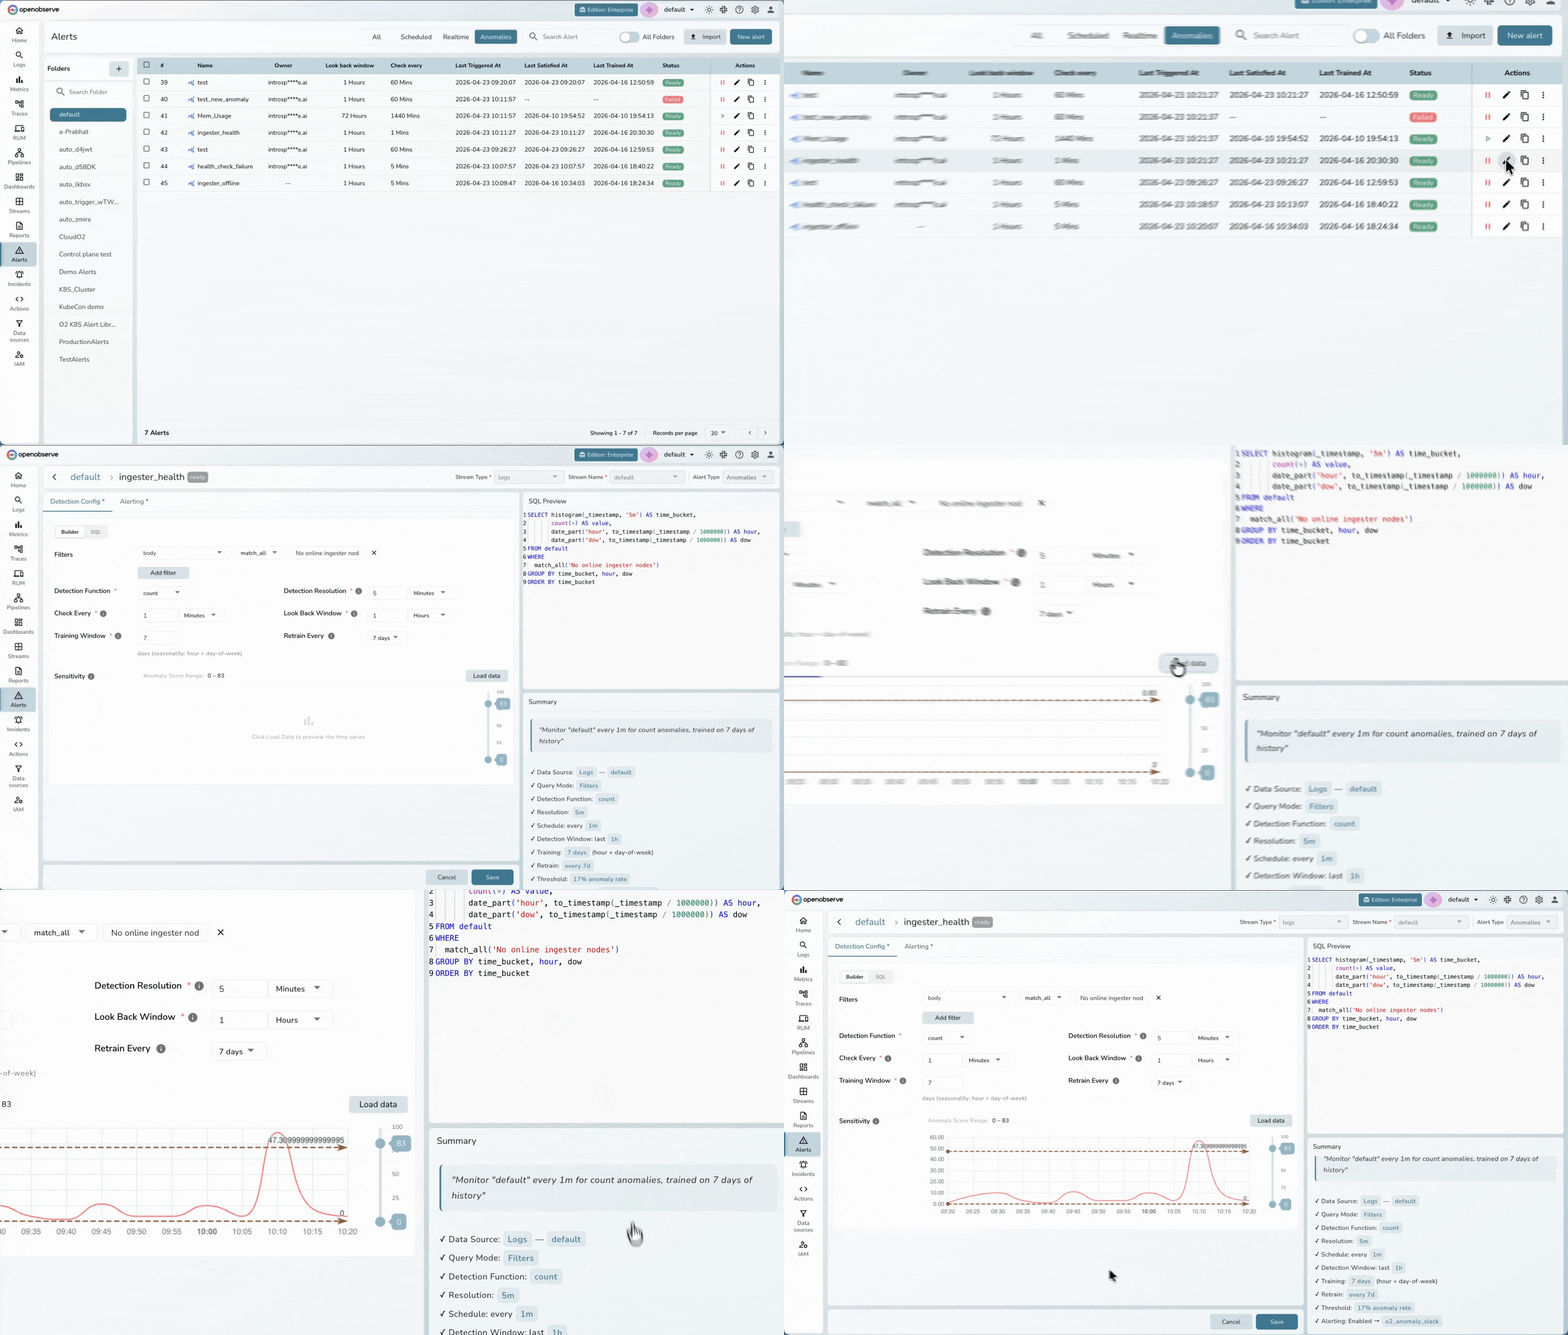
3) Pattern and anomaly investigation
You can ask: "Find unusual checkout errors from the last 7 days."
This workflow becomes stronger when combined with AI anomaly detection patterns.
4) Cost-aware observability workflows
MCP-driven querying is powerful, but data volume still affects cost.
If you process high-cardinality telemetry, review OpenTelemetry cost optimization strategies.
5) Agentic observability workflows
For teams building custom assistants and orchestration flows, combine MCP with AI agent monitoring patterns.
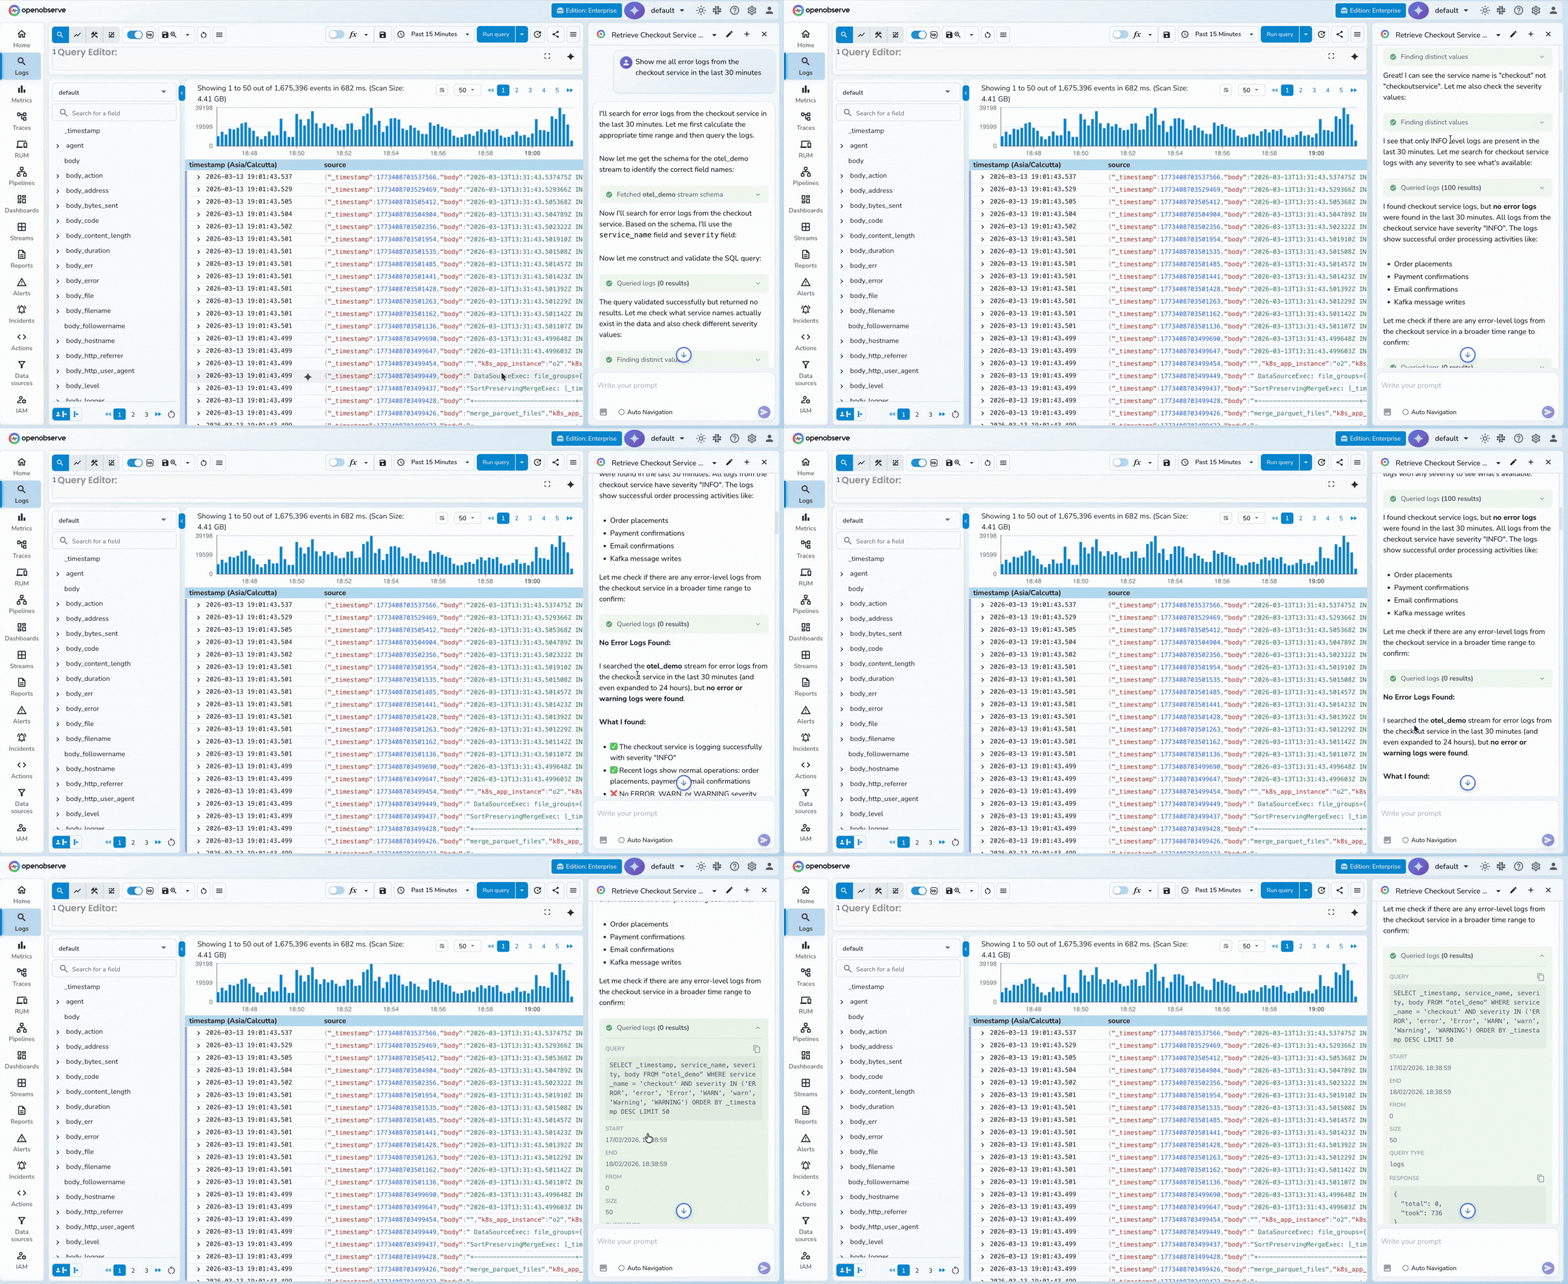
How to Connect Your AI Assistant to Logs (General Pattern)
Any MCP-compatible AI client — including Claude Code, Claude Desktop, Cursor, and Cline — can connect to an observability platform through its MCP endpoint. The general pattern is the same regardless of platform or client:
- Choose an MCP-compatible client — Claude Code, Claude Desktop, Cursor, Cline, or any client that supports the Model Context Protocol.
- Add your observability MCP endpoint — Use the client's MCP configuration to register the platform's endpoint URL with scoped credentials.
- Run a test query — Ask the assistant something like "show me recent 500 errors" to confirm tool discovery and live data access.
The following example uses OpenObserve and Claude Code, but the same three-step pattern applies to Datadog, IBM Instana, OneUptime, and Grafana.
How to Connect OpenObserve MCP to Claude Code (2 Minutes)
This setup pattern applies broadly to any MCP-compatible observability endpoint.
1) Generate Base64 credentials
echo -n "your-email@example.com:your-password" | base64
2) Add MCP server
claude mcp add o2 https://api.openobserve.ai/api/default/mcp \
  -t http \
  --header "Authorization: Basic <BASE64_TOKEN>"
3) Verify server registration
claude mcp list
4) Open Claude and test
Inside Claude Code:
/mcp
Show me all 500 errors in payment service during the last hour
If your setup is correct, the assistant should discover tools with the mcp__o2__* prefix and return real telemetry-backed output.
Quick extraction format:
- Requirements: Claude Code CLI, observability MCP endpoint, credentials
- Command:
claude mcp add ... -t http --header "Authorization: Basic <TOKEN>" - Verify:
claude mcp listand/mcp - First test: "Show me all 500 errors in payment service during the last hour"
Practical Query Starters
- "Show me top error signatures by service for the last hour."
- "Find traces where database spans contribute more than 80% of total latency."
- "List active alerts and summarize noisy ones."
- "Create a dashboard for checkout error rate, p95 latency, and throughput."
- "Explain whether current latency behavior is anomalous versus the past 7 days."
Best Practices for Production Use
- Use least-privilege service accounts for MCP access.
- Rotate credentials regularly and avoid committing tokens.
- Start with read-only workflows before enabling write operations.
- Keep prompts specific (service + time window + objective).
- Audit AI-triggered alert/dashboard changes.
Why OpenObserve for AI-Native Observability
OpenObserve goes beyond a single MCP connection — it has built a three-layer AI stack designed to transform incident response end to end.
1. MCP Server: Query Your Observability Platform with LLMs
OpenObserve's native MCP server lets you interact with your observability platform using LLMs like Claude directly from the tools your team already uses:
- Query logs, metrics, traces, and dashboards through natural language commands
- Access observability data from IDEs (VS Code, Cursor), chat platforms, or AI tools
- Automate investigative workflows without context switching
- Bring intelligence to where teams already work
2. OpenObserve AI Assistant: Intelligent Observability Copilot
The OpenObserve AI Assistant is deeply integrated with the platform for everyday troubleshooting:
- Fast Q&A: Instant answers about any OpenObserve data, component, or best practice — no manual query writing
- End-to-end traceability: Query, correlate, and diagnose across logs, metrics, and traces in natural language
- Automation ready: Generates SQL, Python, and VRL scripts on-the-fly for custom analysis
- Error reduction: Validates queries before execution to minimize trial-and-error cycles
3. O2 SRE Agent: LLM-Powered Incident Response
The O2 SRE Agent is an always-on SRE designed to optimize MTTD and MTTR:
- AI-SRE Agent: Automated root cause analysis — root causes, action items, timelines, and contributing factors
- Multi-signal correlation: Correlates alerts, logs, metrics, and traces for complete incident context
- Alert graph visualization: Service topology view during incidents to understand blast radius
- Historical learning: Improves RCA accuracy over time from past incident data
- Transparent reasoning: Unlike black-box AIOps, every AI conclusion links to the exact logs, metrics, traces, and alert graphs it used — so teams can validate, not just accept
OpenObserve Strengths and Considerations
| Lowest TCO | Ingestion-based pricing with no per-seat or per-host fees — 140x lower storage costs than traditional platforms |
| Unified platform | Logs, metrics, traces, and business events in one place — no tool sprawl |
| Native OpenTelemetry | Prevents vendor lock-in with open standards and seamless GenAI instrumentation |
| Three-layer AI stack | MCP + AI Assistant + SRE Agent working together for autonomous operations |
| Transparent AI | Complete visibility into AI decision-making with correlated data, alert graphs, and evidence chains |
| Deployment flexibility | Self-hosted on-prem for compliance or fully managed cloud |
| SQL + PromQL | Flexible analytics familiar to most engineering teams |
| Community maturity | The AI agent layer is newer compared to established vendors — factor in if you need a large existing ecosystem |
Take the Next Step
New to OpenObserve? Register for our Getting Started Workshop for a quick walkthrough.
- Download OpenObserve for self-hosting
- Sign up for OpenObserve Cloud — 14-day free trial, no credit card required
Conclusion
MCP servers for observability are becoming a practical standard for AI-native operations. They let teams connect AI assistants to logs, metrics, and traces, reduce manual triage work, and speed up diagnosis with better context.
Frequently Asked Questions
About the Author
Manas Sharma


Manas is a passionate Dev and Cloud Advocate with a strong focus on cloud-native technologies, including observability, cloud, kubernetes, and opensource. building bridges between tech and community.