7 OpenObserve Architecture Patterns for Scaling Efficiently



Ready to get started?
Try OpenObserve Cloud today for more efficient and performant observability.

TL;DR
- Start single-node. One OpenObserve node handles over 2 TB/day. Move to HA mode when your workload calls for it, not on day one.
- Scale the bottleneck, not the cluster. In HA mode, add Ingesters, Queriers, or Compactors based on what's actually slow.
- Cache hot queries. Querier disk caching makes frequently used dashboards fast without adding nodes.
- Tier retention per stream. Keep long retention for audit and compliance streams, short retention for debug logs.
- Shape data at ingest. OpenObserve Pipelines filter, redact, and normalize data before it's stored.
- Bring Your Own Bucket and supercluster mode add data ownership and multi-region reach when you need them.
A three-person platform team stood up a five-node OpenObserve HA cluster on day one, sized for the volume they expected a year out. Eight months later, the cluster sat at roughly ten percent utilization, with coordination nodes the team had to operate but didn't yet need, while one slow dashboard query kept timing out every Friday. Nobody had scaled the one component that actually needed it.
That's a composite, not one specific team, but the pattern is common. When an OpenObserve deployment feels slower or harder to run than it should, the platform is rarely the cause. It's usually an architecture chosen once at the start and never revisited as the workload changed.
OpenObserve gives you a lot of flexibility in how you deploy it: one node or many, local disk or object storage, one region or several. This guide walks through seven architecture patterns, what each one solves, and when it earns its place.
How does OpenObserve's architecture work?
A quick primer helps the patterns make sense. OpenObserve converts incoming data to Parquet and stores it on local disk or object storage (S3, GCS, Azure Blob). Queries read those Parquet files back, which is what keeps storage lean and lets compute and storage scale separately.
On top of that, OpenObserve ships with two deployment modes:
- Single-node mode runs on SQLite with local disk or object storage. It comfortably ingests and searches over 2 TB per day on one machine.
- HA mode adds NATS for cluster coordination and PostgreSQL for metadata, and splits the work across five node types that scale independently: Router, Ingester, Compactor, Querier, and Scheduler.
Every pattern below is about matching that architecture to your real workload.
Pattern 1: Run the deployment mode your workload needs
Many teams reach for HA mode on day one because it sounds like the production-grade choice. But a single node handles a large amount of volume, and HA mode brings real operational surface: NATS, PostgreSQL, and multiple node types to deploy, monitor, and upgrade.
The recommendation: start single-node, watch your real ingestion curve and resource usage, and move to HA when you need the volume headroom, redundancy, or independent scaling it provides.
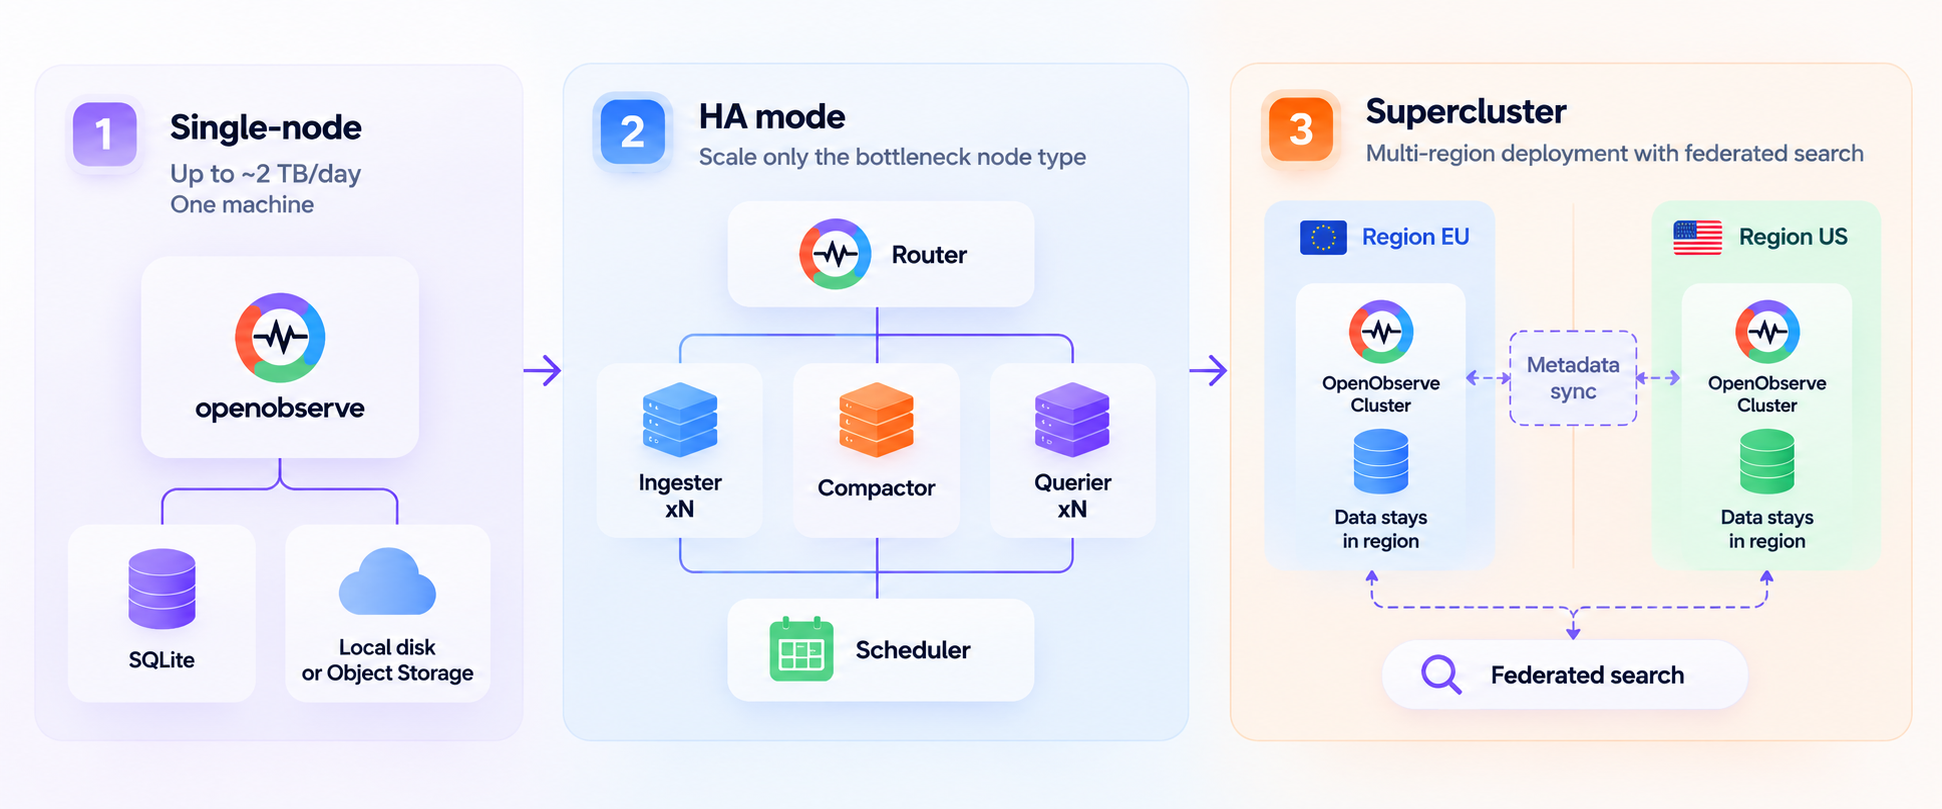
Three deployment stages. Move to the right when your workload, not your assumptions, says so.
Pattern 2: Scale the bottleneck, not the cluster
Once you're in HA mode, the common mistake shifts: scaling every node type together whenever anything feels slow. Because each node type scales independently, the fix for a slow dashboard is almost never "add more of everything." Match the symptom to the node:
| Symptom | Scale this | Why |
|---|---|---|
| Ingest lagging behind source volume | Ingesters | They convert incoming data to Parquet and write it to storage |
| Searches timing out at peak hours | Queriers | They serve query load, independent of ingest |
| Storage filling with small, unoptimized files | Compactors | They merge files and enforce retention |
Targeted scaling fixes the problem where it lives and keeps the rest of the cluster stable.
Pattern 3: Cache hot queries before adding compute
Queriers can cache the Parquet files they read from object storage on local disk, so repeated or similar queries don't fetch from S3 every time. On AWS, the i3 and i4 instance families with fast NVMe SSDs are good candidates. Enabling ZO_CACHE_LATEST_FILES_ENABLED keeps recently written files cached for the queries that hit them most, like the dashboard everyone checks every morning.
A well-tuned cache often solves what teams are really trying to fix when they add Queriers: the same handful of dashboards being slow, over and over, for the same reason.
Pattern 4: Tier retention per stream, not globally
In OpenObserve, retention is set per stream, not as one global policy. Most environments have a few streams that genuinely need six or twelve months (audit logs, compliance-relevant traces) and a much larger volume where thirty days is plenty (debug logs, verbose infrastructure metrics).
Matching retention to each stream's purpose keeps storage lean, keeps queries over recent data focused, and gives you a clear answer when someone asks how long a given type of data is kept.
Quick check: If every stream in your organization has the same retention setting, that usually means the setting was never revisited after initial setup, not that every stream needs the same window.
Pattern 5: Bring your own bucket for full data ownership
OpenObserve Cloud supports Bring Your Own Bucket (BYOB): your data lands in an object storage bucket you own, in your own cloud account, with no retention limits from OpenObserve on top.
That puts storage fully under your control: your access policies, your lifecycle rules, your region, and your existing cloud agreements. It's a strong fit for teams with data residency or governance requirements. Talk to our team to see whether it suits your setup.
Pattern 6: Go multi-region without duplicating data
When a global footprint pushes you toward regional deployments, OpenObserve's supercluster mode connects independent HA clusters. Each cluster keeps its own data in its own regional storage, while configuration metadata syncs across all of them for unified management.
Federated search then lets you query across clusters without moving or copying the underlying data. You get one place to search everything, data stays in the region it belongs to, and nothing is replicated across borders.
Pattern 7: Shape data at ingest and protect critical queries
The easiest data to manage is the data you never store. OpenObserve Pipelines run VRL functions against a stream at ingest time, before storage. You can drop known-noisy patterns, redact sensitive fields, and normalize data in one place instead of fixing it downstream in every dashboard and query.
Here's a minimal ingest-time function:
# OpenObserve function (VRL), attached to a stream via Pipelines
if match(string!(.severity), r'(?i)^(debug|trace)$') {
  abort  # dropped before it's stored
}

# Redact, don't drop: masks matching values anywhere in the event,
# leaving keys and everything else untouched
. = redact(., filters: ["us_social_security_number"])
On the query side, OpenObserve's workload management controls how resources are allocated and prioritized in multi-tenant environments. One runaway ad hoc query can't starve the critical dashboards your on-call team depends on during an incident.
Where each pattern fits in the data flow
All seven patterns map to four stages between your data sources and your dashboards:
| Stage | What happens | Patterns |
|---|---|---|
| Pipeline | Filter, redact, classify at ingest | 7 |
| Ingesters | Convert data to Parquet | 1, 2 |
| Object storage | Retention, ownership, and regions | 4, 5, 6 |
| Queriers | Caching and workload management | 3, 7 |
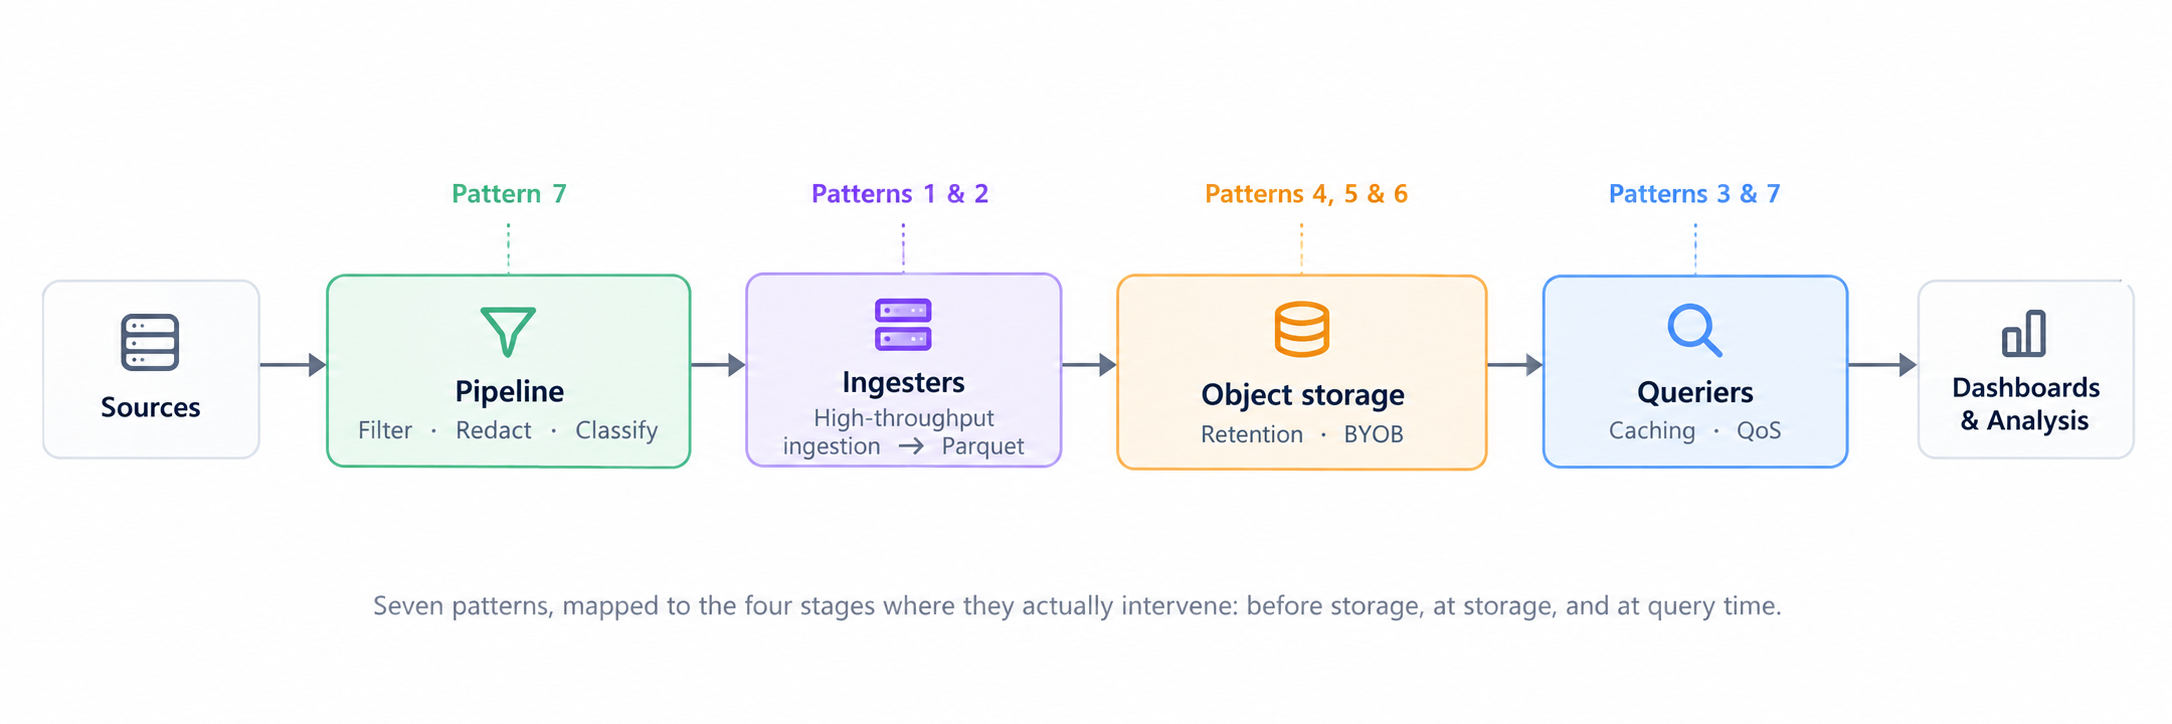
Every stage between source and dashboard is a place to tune your architecture, not just the ingest point.
Trade-offs to plan for
| Consideration | What to know |
|---|---|
| Moving from single-node to HA | Both modes can point at the same object storage, so moving up mainly means adding the coordination layer (NATS, PostgreSQL) around data already in your bucket. It's not a re-ingestion project. |
| Cache sizing | Size the NVMe cache against your repeat-query pattern, not total data volume, or much of it will sit unused. |
| Retention tiering | Document why each stream has the retention it has. You'll want that record during a compliance review. |
| BYOB responsibility | You own the bucket, its lifecycle policies, and its permissions. Plan who manages them. |
| Supercluster governance | Each region keeps its own data under its own access controls. Decide upfront who can run federated queries across regions and why. |
Further reading
- OpenObserve architecture and deployment modes: single-node vs HA mode, the five node types, and how data flows through the system
- Pipelines in OpenObserve: building ingest-time pipelines
- Functions in OpenObserve: writing and testing VRL for filtering, redaction, and enrichment
- Extended retention for streams: configuring retention per stream
- Scaling observability for peak traffic
Conclusion
None of these seven patterns require a migration. They're configuration and deployment choices inside OpenObserve. Start by comparing your real ingestion curve against what a single node handles, scale only the node type that's actually your bottleneck, and give each stream the retention it needs. Your architecture should follow your workload, and with OpenObserve, it can change as your workload does.
Want to try these patterns on your own data? Start a free OpenObserve Cloud trial or download self-hosted OpenObserve.
Frequently Asked Questions
About the Author
Tejas Shah
Tejas Shah is Chief Solutions Architect and advisor for SIEM and Observability at DataElicit Solutions, an ISO 27001 certified MSSP and Splunk partner based in India. His work spans SIEM architecture, technical enablement, and managed security operations across the observability ecosystem.
Follow OpenObserve on Google
Add OpenObserve as a preferred source to see more of our articles in Google Search and Top Stories.