









“OpenObserve helped us migrate from Datadog in under an hour... reducing observability costs by 4x.”

4x
Lower observability cost

< 1 hour
Migrated off Datadog

Flat pricing
No month-end surprises
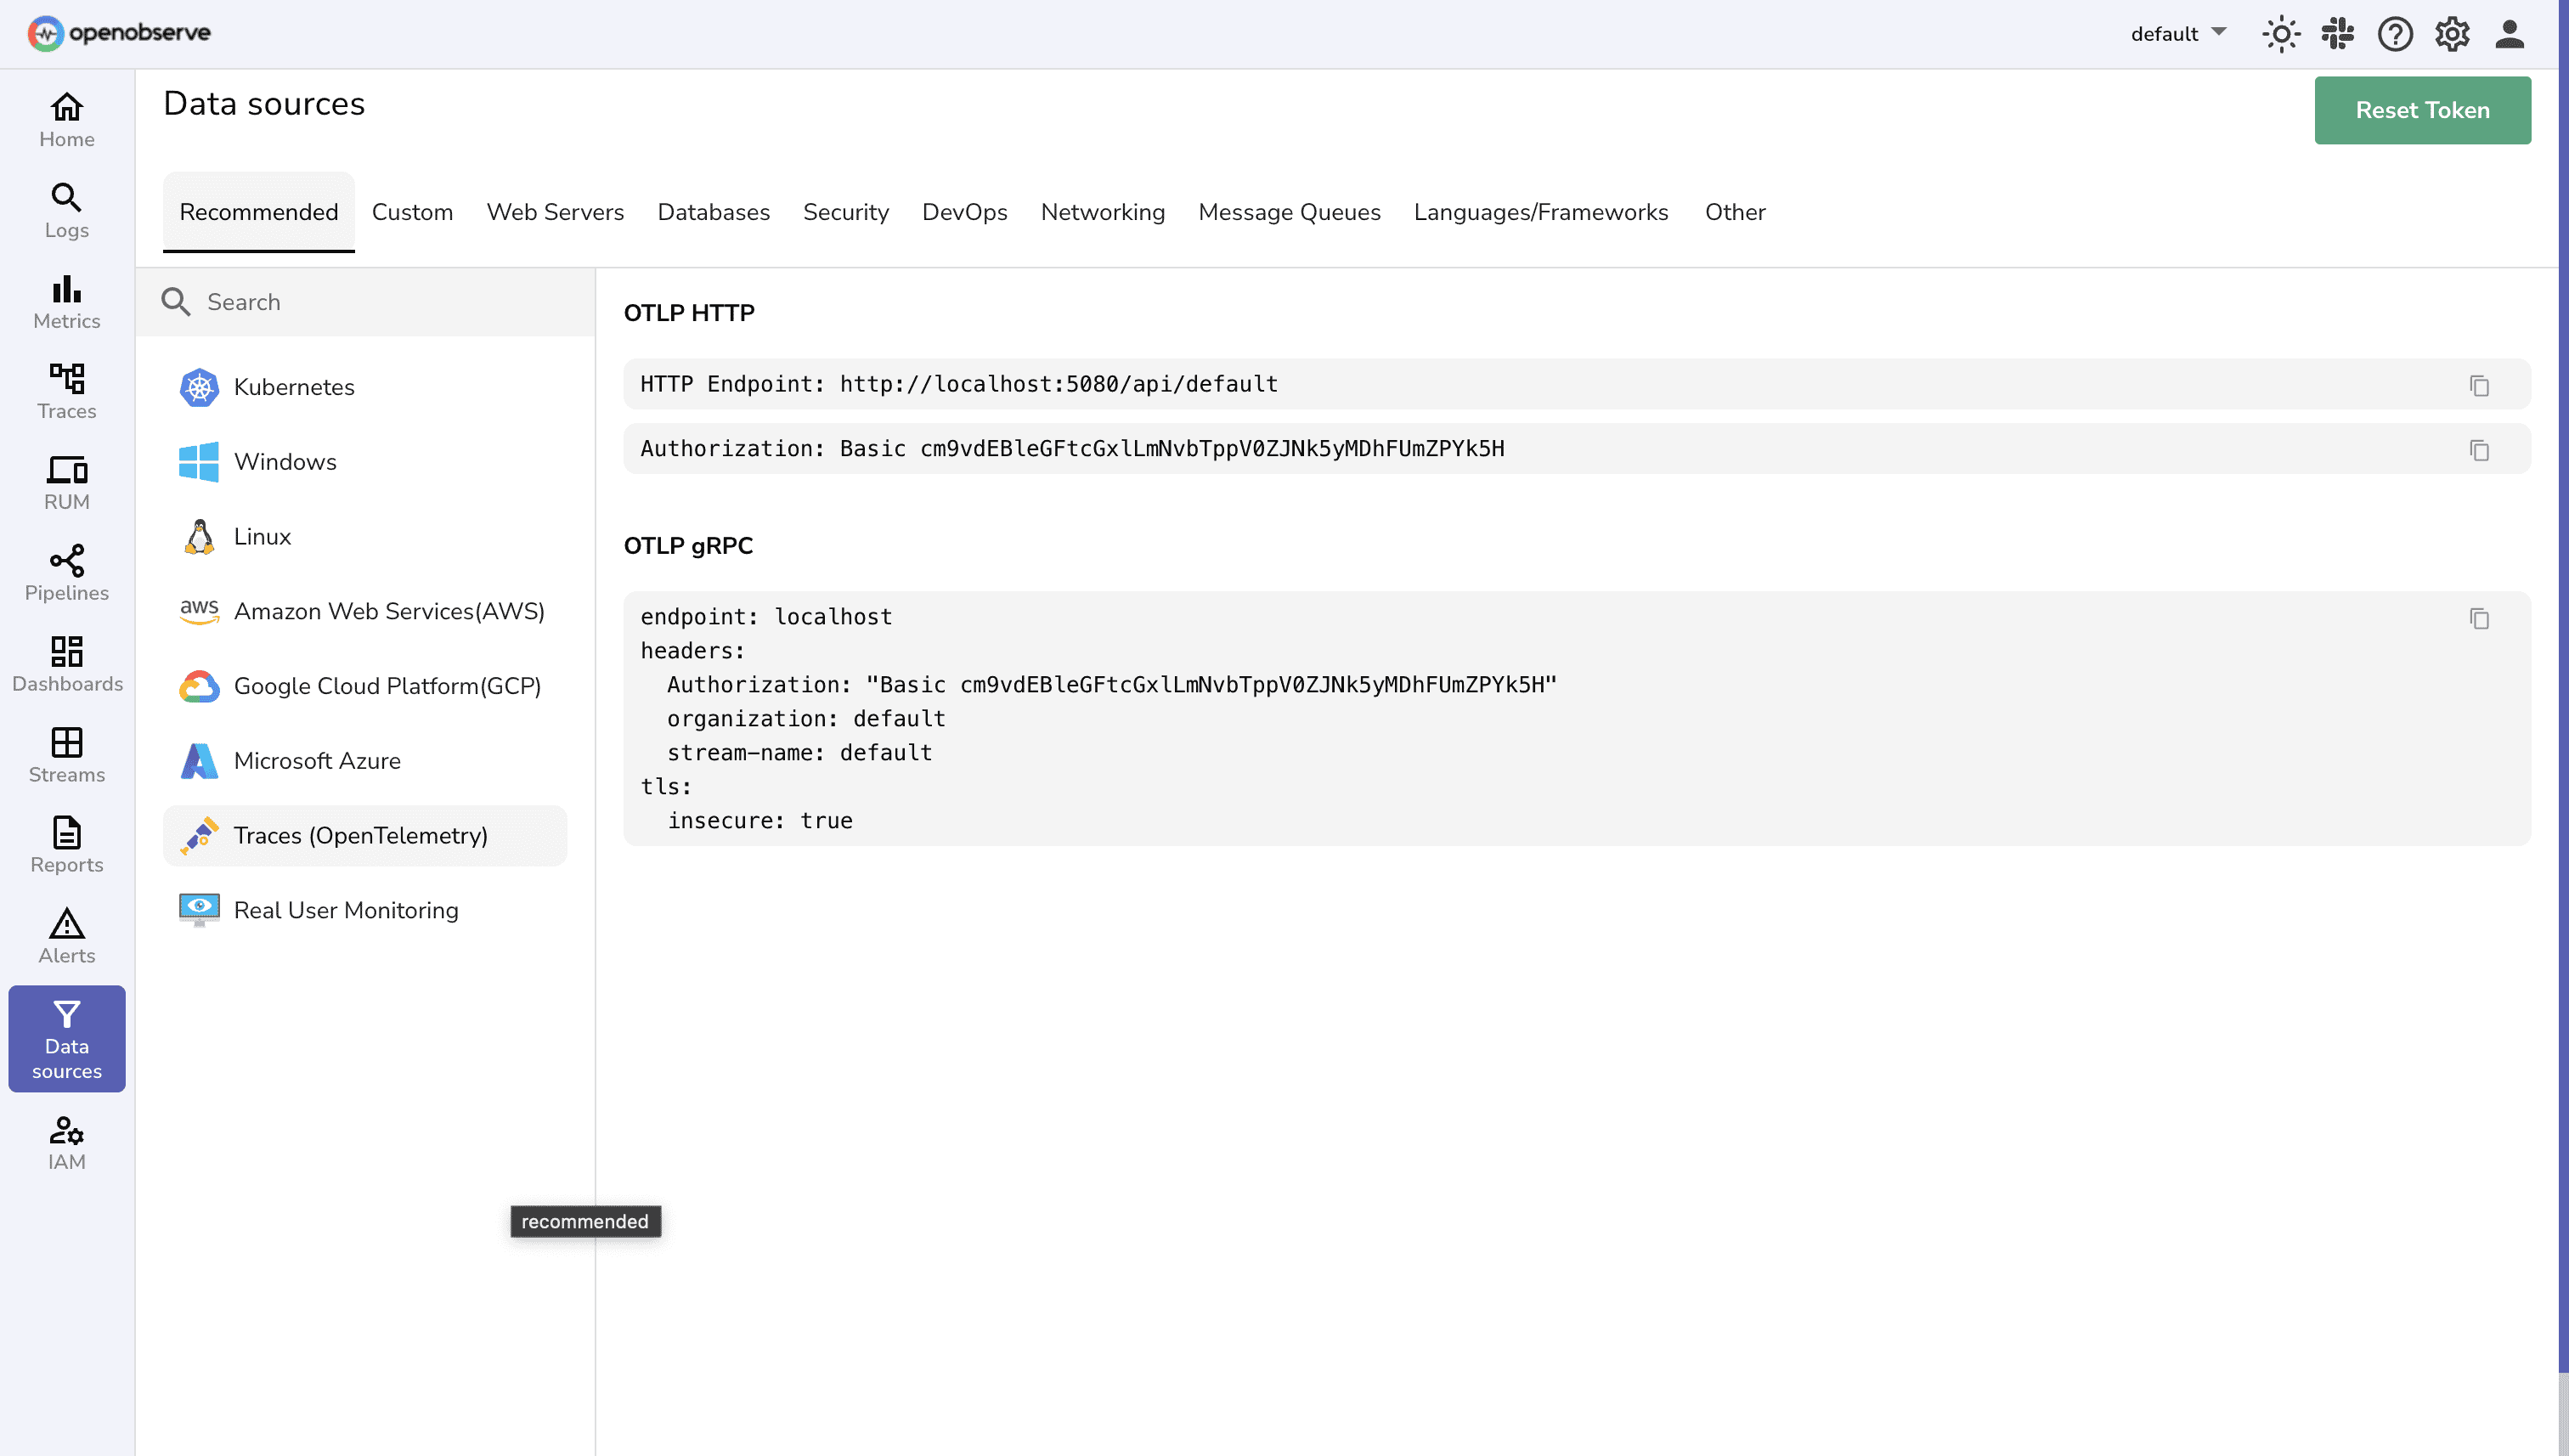
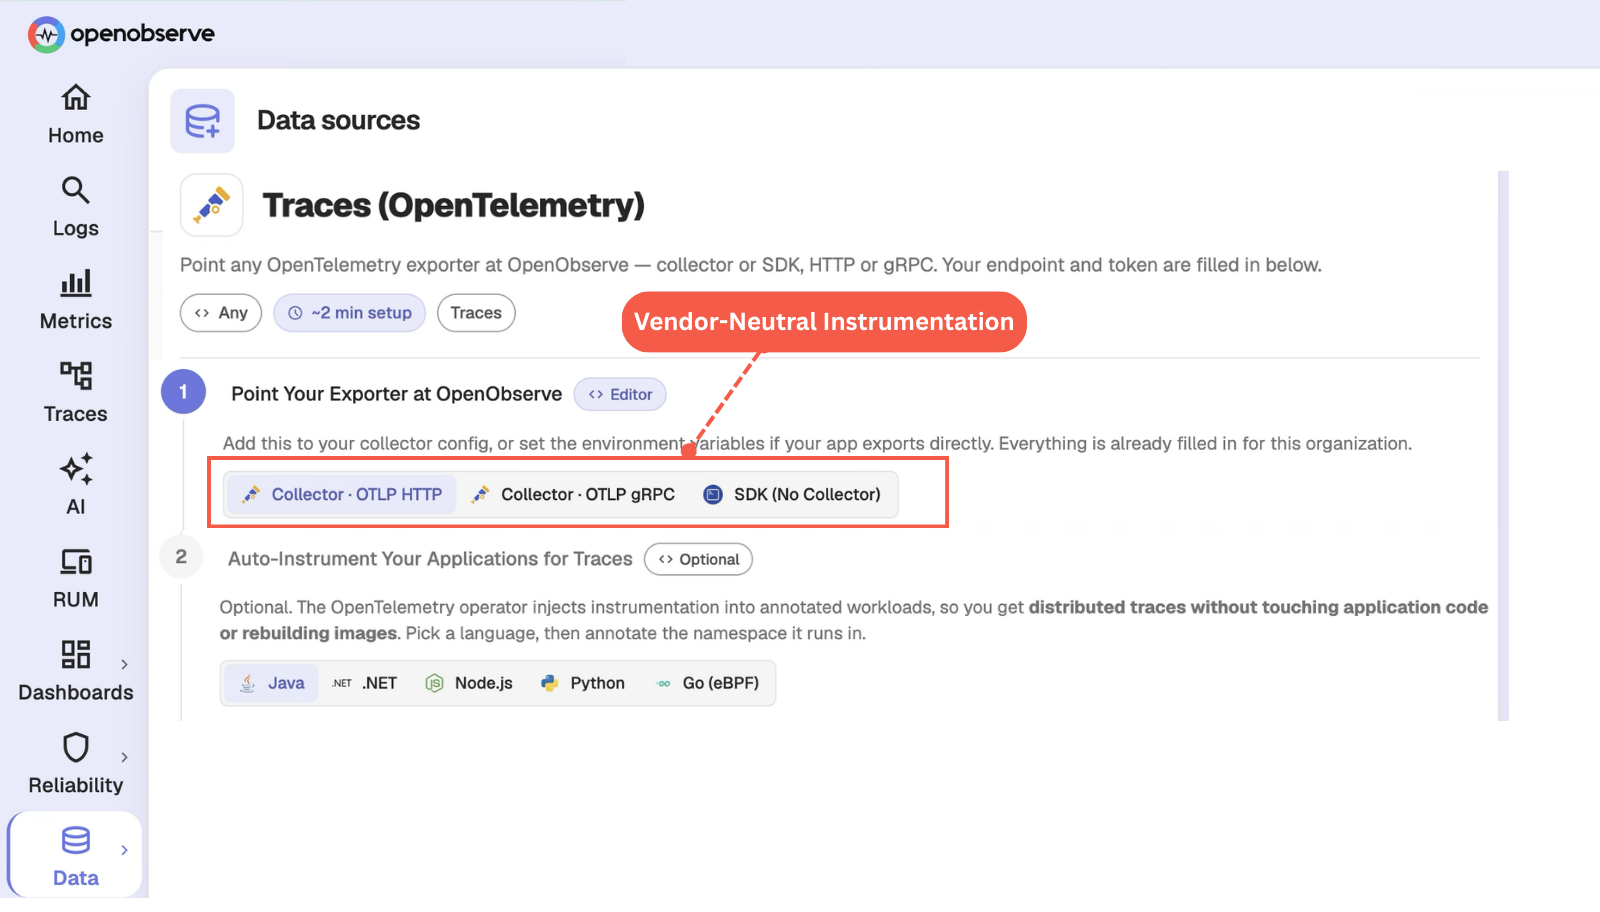
Point any OpenTelemetry exporter at OpenObserve, over HTTP or gRPC. Your instrumentation stays vendor-neutral.
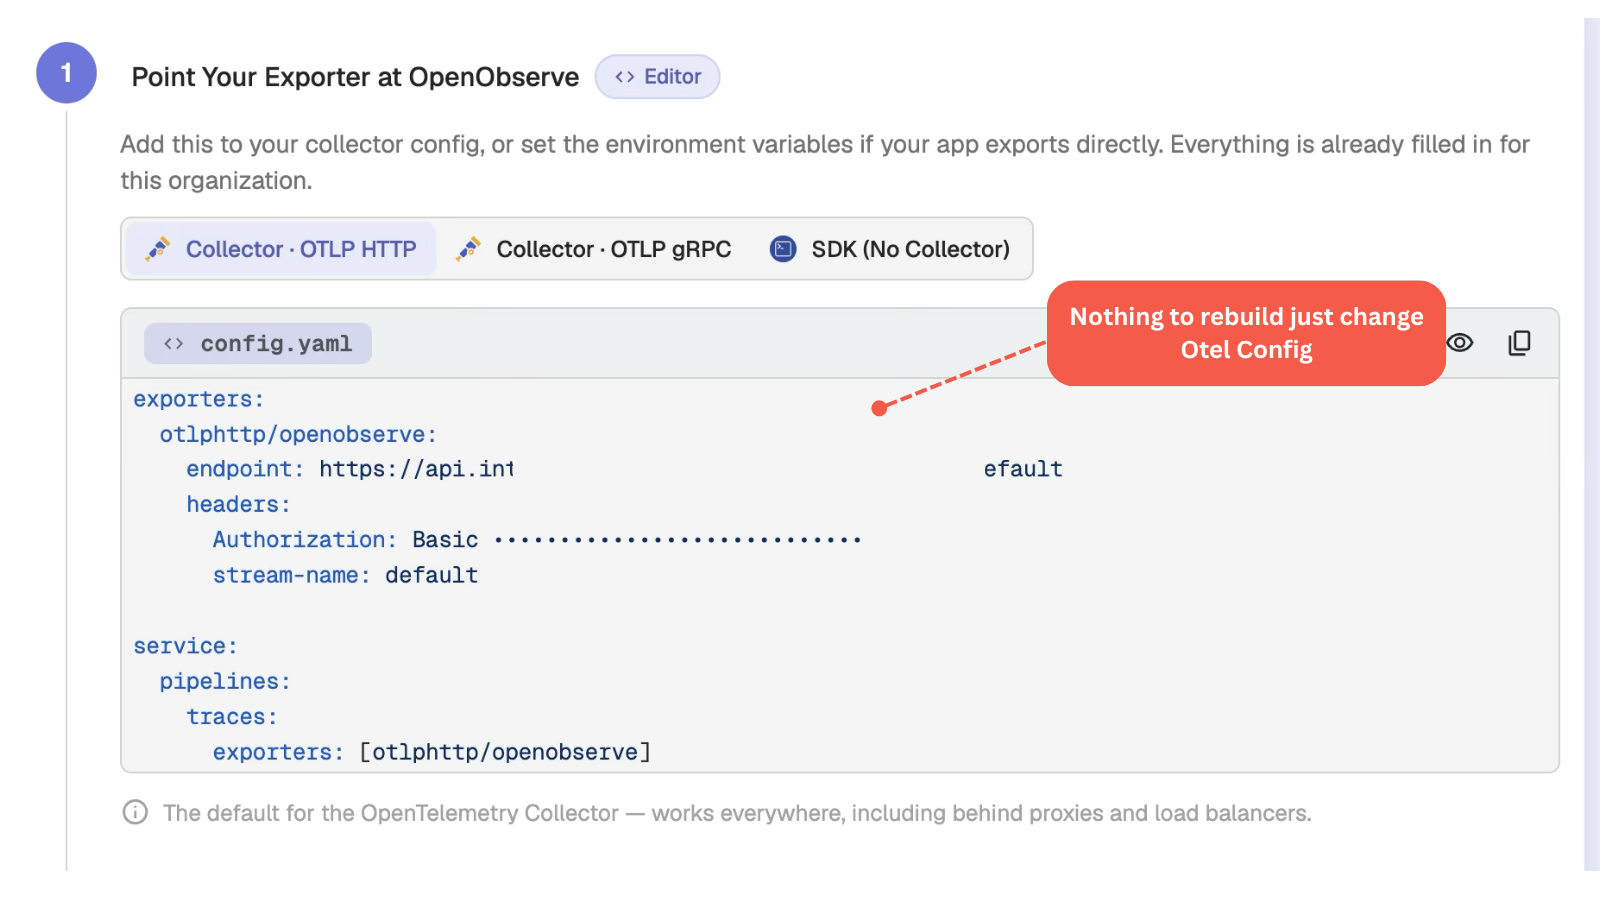
Point any OpenTelemetry exporter at OpenObserve. Endpoint and token are filled in for this org.
exporters: otlphttp/openobserve: endpoint: https://your-org.openobserve.ai/api/default headers: Authorization: "Basic ••••••••••••"
No proprietary agent. Existing collector config works unchanged.
Vendor-neutral OTLP in. Services, datastores, queues and RPC resolve themselves.
Your endpoint and token come pre-filled. Existing collector configs work unchanged, no migration required.














Send traces through any OTel SDK or Collector you already run, no vendor agent to install.
Skip manual configuration. Your ingestion endpoint and auth token are ready the moment you sign up.
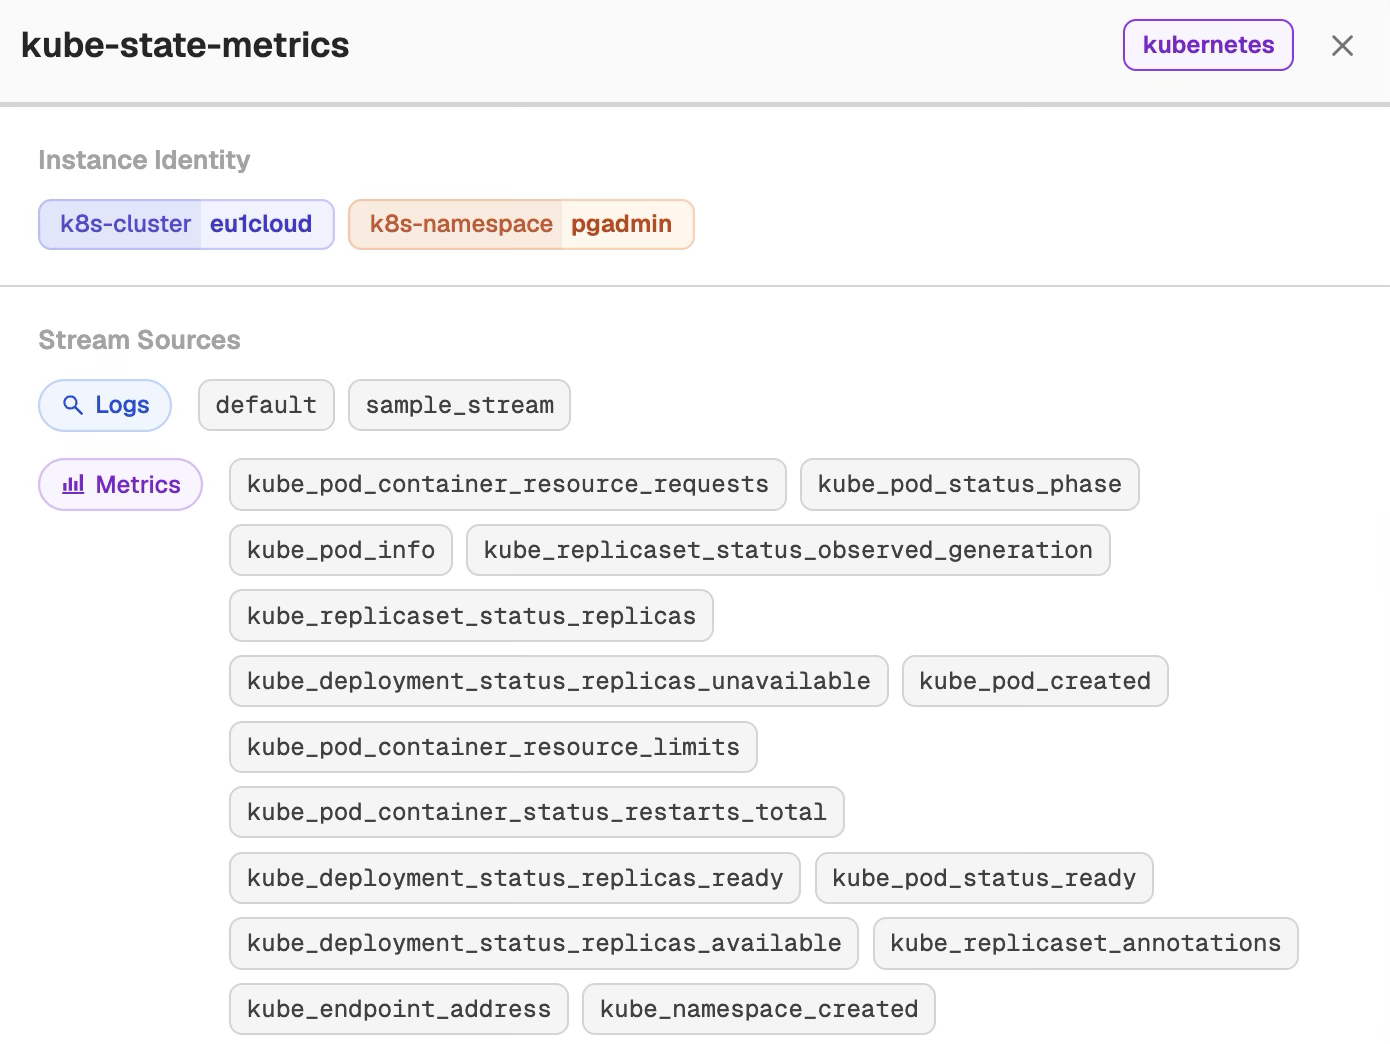
Logs, metrics, and traces share the same resource model, so correlation works without custom mapping.
Use OTLP over HTTP or gRPC from any SDK or collector you already run. Existing configs keep working.
Your endpoint and token are pre-filled for your organization, no manual setup before your first trace arrives.
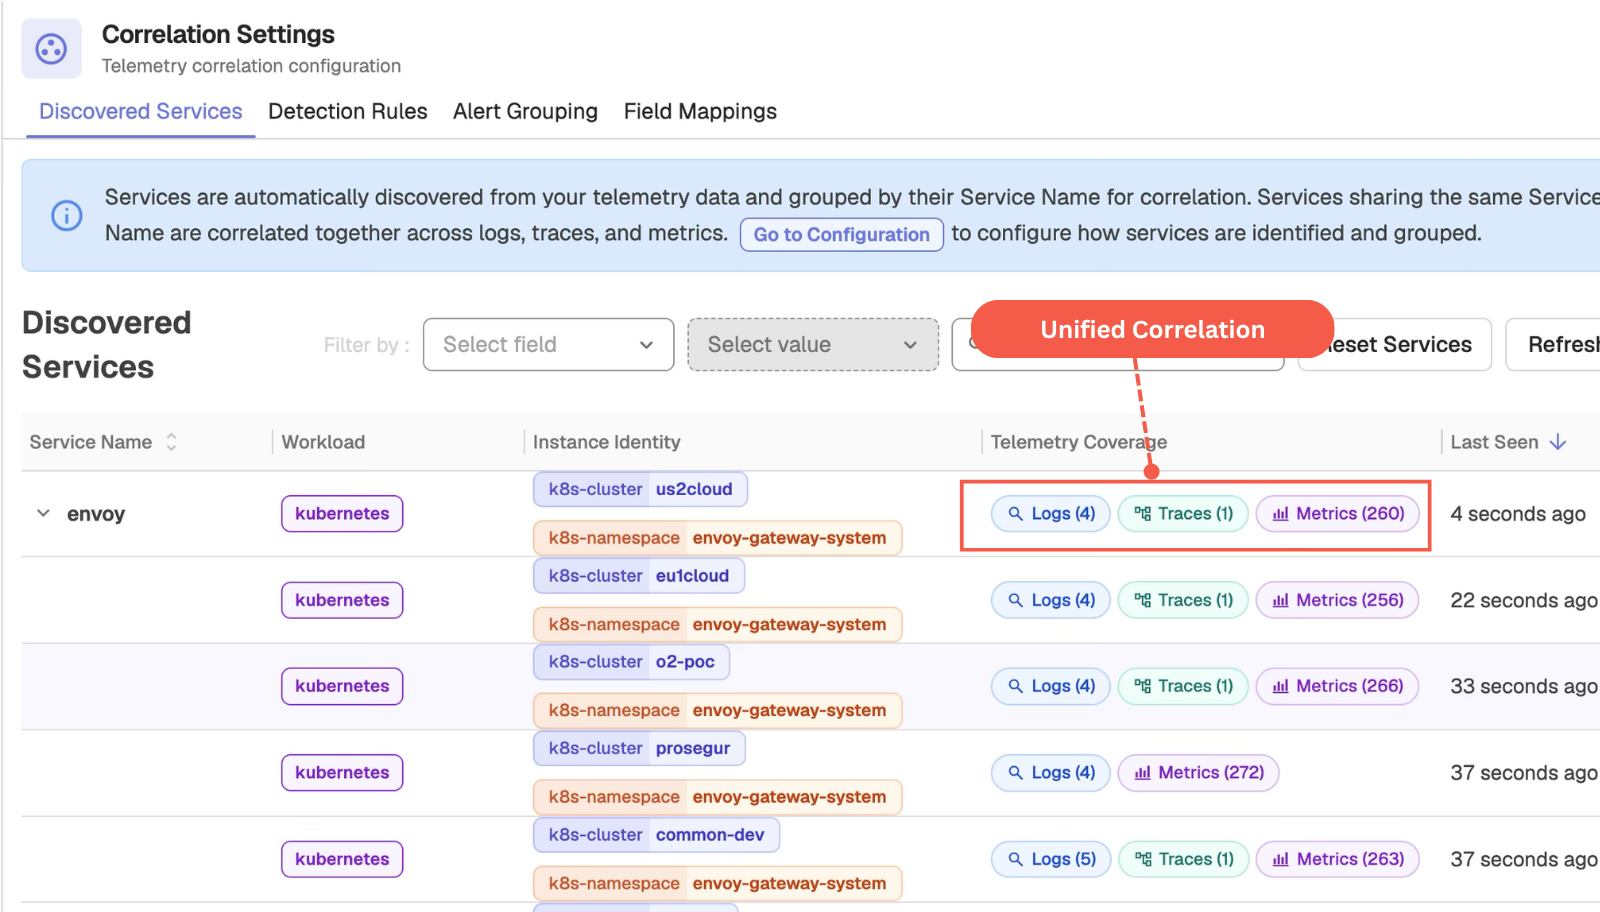
Logs, metrics, and traces share a single resource model, so correlation works out of the box instead of after custom mapping.
Jump from a slow trace to the logs and metrics from the same request without switching tools.
Every hop from SDK to storage uses open OpenTelemetry standards, nothing to rip out if you change vendors later.
Rely on OTel’s semantic conventions instead of a vendor-specific schema for spans and attributes.
Because nothing is proprietary, moving to or from OpenObserve does not mean re-instrumenting your services.
Point your current OpenTelemetry Collector config at a new endpoint, nothing else to rebuild.
Same telemetry, same workloads, one platform. Every number is OpenObserve against a named vendor - not an industry average.
vs. Datadog
8×
more cost-effective
8x cost reduction means you can unify your observability into a single platform.
vs. Elastic
140×
storage efficiency
140x storage means longer retention doesn't necessarily mean expensive bills.
vs. Grafana stack
5–15×
faster performance
5x to 15x faster queries mean dashboards load in milliseconds, not minutes.
See how much you'd save switching today.
Correlate between the environments and signals across various sources with OpenObserve built-in correlation engine.
“OpenObserve helped us migrate from Datadog in under an hour... reducing observability costs by 4x.”
4x
Lower observability cost
< 1 hour
Migrated off Datadog
Flat pricing
No month-end surprises
From zero to application traces in minutes - no agents to babysit, no pipelines to wire by hand.
See the guideSpin up a in the region closest to you.
Send OTLP over HTTP or gRPC from your SDK or Collector - the endpoint and token are pre-filled for your organization.
Watch logs, metrics, and traces stream in - correlated and query-ready from the first event.
to help you get the most out of application monitoring.
Send OTLP from the instrumentation you already run, and correlate traces, logs, and metrics in one place. Pick the plan that fits your team.
Self-hosted Enterprise, free up to 50GB. Advanced features for growing teams.
Fully managed OpenObserve in the cloud. Start with a free trial - no infrastructure to run.
Enterprise-grade support, SSO, and SLAs for large-scale, multi-region deployments.

AI Observability by OpenObserve
OpenTelemetry-native observability for agents and LLMs.