Observability Cost Logging
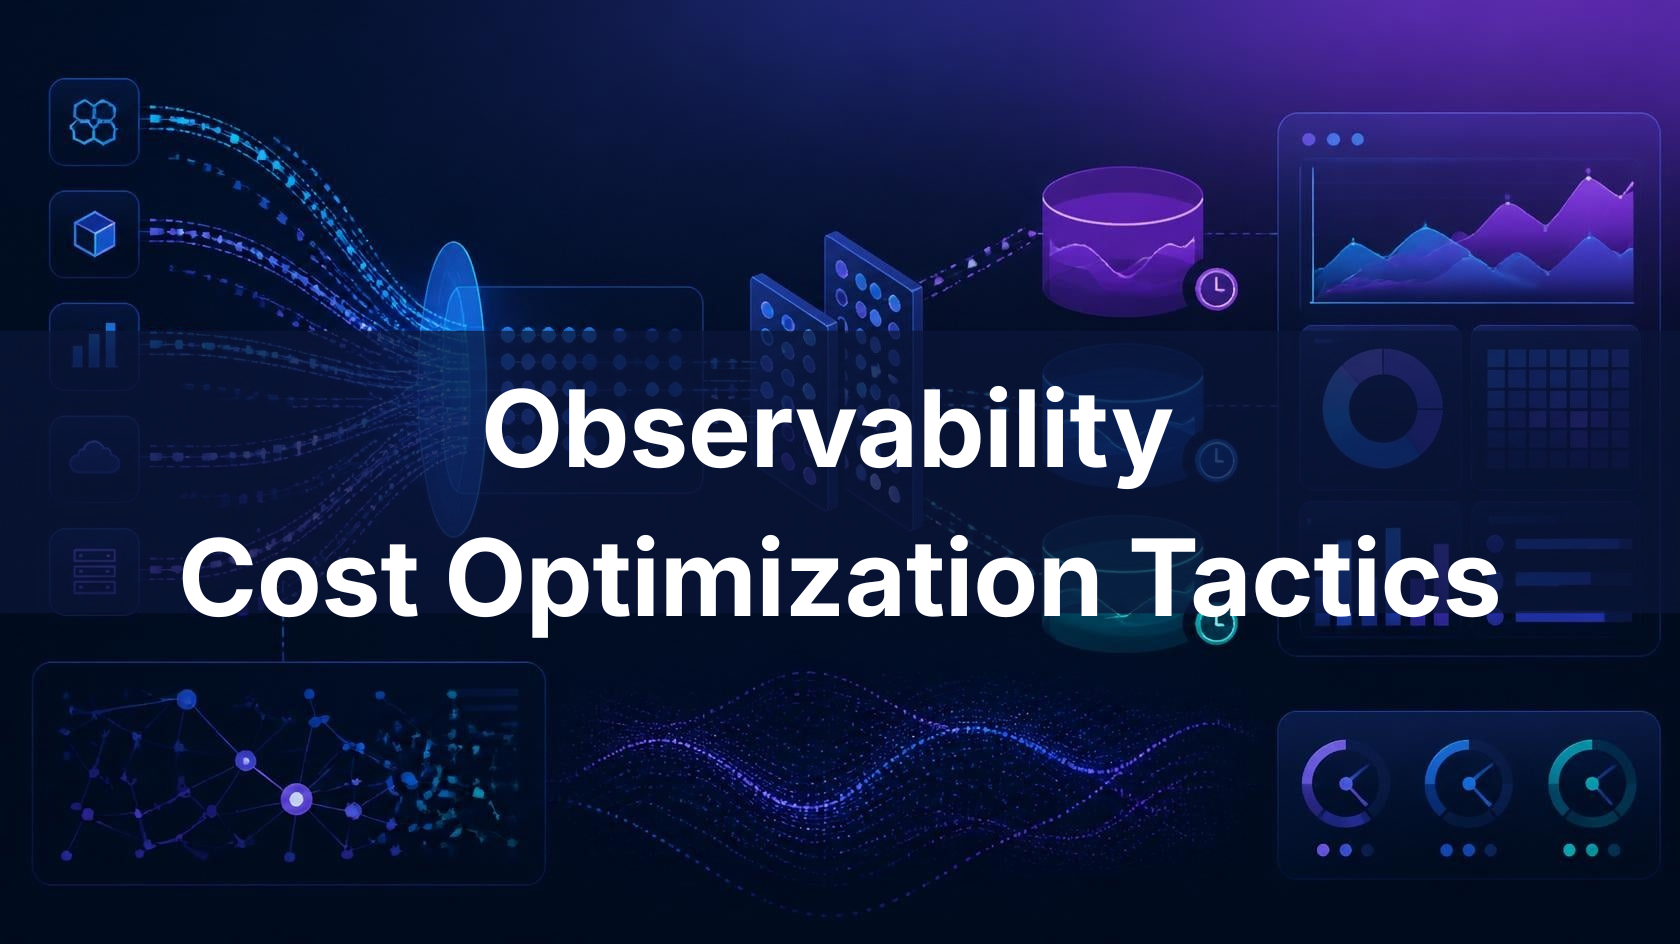
Observability Cost Optimization: 12 Tactics That Actually Work
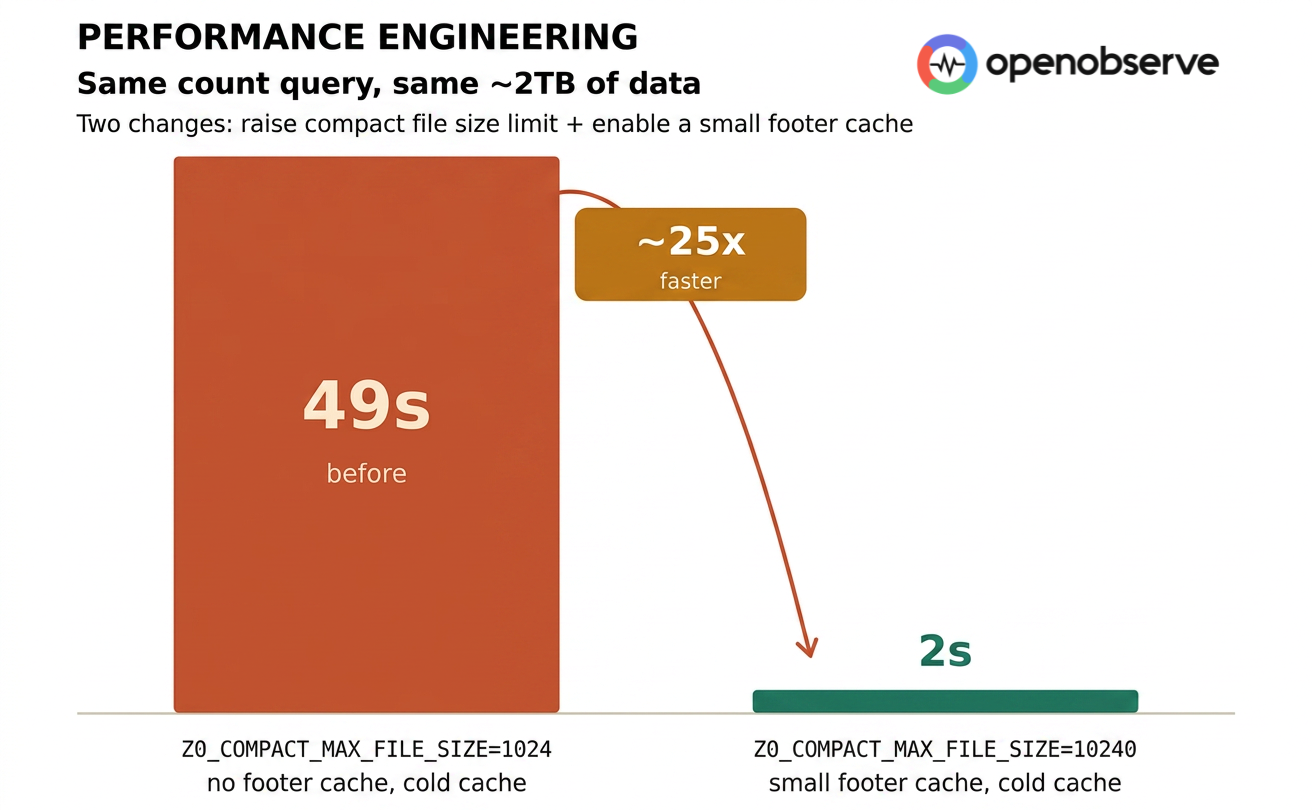
Twelve config-level tactics for observability cost optimization, sampling, pipeline filtering, retention tiers, and cardinality control, with before/after numbers and real config examples for logs, metrics, and traces.