AI Agent Monitoring: How to Observe Autonomous AI Agents in Production




Ready to get started?
Try OpenObserve Cloud today for more efficient and performant observability.
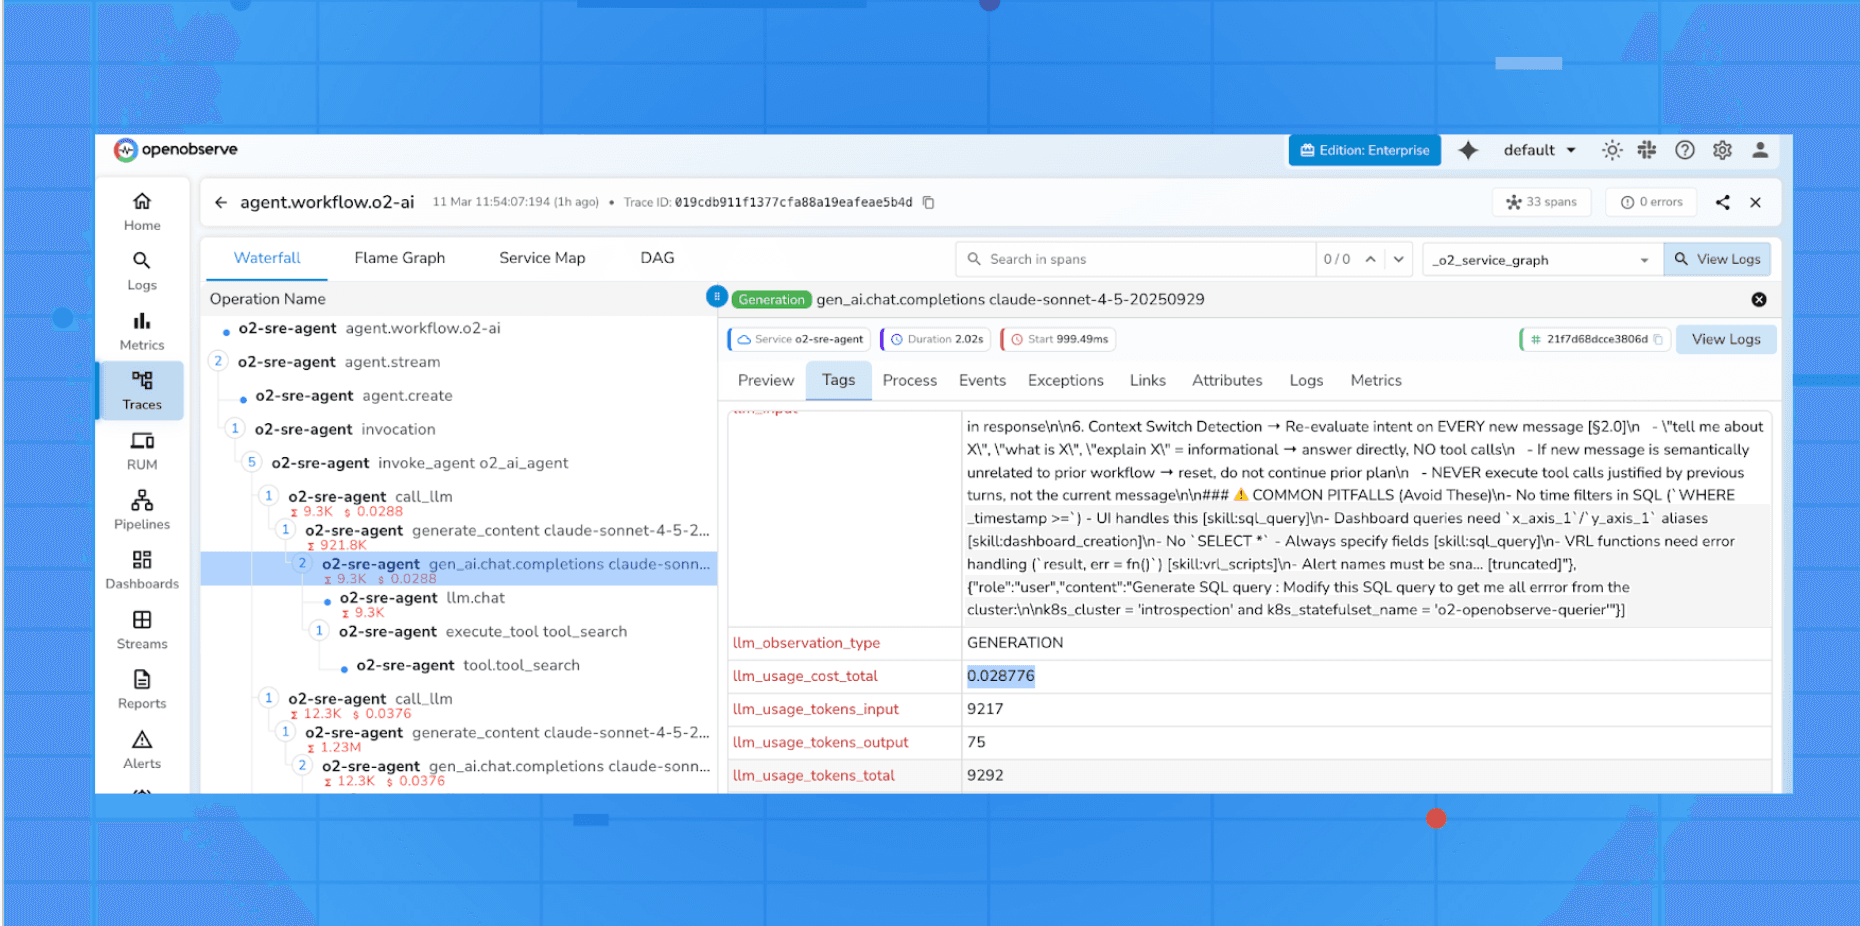
What Is AI Agent Monitoring?
AI agent monitoring , also called LLM observability , is the practice of collecting, analysing, and acting on telemetry data generated by large language model (LLM) calls and the autonomous agents built on top of them. Think of it as traditional Application Performance Monitoring (APM), but purpose-built for AI workloads.
A modern AI agent is not a static API call. It is a dynamic, multi-step reasoning system that may:
- Plan and decompose subtasks autonomously
- Call external tools (web search, code execution, APIs)
- Retrieve documents via Retrieval-Augmented Generation (RAG)
- Spawn sub-agents for parallel task execution
- Loop and self-correct until a goal is satisfied
Every one of those steps is a potential point of failure, latency spike, or cost explosion.Just as DevOps engineers would never deploy a microservice without metrics, traces, and logs, MLOps and AI engineers need the same rigour for LLM-powered systems. AI agent monitoring closes that gap.
Why It Matters in Production
The jump from a prototype that "works on my machine" to a reliable production AI agent is enormous. Here is what routinely breaks without proper monitoring in place:
Runaway Token Costs
An unchecked agentic loop can consume millions of tokens before you notice. A single misbehaving agent session , stuck in a reasoning loop , can exhaust your entire daily token budget in minutes. Token-level telemetry gives you per-request cost visibility and the ability to set budget-based circuit breakers.
Silent Latency Regressions
A new model version, a longer system prompt, or a change in retrieval strategy can quietly double your agent's response time. Without distributed latency traces, you discover this from frustrated users , not from a proactive alert.
Rate-Limit Cascade Failures
LLM API rate limits hit unpredictably under production load. A single rate-limit event can trigger aggressive retries across multiple parallel agent sessions, cascading into a full outage. Observability surfaces error rates and retry storms before they spiral.
Degraded Output Quality
Hallucinations, refusals, and incoherent responses increase as context windows grow or prompts drift. Span-level metadata correlating prompt structure with output quality lets you catch these regressions systematically rather than through ad hoc user complaints.
Multi-Step Reasoning Failures
In agentic pipelines, a failure deep in a reasoning chain is nearly impossible to attribute without distributed tracing. Did the agent fail because the web search tool returned bad data, because the LLM misinterpreted the tool output, or because the context window overflowed? Traces answer this question.
Compliance & Audit Requirements
Enterprise deployments increasingly require complete audit logs of what the agent decided, why it decided it, what data it accessed, and what actions it took. Without structured telemetry, producing these audit trails is manual and error-prone.
The Four Pillars of LLM Observability
Comprehensive AI agent monitoring rests on four inter-related telemetry disciplines, adapted from traditional distributed systems observability for AI workloads:
1. Distributed Tracing
Every agent action , from receiving a user prompt to returning a final answer , is instrumented as a trace composed of spans. Each span captures a discrete unit of work: an LLM call, a tool invocation, a database retrieval, or a sub-agent call. Traces stitch these spans together into a causal timeline.
Tracing answers the question: "What happened, in what order, and how long did each step take?"
2. Metrics
Aggregated numerical data collected over time , token counts, latency percentiles (p50, p95, p99), error rates, throughput (requests per second), and cost per request. Metrics are cheap to store and fast to query, making them ideal for real-time dashboards and threshold-based alerting.
3. Structured Logs
Rich, machine-readable event records attached to each agent action. Logs capture prompt text, model parameters, completion content (when safe to store), tool call arguments, and exception stack traces. Unlike metrics, logs retain the full context needed for post-incident debugging.
4. Evaluations (Evals)
A layer unique to AI observability: automated or human-assisted scoring of agent outputs for correctness, safety, relevance, and faithfulness to source documents. Evals close the loop between operational telemetry and output quality, enabling regression detection as prompts and models change over time. See LLM Evals vs Observability for why you need both layers, not just one.
Pro Tip: For most teams starting out, distributed tracing delivers the highest immediate value. It reveals exactly where latency and failures originate across multi-step agent pipelines , something neither metrics nor logs alone can show.
Key Metrics to Track
Not all telemetry is equally actionable. These are the metrics that matter most for production LLM workloads:
| Metric | What It Tells You | Typical Alert Threshold |
|---|---|---|
llm.usage.prompt_tokens |
Input token consumption per request | > 80% of model context window |
llm.usage.completion_tokens |
Output token consumption per request | Sudden spike > 2× baseline |
llm.usage.total_tokens |
Combined cost proxy per call | Daily cost budget exceeded |
duration (end-to-end) |
User-perceived latency | p95 > 10s for interactive agents |
error.rate |
% of requests that fail or timeout | > 1% over a 5-minute window |
tool_call.count |
Number of tool invocations per session | > 20 per session (loop indicator) |
agent.steps |
Depth of reasoning chain | > configured max steps |
llm.request.model |
Which model was invoked | Unexpected model fallback detected |
Monitoring these metrics as time-series data , not just spot checks , is what enables you to detect gradual degradation before it becomes a user-visible outage.
OpenTelemetry: The Standard for AI Observability
OpenTelemetry (OTel) is the open-source observability framework that has become the industry standard for instrumenting distributed systems. For AI agents, it provides a vendor-neutral way to emit traces, metrics, and logs from any LLM call to any compatible backend , OpenObserve, Prometheus, Jaeger, Grafana, Datadog, and more.
The ecosystem has grown rapidly, with dedicated auto-instrumentation libraries for all major LLM providers:
opentelemetry-instrumentation-openaiopentelemetry-instrumentation-anthropicopentelemetry-instrumentation-langchainopentelemetry-instrumentation-llama-indexopentelemetry-instrumentation-cohere
These libraries wrap LLM client calls and automatically attach semantic attributes , token counts, model name, temperature, max tokens, error details , as span attributes, without requiring any manual instrumentation in your application code.
How OTel Spans Map to Agent Steps
In an agentic pipeline, the OTel trace tree mirrors the agent's reasoning hierarchy:
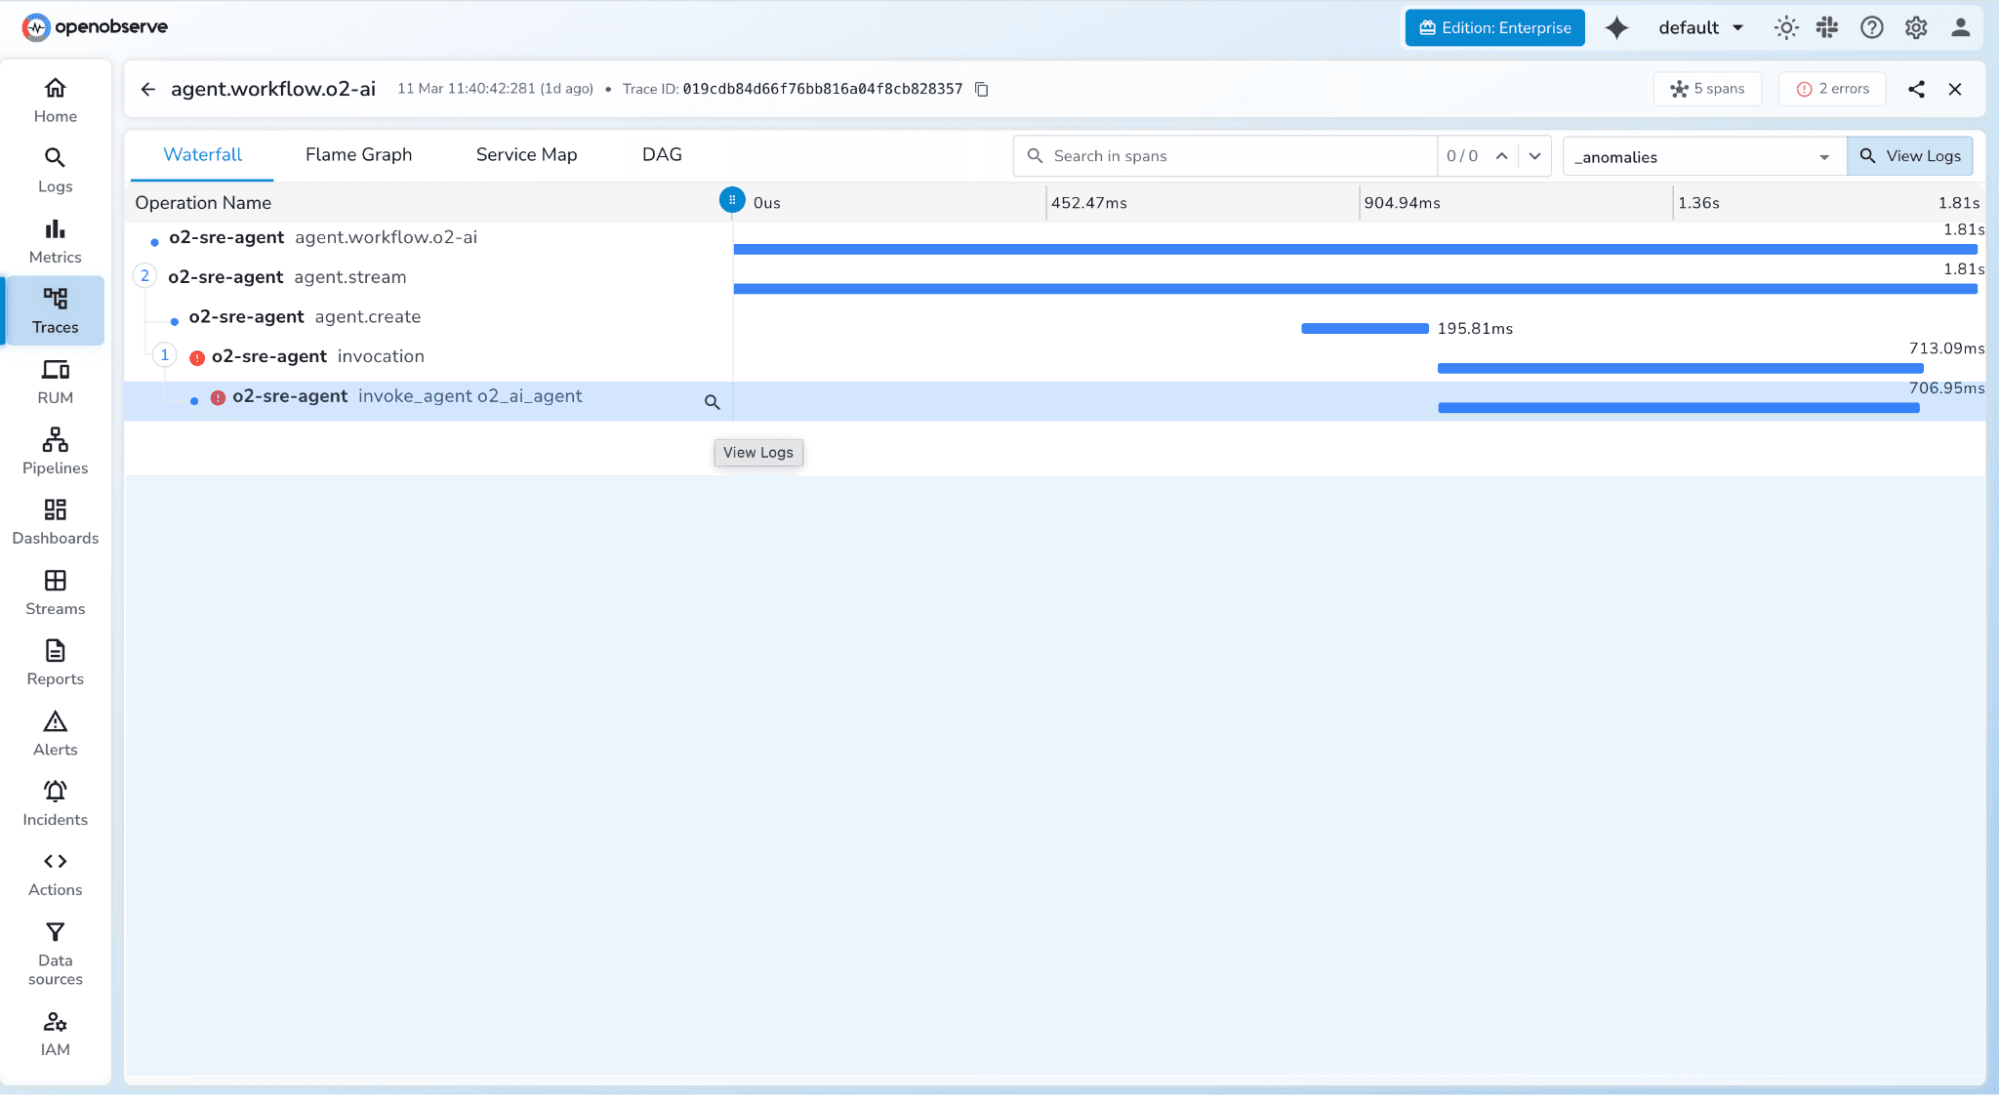
This structure lets you instantly see which step was the bottleneck or failure point in any given agent run.
Setting Up LLM Monitoring with OpenObserve
OpenObserve is an open-source observability platform with a native OTLP endpoint, making it straightforward to ship LLM traces, metrics, and logs into a single unified backend. It is purpose-built for high-volume telemetry at significantly lower cost and resource footprint than alternatives like the Elastic Stack.
Prerequisites
- Python 3.8 or higher
uvpackage manager (orpip)- An OpenObserve account , cloud or self-hosted
- Your OpenObserve organisation ID and Base64-encoded auth token
- API key for your LLM provider (OpenAI, Anthropic, etc.)
Step 1: Configure Your Environment
Create a .env file in your project root:
# OpenObserve instance URL
# Default for self-hosted: http://localhost:5080
OPENOBSERVE_URL=https://api.openobserve.ai/

# Your OpenObserve organisation slug or ID
OPENOBSERVE_ORG=your_org_id

# Basic auth token , Base64-encoded "email:password"
OPENOBSERVE_AUTH_TOKEN="Basic <your_base64_token>"

# Enable or disable tracing (default: true)
OPENOBSERVE_ENABLED=true

# LLM provider keys (add whichever you use)
OPENAI_API_KEY="your-openai-key"
ANTHROPIC_API_KEY="your-anthropic-key"
| Variable | Description | Required |
|---|---|---|
OPENOBSERVE_URL |
Base URL of your OpenObserve instance | Yes |
OPENOBSERVE_ORG |
Organisation slug or ID | Yes |
OPENOBSERVE_AUTH_TOKEN |
Basic <base64(email:password)> |
Yes |
OPENOBSERVE_ENABLED |
Toggle tracing on/off | No (default: true) |
OPENAI_API_KEY |
OpenAI provider key | Optional |
Step 2: Install Dependencies
# Using uv (recommended)
uv pip install openobserve-telemetry-sdk \
               opentelemetry-instrumentation-openai \
               opentelemetry-instrumentation-anthropic \
               python-dotenv

# Or with pip
pip install openobserve-telemetry-sdk opentelemetry-instrumentation-openai python-dotenv
Step 3: Instrument Applications (Examples)
OpenAI
Add two lines to your application entry point , before any LLM calls are made:
from opentelemetry.instrumentation.openai import OpenAIInstrumentor
from openobserve import openobserve_init

# Instrument OpenAI and initialise the OpenObserve exporter
OpenAIInstrumentor().instrument()
openobserve_init()

from openai import OpenAI

client = OpenAI()

# Use the client exactly as normal , traces are captured automatically
response = client.chat.completions.create(
    model="gpt-4o",
    messages=[{"role": "user", "content": "Summarise this document..."}]
)
print(response.choices[0].message.content)
Anthropic (Claude)
from opentelemetry.instrumentation.anthropic import AnthropicInstrumentor
from openobserve import openobserve_init

# Instrument Anthropic and initialise the OpenObserve exporter
AnthropicInstrumentor().instrument()
openobserve_init()

from anthropic import Anthropic

client = Anthropic()
response = client.messages.create(
    model="claude-opus-4-5",
    max_tokens=1024,
    messages=[{"role": "user", "content": "Analyse this data..."}]
)
print(response.content[0].text)
Every call is now captured as a trace span and exported to OpenObserve automatically.
Note: The openobserve-telemetry-sdk is an optional thin wrapper around the standard OpenTelemetry Python SDK that simplifies exporter configuration. If you already use OpenTelemetry in your application, you can send telemetry directly to OpenObserve's OTLP endpoint without it.
Step 5: View Traces in OpenObserve
- Log in to your OpenObserve instance
- Navigate to Traces in the left sidebar
- Filter by service name, model name, or time range
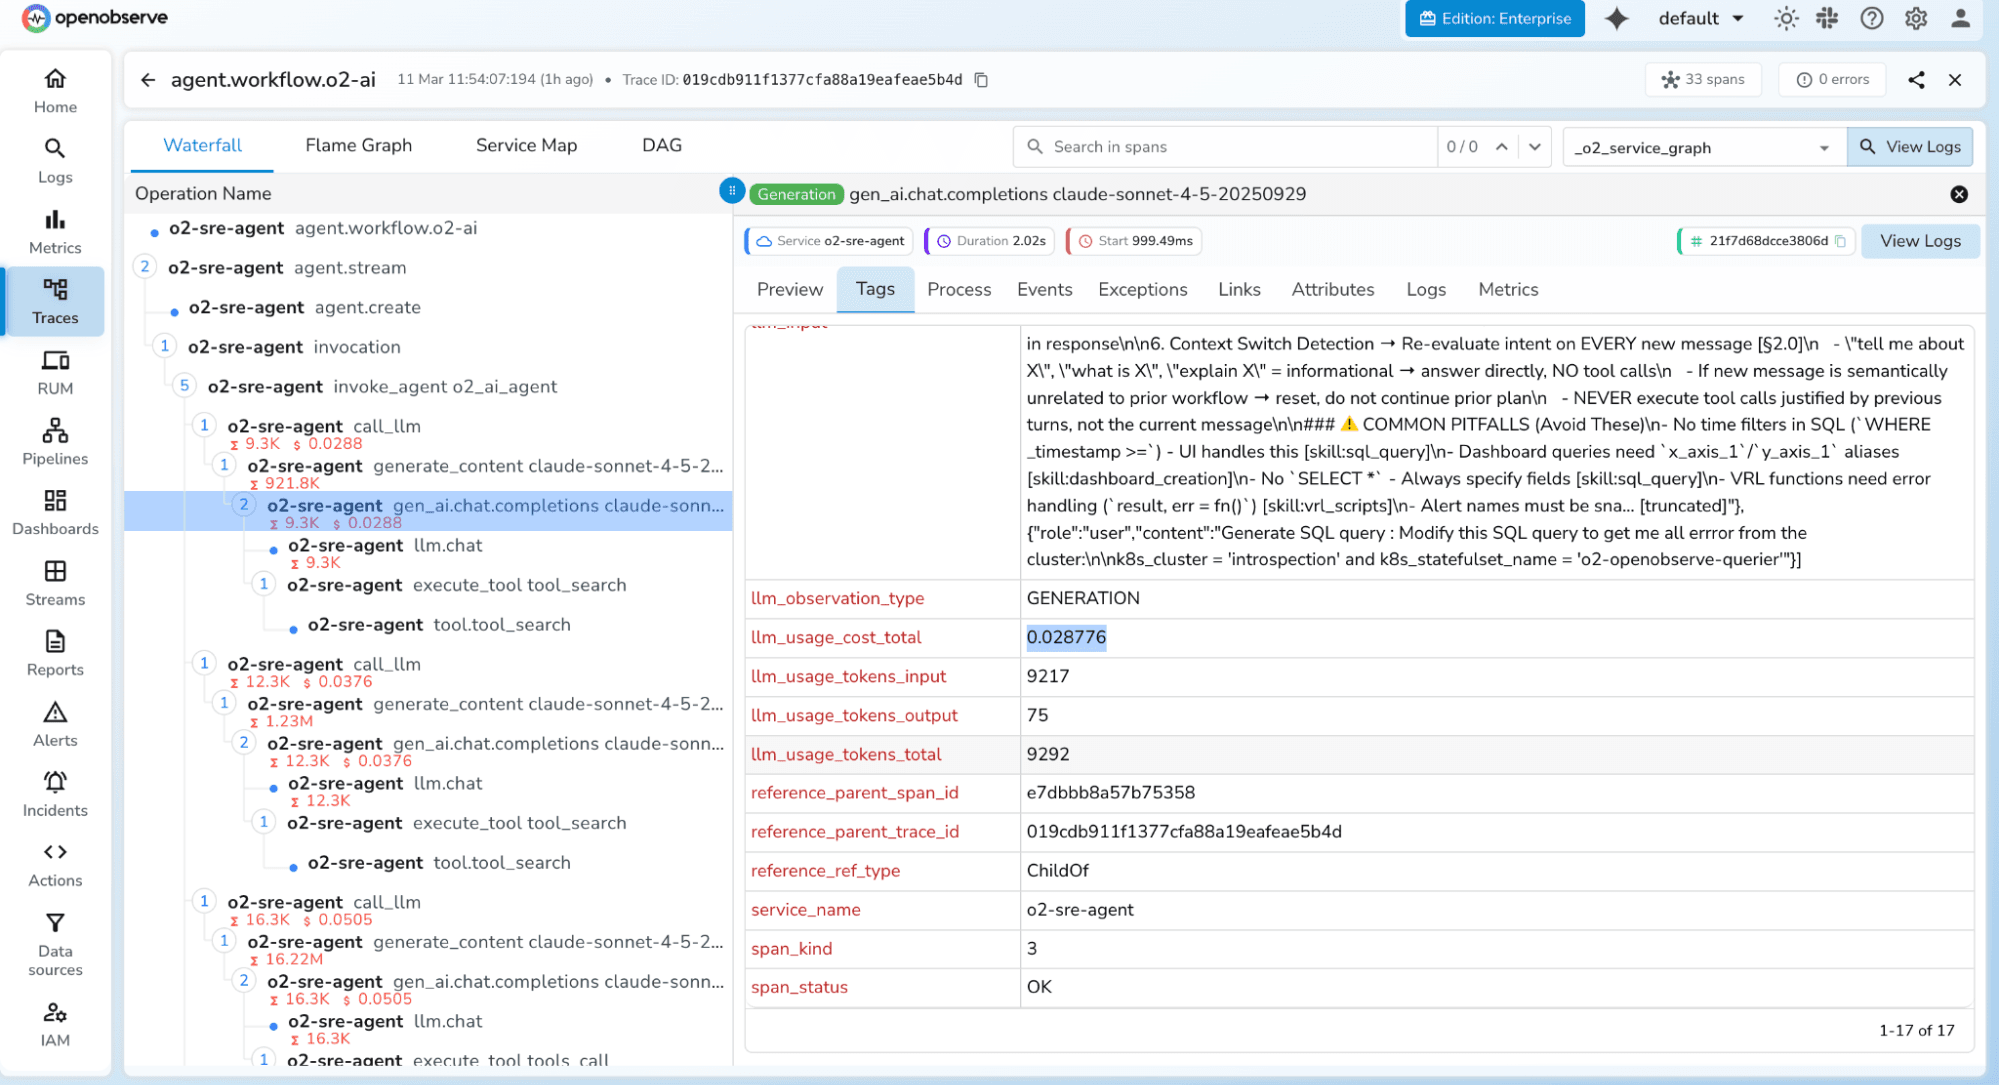
- Click any span to inspect token counts, latency, parameters, and full request metadata
What Gets Captured in Each Trace Span
The OTel instrumentation libraries automatically attach the following semantic attributes to every span , giving you a rich dataset for analysis without any manual coding:
| OTel Attribute | Description | Example Value |
|---|---|---|
llm.request.model |
Model identifier | gpt-4o |
llm.usage.prompt_tokens |
Tokens in the prompt | 1,247 |
llm.usage.completion_tokens |
Tokens in the response | 312 |
llm.usage.total_tokens |
Combined token usage | 1,559 |
llm.request.temperature |
Sampling temperature | 0.7 |
llm.request.max_tokens |
Max response length | 2048 |
duration |
End-to-end request latency | 2,340ms |
error |
Exception details on failure | RateLimitError: 429 |
Beyond these automatic attributes, you can enrich spans with custom attributes , user.id, session.id, agent.name, task.type, prompt.version , to enable deeper segmentation and filtering in your observability backend.
Adding Custom Span Attributes
from opentelemetry import trace

tracer = trace.get_tracer(__name__)

with tracer.start_as_current_span("agent-task") as span:
    span.set_attribute("user.id", "usr_abc123")
    span.set_attribute("session.id", "sess_xyz789")
    span.set_attribute("agent.name", "research-agent")
    span.set_attribute("task.type", "document-summarisation")
    span.set_attribute("prompt.version", "v2.3.1")

    # Your LLM call here , child spans are created automatically
    response = client.chat.completions.create(...)
Unique Challenges in Agentic Systems
Monitoring a simple chatbot is relatively straightforward , one request in, one response out. Autonomous agents introduce a distinct set of challenges that require additional thought and tooling:
Non-Determinism
Unlike traditional software, the same input to an agent may produce different execution paths on different runs, due to the stochastic nature of LLMs. Your monitoring must capture the full trace of each individual run, not just aggregated statistics, so you can investigate specific failure paths in isolation.
Long-Horizon Context Windows
As agents maintain conversation history and accumulate tool call results across multiple turns, context windows grow substantially. A single agent session can consume tens of thousands of tokens, dramatically affecting both cost and latency. Per-turn token tracking is essential to catch context growth before it hits model limits or causes coherence degradation.
Nested and Parallel Tool Calls
Modern agents call multiple tools , web search, code execution, database lookup, image generation , often in parallel. Distributed tracing with proper parent-child span relationships is the only reliable way to reconstruct the true execution timeline and identify which specific tool call was the bottleneck.
Infinite Loop Detection
Agents can get stuck in reasoning loops where they repeatedly call the same tool with slightly different arguments without making measurable progress toward the goal. Monitoring agent.steps and tool_call.count per session, combined with a max-step circuit breaker, is the primary safeguard against this class of failure.
Multi-Agent Coordination
Orchestrator-worker agent architectures require trace context propagation across agent boundaries , often across separate processes or services communicating via message queues or HTTP. OpenTelemetry's W3C TraceContext standard enables this, but it requires explicit propagation when agents hand off work to one another.
from opentelemetry.propagate import inject, extract
import requests

# Orchestrator: inject trace context into outgoing request headers
headers = {}
inject(headers)  # adds traceparent, tracestate headers

# Call worker agent with context propagated
response = requests.post(
    "http://worker-agent/execute",
    json={"task": task_payload},
    headers=headers
)

# Worker agent: extract and continue the trace
context = extract(incoming_request.headers)
with tracer.start_as_current_span("worker-task", context=context):
    # Worker's work here , appears as child span in orchestrator's trace
    ...
Critical: Always propagate the W3C traceparent header when your orchestrator calls a worker agent. Without this, each agent's activity appears as a disconnected root trace rather than a unified session trace , making end-to-end debugging nearly impossible.
Best Practices for AI Agent Monitoring
Instrument Early, Not After the Fact
Add observability instrumentation during development, not after incidents occur in production. Retrofitting observability into a complex agentic system is painful and often leaves blind spots in the most critical execution paths. Start with auto-instrumentation via OTel, then layer in custom span attributes as you discover what context matters for debugging.
Separate Evaluation Metrics from Operational Metrics
Don't conflate system health (latency, error rate, tokens) with output quality (correctness, relevance, safety, faithfulness). Keep them in separate pipelines with separate alert policies. Operational metrics need SLA-grade alerting; quality metrics are better served by periodic evaluation batch jobs with human-in-the-loop review.
Sample Intelligently, Not Uniformly
At scale, tracing every single LLM call at 100% can be expensive. Use head-based sampling to capture a representative percentage of normal traffic (e.g., 10%), but configure tail-based sampling to capture 100% of failed or slow requests. This gives you full fidelity where it matters most without prohibitive storage costs.
Mask Sensitive Data Before Export
Prompt content and completion text can contain PII, proprietary information, or confidential business data. Implement a span processor that redacts or hashes sensitive attribute values before traces leave your application boundary:
from opentelemetry.sdk.trace import SpanProcessor

class SensitiveDataRedactor(SpanProcessor):
    SENSITIVE_ATTRS = ["llm.prompts", "llm.completions", "user.email"]

    def on_end(self, span):
        for attr in self.SENSITIVE_ATTRS:
            if attr in span.attributes:
                span.set_attribute(attr, "[REDACTED]")
Version Your Prompts
Treat prompt templates as software artefacts with version identifiers. Attach the prompt version as a span attribute (prompt.version: v2.3.1). This lets you compare performance metrics across prompt versions after a change , just as you'd compare deployment versions in a canary rollout or A/B test.
Tag Every Trace with Business Context
Add custom span attributes like user.id, session.id, agent.name, task.type, and feature.flag to every trace. These tags transform your observability data from an engineering artefact into a product intelligence asset, enabling you to segment agent behaviour by customer cohort, use case, or deployment configuration.
Build a Feedback Loop from Evals to Prompts
Connect your evaluation pipeline back to your prompt management system. When evaluations detect a quality regression, it should automatically trigger a prompt review workflow and optionally block deployment of the offending prompt version. This is the AI equivalent of failing a CI/CD pipeline on test failures.
Conclusion
As autonomous AI agents take on consequential tasks , writing and executing code, managing business workflows, interacting with customers at scale , the organisations that invest in proper observability will have a decisive operational advantage: faster debugging cycles, lower infrastructure costs, better output quality, and the confidence to scale reliably.
The tooling makes this remarkably accessible. OpenTelemetry auto-instrumentation means you can get production-grade traces flowing into a platform like OpenObserve in under 10 minutes and two lines of code. From that foundation, you incrementally layer in custom attributes, evaluation pipelines, and sophisticated alerting as your system matures.
OpenTelemetry + OpenObserve , gives you a vendor-neutral, open-source foundation that scales from a solo developer's project to an enterprise deployment, without lock-in or prohibitive cost at scale.
You cannot improve what you cannot measure. For AI agents, observability is the measurement layer that makes continuous improvement possible.
Further Reading
About the Author
Simran Kumari

Passionate about observability, AI systems, and cloud-native tools. All in on DevOps and improving the developer experience.
Follow OpenObserve on Google
Add OpenObserve as a preferred source to see more of our articles in Google Search and Top Stories.












