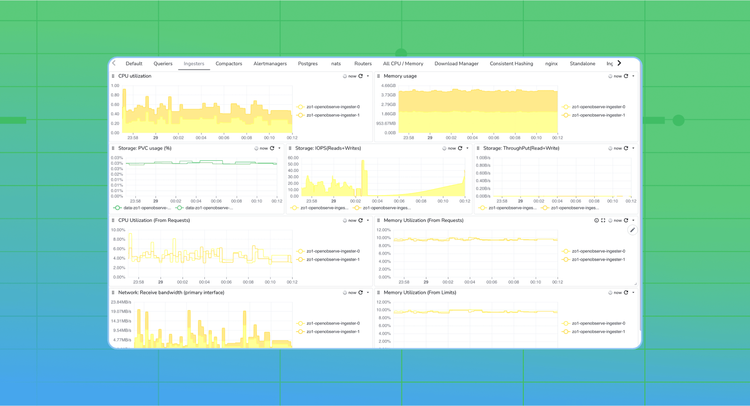
Learn how to effectively monitor your OpenObserve deployment, starting from system health metrics like CPU, memory, and network usage, to OpenObserve’s own internal metrics exposed in Prometheus format. This guide walks through best practices, setup steps, and configuration examples.
A comprehensive comparison of the top 10 observability platforms in 2025 highlighting their strengths, trade-offs, and use-cases.
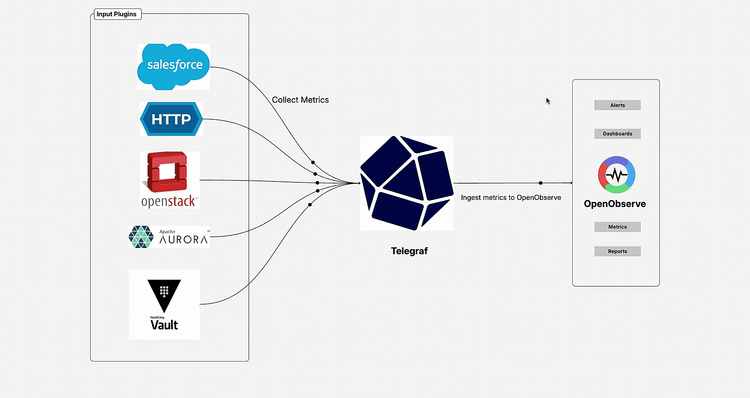
Learn how to collect HTTP metrics with Telegraf and send them to OpenObserve: copy‑paste configs, verification steps, and production best practices.
Learn how to design an enterprise observability strategy built on efficient logging, cost control, and unified insights to scale with complex systems.
Monitor Oracle Database performance with OpenTelemetry and OpenObserve. Collect metrics, logs, and build dashboards for real-time insights.
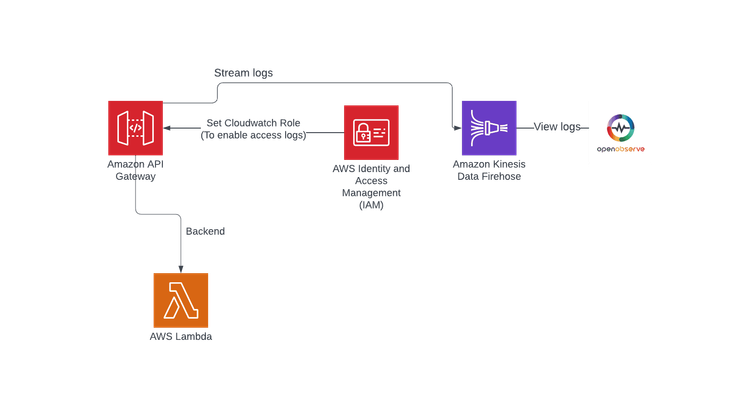
Discover the importance of log monitoring for API performance, step-by-step instructions on setting up a Lambda function, creating a REST API, and configuring Kinesis Firehose for seamless log streaming.
Efficient log parsing with OpenObserve unlocks real-time analytics, troubleshooting, and alerting through VRL, flexible pipelines, and seamless ingestion.
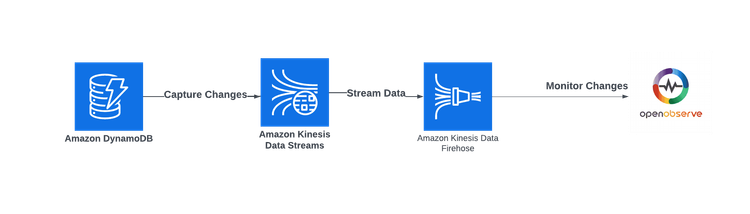
Learn effective ways to monitor DynamoDB tables using AWS Kinesis Data Streams and Firehose. Enhance your data management strategies today!
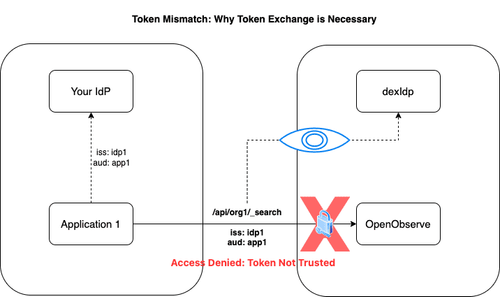
Discover OpenObserve’s Service Accounts feature, designed for secure programmatic access to APIs. Learn how token exchange enhances security and simplifies automation.
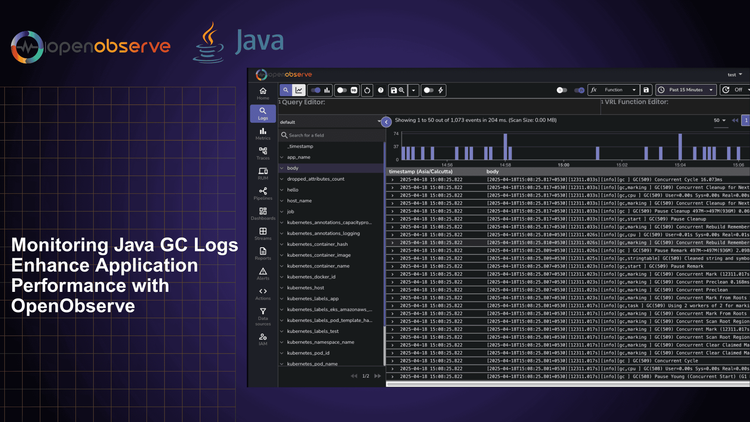
Learn how to leverage Java GC logs to diagnose memory issues, optimize application performance, and prevent production outages. This guide explains how to interpret GC log patterns and use OpenObserve for practical monitoring and analysis.
Learn how to implement effective SNMP monitoring using OpenTelemetry and OpenObserve. Monitor network devices, servers, and infrastructure with real-time insights and improved troubleshooting.
Unlock the full potential of your ArgoCD deployments with Prometheus and OpenObserve monitoring. Get real-time insights into application health, sync status, and reconciliation performance.
Set up comprehensive Windows monitoring with OpenObserve. Collect, analyze, and visualize event logs, performance metrics, and security events for enhanced troubleshooting and system visibility.
Monitor Linux systems with OpenObserve. Learn how to collect and analyze system logs, metrics, and security events for improved system visibility, troubleshooting, and compliance. Get insights into performance monitoring and security with OpenObserve.
Learn how to capture and analyze Amazon EKS Fargate logs using AWS's built-in Fluent Bit log router, Kinesis Firehose, and OpenObserve for comprehensive container monitoring.
Learn how to monitor Docker container metrics using OpenTelemetry and OpenObserve. Collect CPU, memory, network, and disk metrics without modifying your applications.
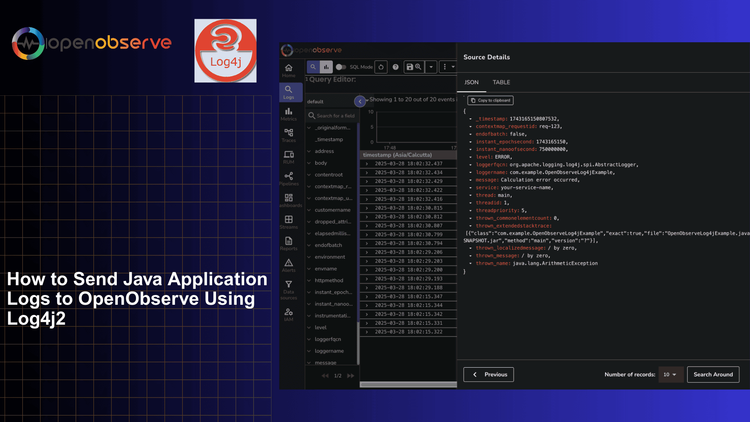
A comprehensive guide to configuring Log4j2 to send structured logs to OpenObserve for centralized logging and analysis of Java applications.
This comprehensive guide walks you through the process of integrating PagerDuty with OpenObserve for effective incident management. You'll learn how to set up a PagerDuty service, create alert templates in OpenObserve, configure webhook destinations, and test your integration. Perfect for DevOps engineers, SREs, and IT professionals looking to streamline their alerting workflow and improve response times to critical issues.
Learn how to configure Datadog Agent to send metrics to OpenObserve using OpenTelemetry Collector. Complete guide with setup, troubleshooting & best practices.
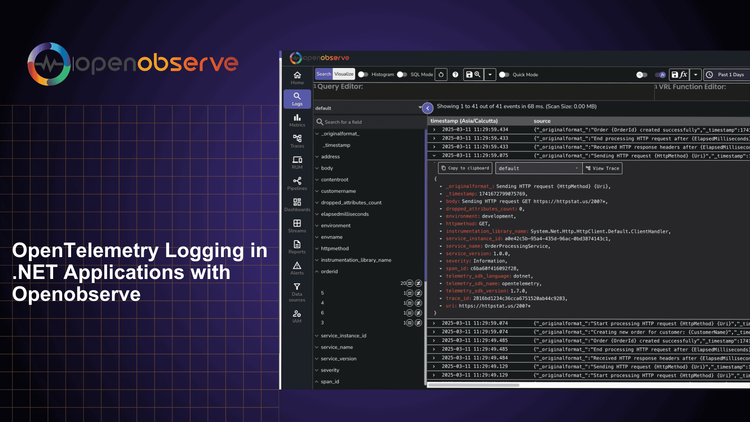
Learn how to implement OpenTelemetry logging in .NET applications using OpenObserve. Step-by-step guide to configure, collect, and analyze logs.
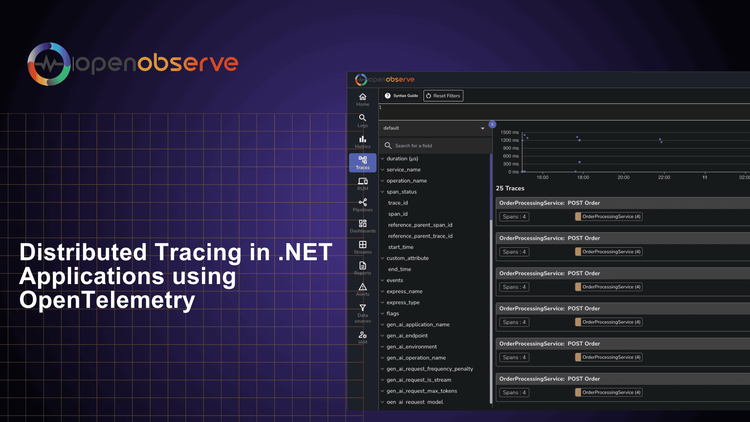
Learn how to implement distributed tracing in your .NET applications using OpenTelemetry. This guide covers the benefits of distributed tracing, how to get started with OpenTelemetry, and best practices for implementation.