Distributed Tracing in .NET Applications using OpenTelemetry




Ready to get started?
Try OpenObserve Cloud today for more efficient and performant observability.
Introduction
Ever wondered how to track a request's journey through your .NET application? As your application grows, identifying performance bottlenecks or debugging issues becomes increasingly complex. Distributed tracing solves this by providing visibility into your application's behavior and request flow.
In this tutorial, we'll implement distributed tracing in a .NET Web API application using OpenTelemetry. We'll build a simple order processing service and learn how to capture and visualize traces using OpenObserve.
What is OpenTelemetry?
OpenTelemetry (OTel) is a collection of tools, APIs, and SDKs used to instrument, generate, collect, and export telemetry data for analysis. It provides a standardized way to:
- Instrument your application code
- Collect trace data
- Export data to various backends (like OpenObserve, Jaeger, Zipkin)
The best part? It's vendor-neutral and supported by major observability providers, making it a future-proof choice for your observability needs.
Prerequisites and Environment Setup
Before we dive into implementation, ensure you have:
- .NET SDK 6.0 or newer installed on your system
- An OpenObserve account (You can use OpenObserve Cloud or set up a self-hosted installation)
Getting Started
We'll build an order processing API that demonstrates practical tracing scenarios in a .NET application. To follow along:
git clone https://github.com/openobserve/dotnet-opentelemetry-tracing-application
cd dotnet-opentelemetry-tracing-application
In .NET applications, OpenTelemetry uses the Activity class to represent operations you want to track. When you create an Activity, OpenTelemetry automatically creates a corresponding span in your distributed trace. This makes it natural to integrate tracing into your .NET code.
OpenTelemetry provides two powerful ways to instrument your application. Auto-instrumentation handles common scenarios like HTTP requests and database calls automatically, while manual instrumentation lets you track specific business operations that matter to your application.
Our demo application showcases both approaches with two endpoints:
POST /order- Creates a new orderGET /order/{id}- Retrieves an order by ID
The endpoints demonstrate end-to-end tracing capabilities: from ASP.NET Core request handling, through custom business operations (using ActivitySource), to external HTTP calls (via HttpClient instrumentation). This provides visibility into both framework-level and application-specific operations.
Configuring OpenTelemetry in Your .NET Application
To start capturing traces in our application, we need to set up OpenTelemetry with the right configuration and packages.
dotnet add package OpenTelemetry --version 1.7.0
dotnet add package OpenTelemetry.Extensions.Hosting --version 1.7.0
dotnet add package OpenTelemetry.Instrumentation.AspNetCore --version 1.7.0
dotnet add package OpenTelemetry.Exporter.OpenTelemetryProtocol --version 1.7.0
dotnet add package OpenTelemetry.Instrumentation.Http --version 1.7.0
The application uses an ActivitySource to create traces. This is defined in our TracingInstrumentation class:
public static class TracingInstrumentation
{
    public const string ServiceName = "OrderProcessingService";
    public static readonly ActivitySource ActivitySource =
        new(ServiceName, "1.0.0");
}
Implementing Tracing in Our API Endpoints
Let's look at how we capture traces in our order processing API. Here's our create order endpoint with OpenTelemetry instrumentation:
[HttpPost]
public async Task<IActionResult> CreateOrder(Order order)
{
    using var activity = TracingInstrumentation.ActivitySource.StartActivity("CreateOrder");
    activity?.SetTag("order.customer", order.CustomerName);
    activity?.SetTag("order.amount", order.Amount);

    // Simulate external API call
    using var validateActivity = TracingInstrumentation.ActivitySource.StartActivity("ValidateCustomer");
    await _httpClient.GetAsync("https://httpstat.us/200?sleep=100");

    order.Id = _orders.Count + 1;
    _orders.Add(order);

    return Ok(order);
}
The key elements here:
StartActivity()creates a new span in your traceSetTag()adds business context to your spansHttpClientcalls are automatically traced thanks to our OpenTelemetry configuration
To Restore Dependencies:
dotnet restore
Before running the application, you'll need to update the exporter configuration with your OpenObserve credentials. In Program.cs, configure the export of traces to OpenObserve
.AddOtlpExporter(opts =>
{
    opts.Endpoint = new Uri("your_openobserve_url/v1/traces");
    opts.Headers = "Authorization=Basic YOUR_AUTH_TOKEN";
    opts.Protocol = OpenTelemetry.Exporter.OtlpExportProtocol.HttpProtobuf;
});
Replace the placeholder values with your OpenObserve credentials:
- Get your OpenObserve endpoint and credentials from: Data Sources → Custom → Traces → OpenTelemetry → OTLP HTTP
- Add
/v1/tracesto your OTLP HTTP endpoint
Now you can run the application:
dotnet run
Test the endpoints using curl (replace the port number with what you see in the console):
# Create an order
curl -X POST https://localhost:5xxx/order \
  -H "Content-Type: application/json" \
  -d '{"customerName":"Test User","amount":150.00}' \
  -k

# Get an order
curl -k https://localhost:5xxx/order/1
Viewing Traces in OpenObserve
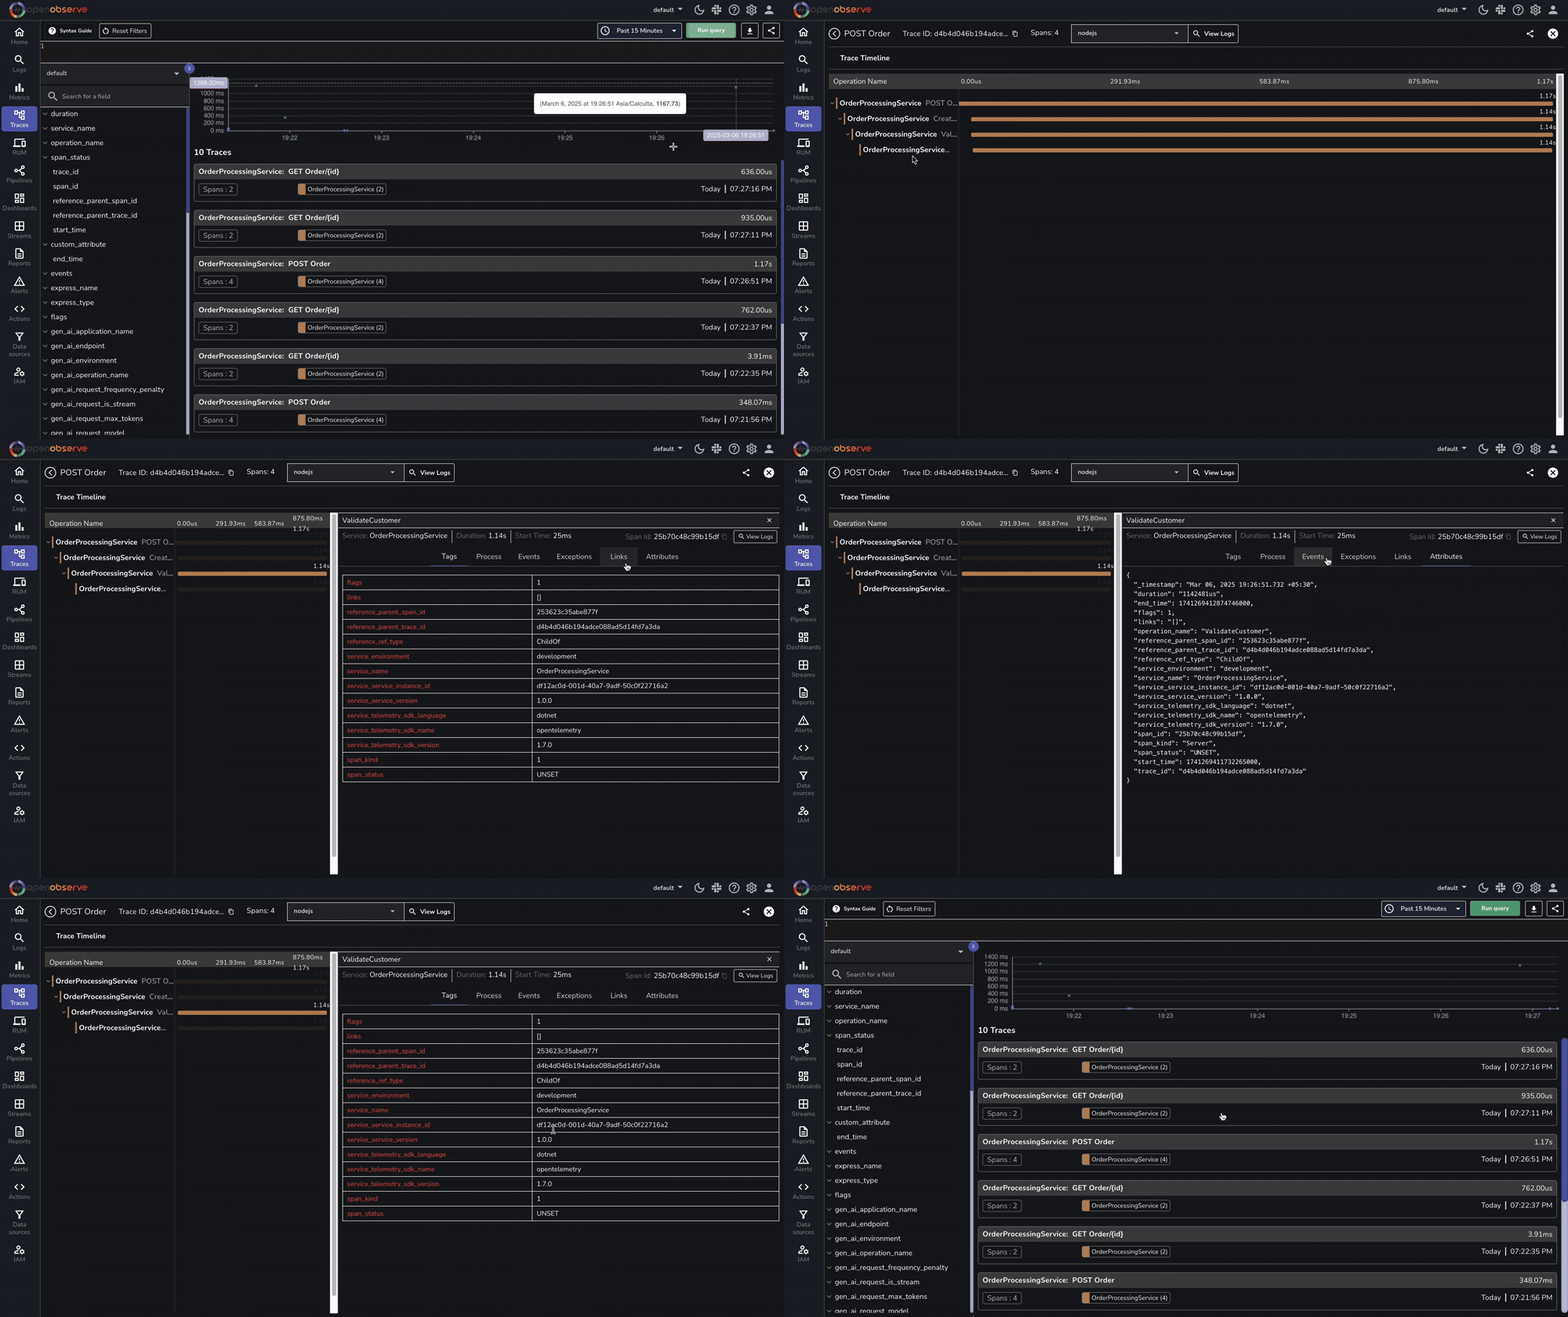
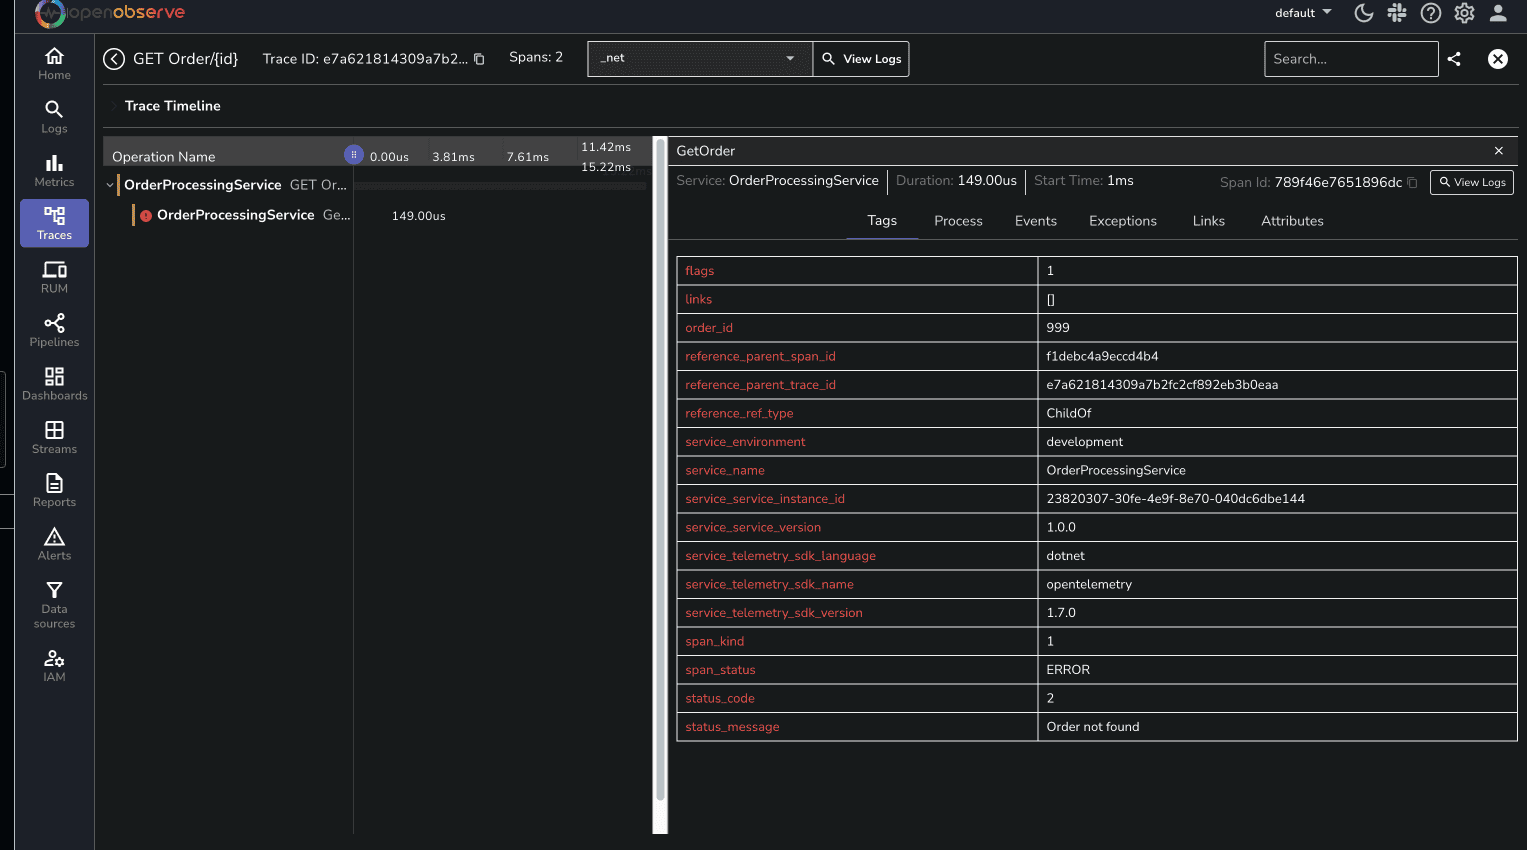
Once your application is running and processing requests, you can view the generated traces in OpenObserve. Here's what to look for:
- Log into your OpenObserve account and navigate to the Traces section
- You'll see traces from your service named "OrderProcessingService"
Troubleshooting
Not seeing traces in OpenObserve? Check these common issues:
- Verify your OpenObserve endpoint includes
/v1/traces - Check your authentication token
- Make several test requests to generate traces
- Wait a few moments - OpenTelemetry buffers traces before sending
- Check application logs for any export errors
Next Steps
Now that you have tracing set up in your .NET application:
- Explore combining traces with logs for better debugging
- Set up trace-based alerts in OpenObserve
- Explore OpenTelemetry .NET SDK documentation
The sample code is available in our GitHub repository- feel free to use it as a starting point for your implementation.
Join our Slack community for support.
Happy Monitoring! 🚀
About the Author
Manas Sharma


Manas is a passionate Dev and Cloud Advocate with a strong focus on cloud-native technologies, including observability, cloud, kubernetes, and opensource. building bridges between tech and community.
Follow OpenObserve on Google
Add OpenObserve as a preferred source to see more of our articles in Google Search and Top Stories.













