What is SNMP Monitoring? OpenTelemetry and OpenObserve Guide




Ready to get started?
Try OpenObserve Cloud today for more efficient and performant observability.
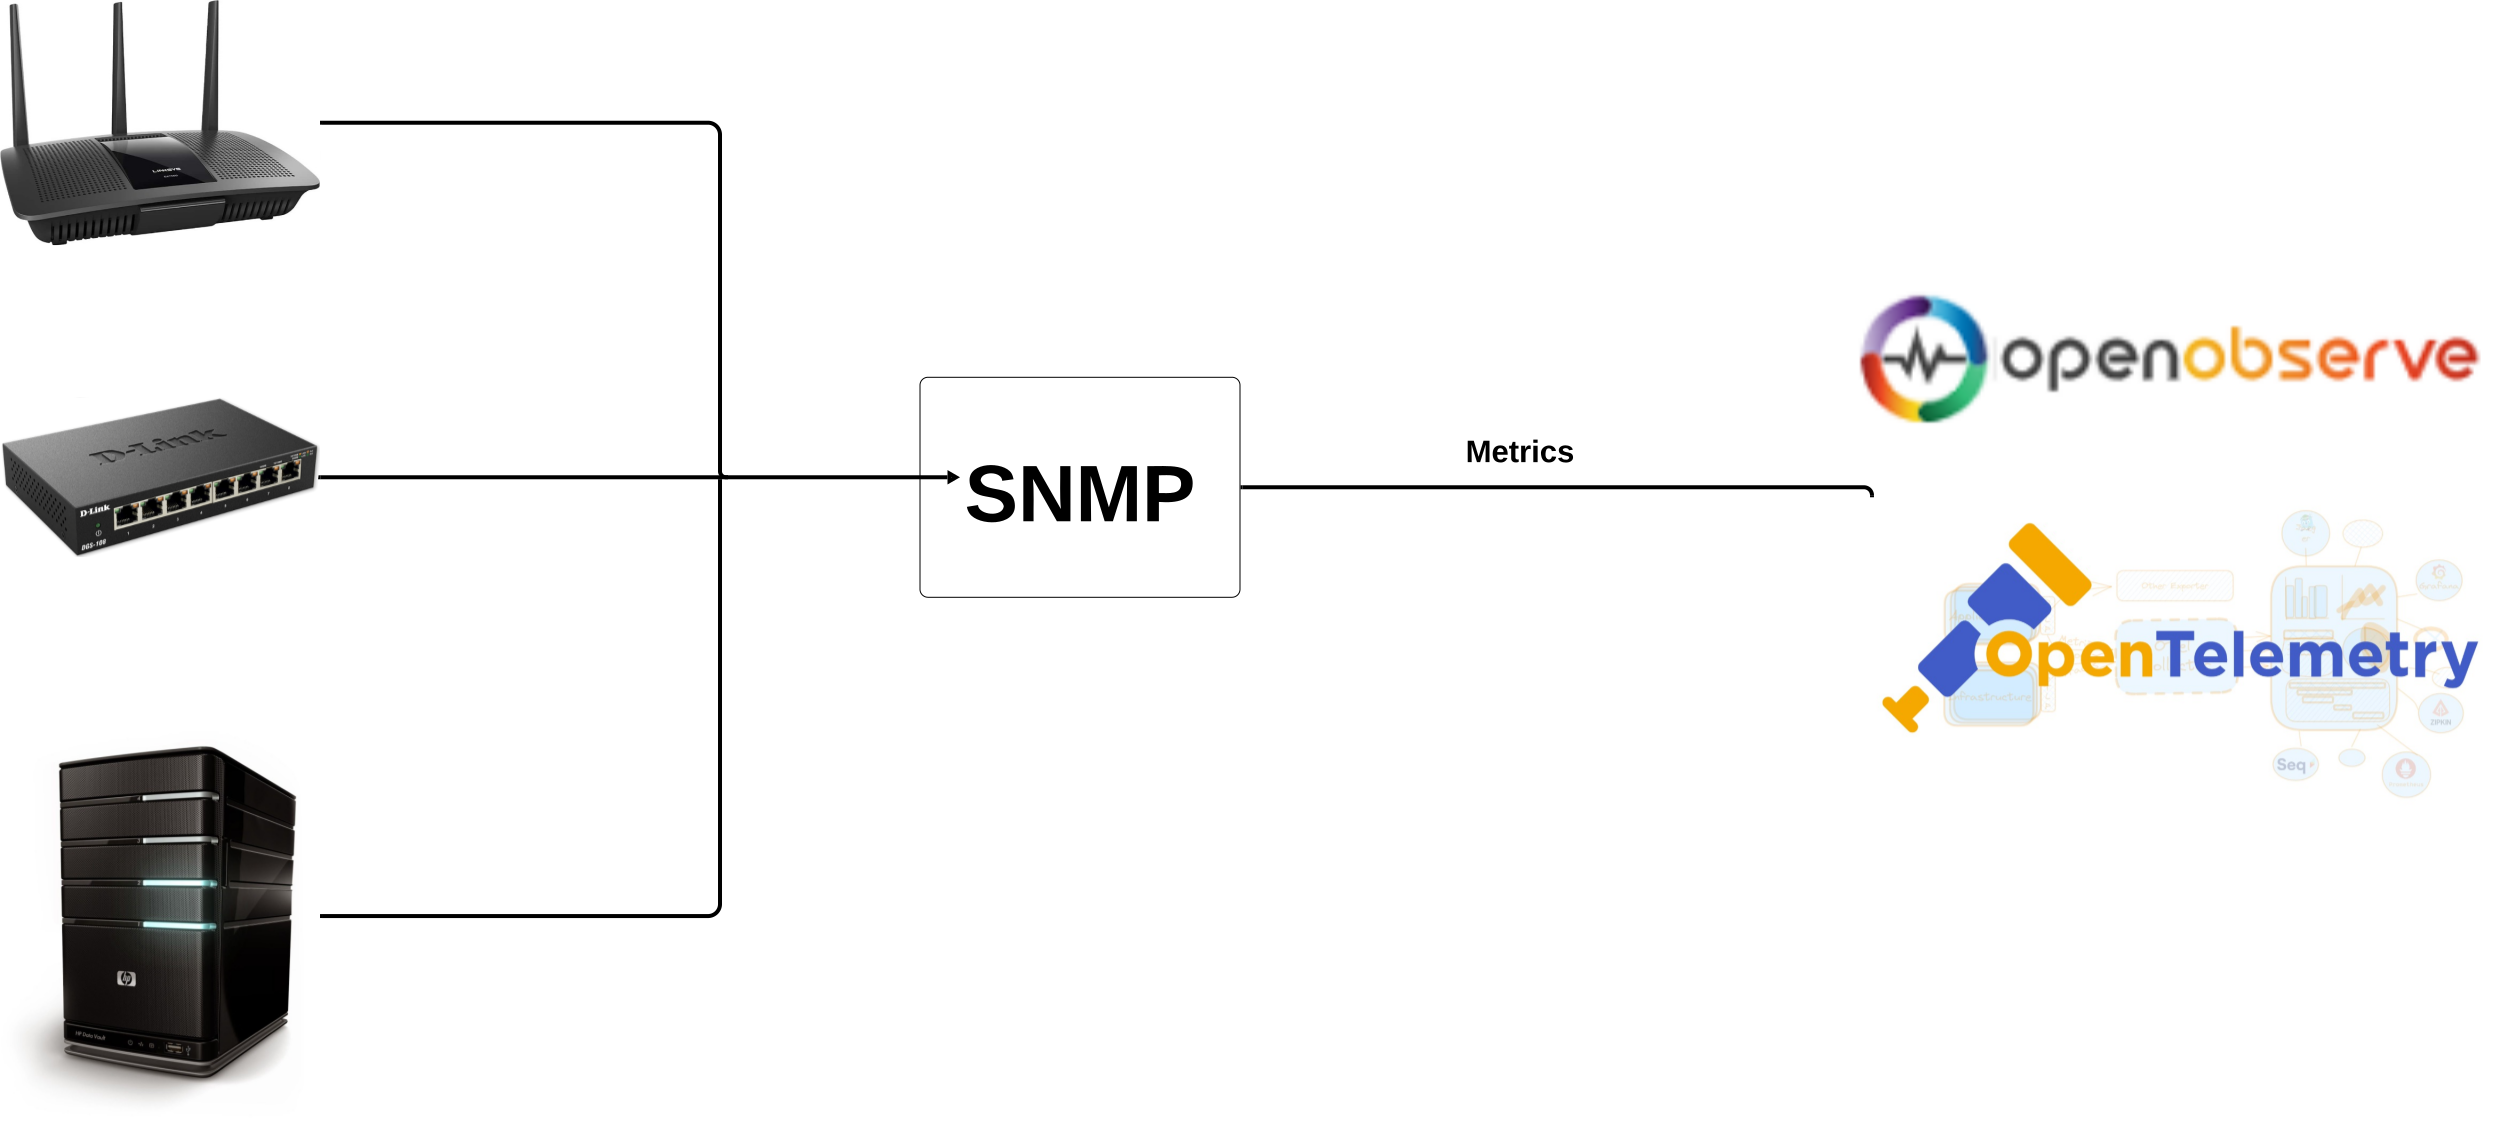
Simple Network Management Protocol (SNMP) has been the cornerstone of network monitoring for decades. From routers and switches to servers and IoT devices, SNMP provides a standardized way to collect vital performance metrics. In this guide, we'll explore how to implement SNMP monitoring using OpenTelemetry and OpenObserve, bringing modern observability practices to this established protocol.
What is SNMP Monitoring?
SNMP (Simple Network Management Protocol) is a widely-used protocol for collecting and organizing information about managed devices on IP networks. It enables administrators to monitor network performance, identify and troubleshoot issues, and plan for network growth.
SNMP operates on a manager-agent model:
- SNMP Manager: The central system that collects and processes data from network devices.
- SNMP Agents: Software components on network devices that collect local information and make it available to the manager.
- Management Information Base (MIB): A hierarchical database that defines the structure of management data.
Key Operations in SNMP
- GET: Retrieves specific information from a device
- SET: Modifies device settings or configurations
- TRAP: Allows devices to send unsolicited notifications to the SNMP Manager
SNMP Versions
SNMP has evolved through several versions, each with different capabilities and security features:
| Version | Authentication | Security | Performance | Use Case |
|---|---|---|---|---|
| SNMPv1 | Community strings (plaintext) | Minimal | Basic | Small, non-critical networks |
| SNMPv2c | Community strings (plaintext) | Minimal | Improved with GETBULK operation | Networks where performance is prioritized over security |
| SNMPv3 | User-based with encryption | Strong with encryption and access control | Similar to v2c with security overhead | Modern networks with security requirements |
The OpenTelemetry SNMP Receiver
The SNMP Receiver is a component of the OpenTelemetry Collector Contrib distribution that enables you to fetch statistics from SNMP-enabled devices. It supports all three SNMP versions (v1, v2c, and v3) and offers a flexible configuration model for collecting metrics.
Key Features
- Support for all SNMP versions (v1, v2c, v3)
- Flexible resource attribute mapping
- Configurable metric collection based on OIDs
- Support for both scalar OIDs and tabular data
- Customizable collection intervals
Setting Up SNMP Monitoring with OpenTelemetry
Prerequisites
To implement SNMP monitoring with OpenTelemetry and OpenObserve, you'll need:
- SNMP-enabled devices to monitor (routers, switches, servers, etc.)
- OpenTelemetry Collector Contrib which includes the SNMP receiver
- OpenObserve instance for storing and visualizing the collected metrics
Step 1: Install the OpenTelemetry Collector
First, you'll need to download and install the OpenTelemetry Collector Contrib, which includes the SNMP receiver:
# For macOS with Apple Silicon
curl -Lo otelcol-contrib.tar.gz https://github.com/open-telemetry/opentelemetry-collector-releases/releases/download/v0.116.0/otelcol-contrib_0.116.0_darwin_arm64.tar.gz

tar -xzf otelcol-contrib.tar.gz
sudo mv otelcol-contrib /usr/local/bin/
Verify the installation:
otelcol-contrib --version
Step 2: Verify SNMP Access to Network Devices
Before configuring the collector, verify that you can access your SNMP devices using a tool like snmpwalk:
# For SNMPv2c (most common in network devices)
snmpwalk -v 2c -c public 192.168.1.1

# For SNMPv3
snmpwalk -v 3 -u user -l authPriv -a SHA -A "auth_password" -x AES -X "privacy_password" 192.168.1.1
Replace 192.168.1.1 with your device's IP address and public with the appropriate community string.
Step 3: Configure the OpenTelemetry Collector for Network Monitoring
Create a configuration file named config.yaml with the following content focusing on network interface metrics:
receivers:
  snmp:
    collection_interval: 60s
    endpoint: udp://192.168.1.1:161 # Replace with your network device IP
    version: v2c
    community: public # Replace with your community string

    # Define resource attributes for device identification
    resource_attributes:
      device.name:
        scalar_oid: "1.3.6.1.2.1.1.5.0" # sysName
      device.location:
        scalar_oid: "1.3.6.1.2.1.1.6.0" # sysLocation
      device.type:
        scalar_oid: "1.3.6.1.2.1.1.2.0" # sysObjectID

    # Define attributes for interface metrics
    attributes:
      interface.name:
        oid: "1.3.6.1.2.1.2.2.1.2" # ifDescr
      interface.speed:
        oid: "1.3.6.1.2.1.2.2.1.5" # ifSpeed
      interface.type:
        oid: "1.3.6.1.2.1.2.2.1.3" # ifType
      interface.direction:
        enum:
          - in
          - out

    # Define metrics to collect
    metrics:
      # Interface operational status (up/down)
      interface.status:
        unit: "{status}"
        description: "Operational status of the network interface (1=up, 2=down)"
        gauge:
          value_type: int
        column_oids:
          - oid: "1.3.6.1.2.1.2.2.1.8" # ifOperStatus
            attributes:
              - name: interface.name

      # Interface administrative status (up/down)
      interface.admin.status:
        unit: "{status}"
        description: "Administrative status of the network interface (1=up, 2=down)"
        gauge:
          value_type: int
        column_oids:
          - oid: "1.3.6.1.2.1.2.2.1.7" # ifAdminStatus
            attributes:
              - name: interface.name

      # Network traffic (bytes)
      network.io.bytes:
        unit: "By"
        description: "Network traffic volume in bytes"
        sum:
          aggregation: cumulative
          monotonic: true
          value_type: int
        column_oids:
          - oid: "1.3.6.1.2.1.2.2.1.10" # ifInOctets
            attributes:
              - name: interface.name
              - name: interface.direction
                value: in
          - oid: "1.3.6.1.2.1.2.2.1.16" # ifOutOctets
            attributes:
              - name: interface.name
              - name: interface.direction
                value: out

      # Network packets (unicast)
      network.io.packets.unicast:
        unit: "{packets}"
        description: "Number of unicast packets"
        sum:
          aggregation: cumulative
          monotonic: true
          value_type: int
        column_oids:
          - oid: "1.3.6.1.2.1.2.2.1.11" # ifInUcastPkts
            attributes:
              - name: interface.name
              - name: interface.direction
                value: in
          - oid: "1.3.6.1.2.1.2.2.1.17" # ifOutUcastPkts
            attributes:
              - name: interface.name
              - name: interface.direction
                value: out

      # Network errors
      network.io.errors:
        unit: "{errors}"
        description: "Number of packet errors"
        sum:
          aggregation: cumulative
          monotonic: true
          value_type: int
        column_oids:
          - oid: "1.3.6.1.2.1.2.2.1.14" # ifInErrors
            attributes:
              - name: interface.name
              - name: interface.direction
                value: in
          - oid: "1.3.6.1.2.1.2.2.1.20" # ifOutErrors
            attributes:
              - name: interface.name
              - name: interface.direction
                value: out

      # Discarded packets
      network.io.discards:
        unit: "{packets}"
        description: "Number of discarded packets"
        sum:
          aggregation: cumulative
          monotonic: true
          value_type: int
        column_oids:
          - oid: "1.3.6.1.2.1.2.2.1.13" # ifInDiscards
            attributes:
              - name: interface.name
              - name: interface.direction
                value: in
          - oid: "1.3.6.1.2.1.2.2.1.19" # ifOutDiscards
            attributes:
              - name: interface.name
              - name: interface.direction
                value: out

processors:
  batch:
    send_batch_size: 1000
    timeout: 10s
  resourcedetection/system:
    detectors: ["system"]
    system:
      hostname_sources: ["dns", "os"]

exporters:
  otlphttp/openobserve:
    endpoint: https://your-openobserve-instance.com/api/default # Replace with your OpenObserve endpoint
    headers:
      Authorization: Basic YOUR_AUTH_TOKEN_HERE # Replace with your OpenObserve auth token
      stream-name: default
  debug:
    verbosity: detailed

service:
  telemetry:
    logs:
      level: info
  pipelines:
    metrics:
      receivers: [snmp]
      processors: [resourcedetection/system, batch]
      exporters: [otlphttp/openobserve, debug]
Make sure to replace the following values:
192.168.1.1with your network device's IP addresspublicwith your community stringhttps://your-openobserve-instance.com/api/defaultwith your OpenObserve endpointYOUR_AUTH_TOKEN_HEREwith your OpenObserve authentication token
Step 4: Run the OpenTelemetry Collector
Start the OpenTelemetry Collector with the configuration file:
otelcol-contrib --config config.yaml
You should see logs indicating that the collector has started and is collecting metrics from your SNMP devices.
Understanding the SNMP Receiver Configuration
Let's break down the key components of the SNMP receiver configuration to better understand how it works:
Connection Settings
snmp:
  collection_interval: 60s
  endpoint: udp://192.168.1.1:161
  version: v2c
  community: public
- collection_interval: How often to collect metrics (default: 10s)
- endpoint: The SNMP device endpoint in the format
[udp|tcp]://host:port - version: SNMP version to use (v1, v2c, or v3)
- community: The community string for SNMPv1 and SNMPv2c
For SNMPv3, which provides enhanced security, you would use the following parameters:
version: v3
security_level: auth_priv # Options: no_auth_no_priv, auth_no_priv, auth_priv
user: otel
auth_type: "SHA" # Options: MD5, SHA, SHA224, SHA256, SHA384, SHA512
auth_password: "${env:SNMP_AUTH_PASSWORD}"
privacy_type: "AES" # Options: DES, AES, AES192, AES256, AES192c, AES256c
privacy_password: "${env:SNMP_PRIVACY_PASSWORD}"
Resource Attributes and Attributes
The configuration defines two types of attributes:
Resource attributes: Identify the device itself
resource_attributes: device.name: scalar_oid: "1.3.6.1.2.1.1.5.0" # sysNameAttributes: Provide context for individual metrics
attributes:
  interface.name:
    oid: "1.3.6.1.2.1.2.2.1.2" # ifDescr
Both can be populated using different methods:
scalar_oid: A single OID value (must end in .0)oid: A column OID in a table that returns multiple valuesindexed_value_prefix: A string prefix added to indicesenum: A list of predefined values
Metric Definitions
The metrics section defines what data to collect and how to structure it:
metrics:
  network.io.bytes:
    unit: "By"
    description: "Network traffic volume in bytes"
    sum:
      aggregation: cumulative
      monotonic: true
      value_type: int
    column_oids:
      - oid: "1.3.6.1.2.1.2.2.1.10" # ifInOctets
        attributes:
          - name: interface.name
          - name: interface.direction
            value: in
Each metric definition includes:
- unit: The unit of measurement (e.g., "By" for bytes)
- description: A human-readable description of the metric
- type: Either
gaugeorsumwith appropriate configuration - data source: Either
scalar_oidsfor single values orcolumn_oidsfor table data - attribute mapping: How to associate attributes with the metric data points
Essential SNMP OIDs for Network Monitoring
SNMP uses Object Identifiers (OIDs) to uniquely identify managed objects. Here are the most important OIDs for network monitoring:
System Information
| OID | Description | MIB |
|---|---|---|
| 1.3.6.1.2.1.1.1.0 | System Description | SNMPv2-MIB::sysDescr |
| 1.3.6.1.2.1.1.2.0 | System Object ID | SNMPv2-MIB::sysObjectID |
| 1.3.6.1.2.1.1.3.0 | System Uptime | SNMPv2-MIB::sysUpTime |
| 1.3.6.1.2.1.1.4.0 | System Contact | SNMPv2-MIB::sysContact |
| 1.3.6.1.2.1.1.5.0 | System Name | SNMPv2-MIB::sysName |
| 1.3.6.1.2.1.1.6.0 | System Location | SNMPv2-MIB::sysLocation |
Interface Statistics
| OID | Description | MIB |
|---|---|---|
| 1.3.6.1.2.1.2.2.1.2 | Interface Description | IF-MIB::ifDescr |
| 1.3.6.1.2.1.31.1.1.1.1 | Interface Name | IF-MIB::ifName |
| 1.3.6.1.2.1.2.2.1.8 | Interface Operational Status | IF-MIB::ifOperStatus |
| 1.3.6.1.2.1.2.2.1.7 | Interface Administrative Status | IF-MIB::ifAdminStatus |
| 1.3.6.1.2.1.2.2.1.10 | Incoming Traffic (bytes) | IF-MIB::ifInOctets |
| 1.3.6.1.2.1.2.2.1.16 | Outgoing Traffic (bytes) | IF-MIB::ifOutOctets |
| 1.3.6.1.2.1.2.2.1.11 | Incoming Unicast Packets | IF-MIB::ifInUcastPkts |
| 1.3.6.1.2.1.2.2.1.17 | Outgoing Unicast Packets | IF-MIB::ifOutUcastPkts |
| 1.3.6.1.2.1.2.2.1.14 | Incoming Errors | IF-MIB::ifInErrors |
| 1.3.6.1.2.1.2.2.1.20 | Outgoing Errors | IF-MIB::ifOutErrors |
| 1.3.6.1.2.1.2.2.1.13 | Incoming Discards | IF-MIB::ifInDiscards |
| 1.3.6.1.2.1.2.2.1.19 | Outgoing Discards | IF-MIB::ifOutDiscards |
Visualizing SNMP Metrics in OpenObserve
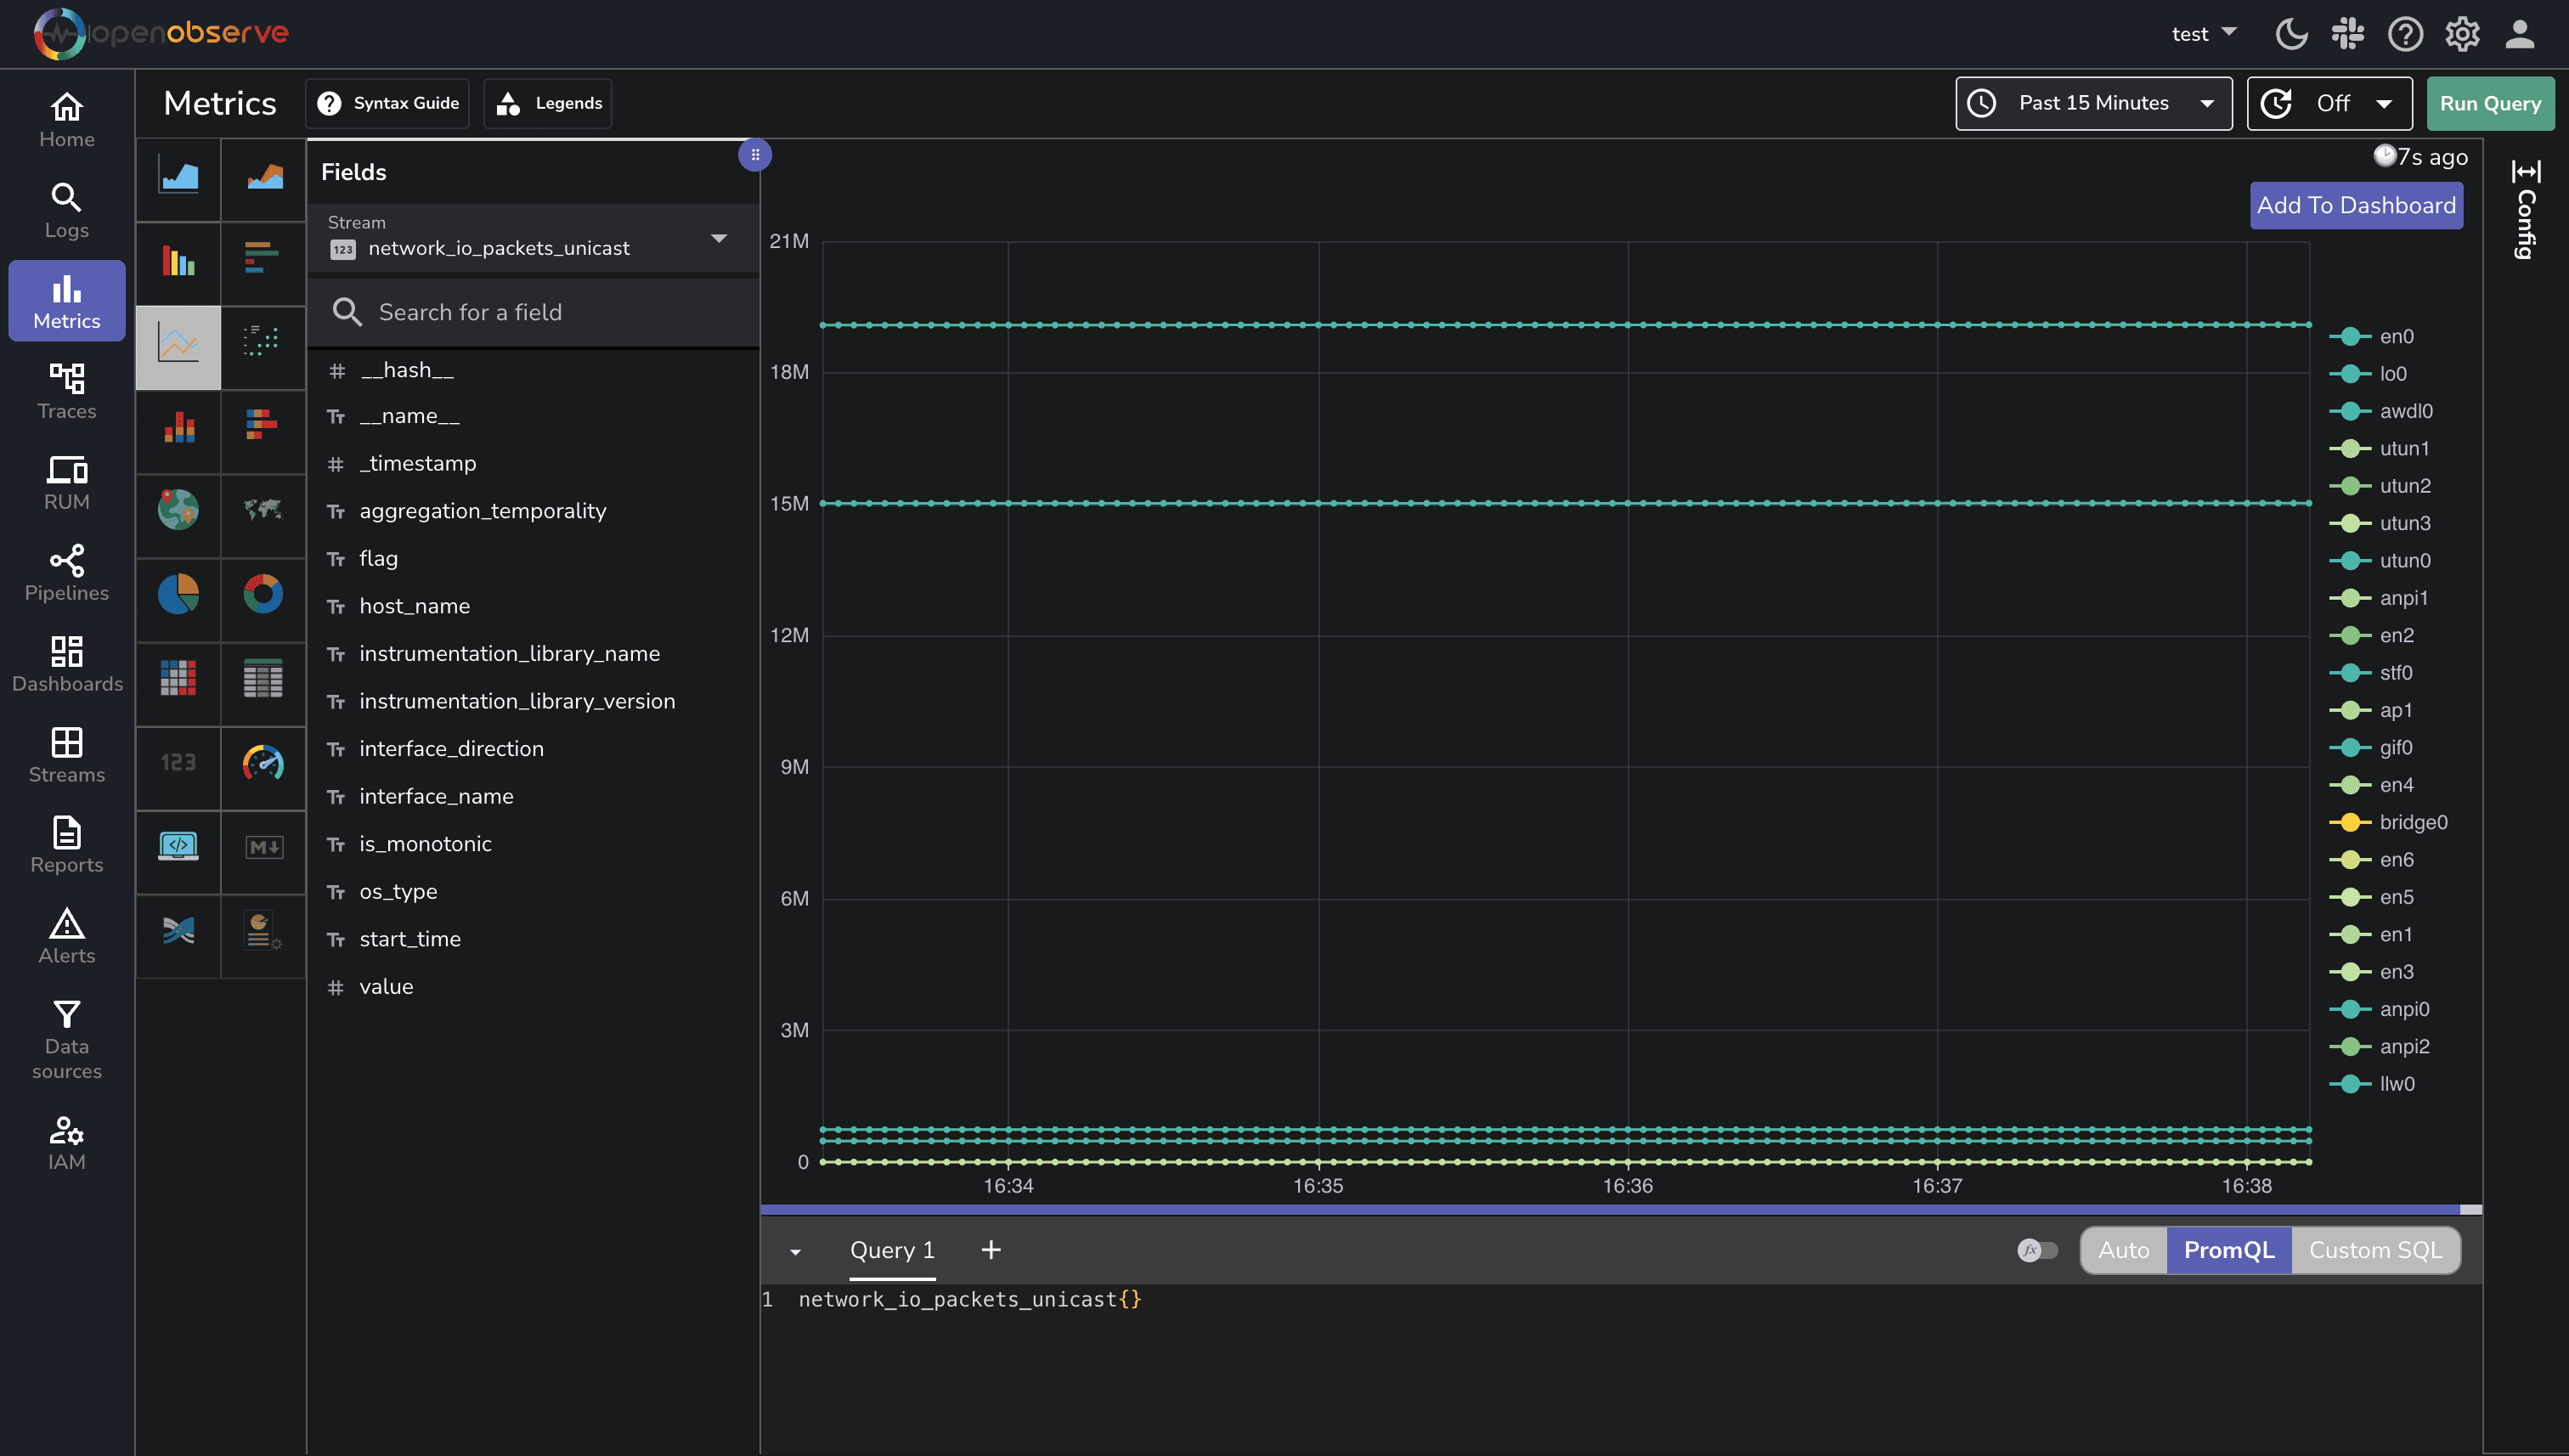
Once you've set up the OpenTelemetry Collector to collect SNMP metrics, the next step is to visualize and analyze this data in OpenObserve.
- Log in to your OpenObserve instance
- Navigate to Metrics in the side menu
- Look for Network and interface metrics
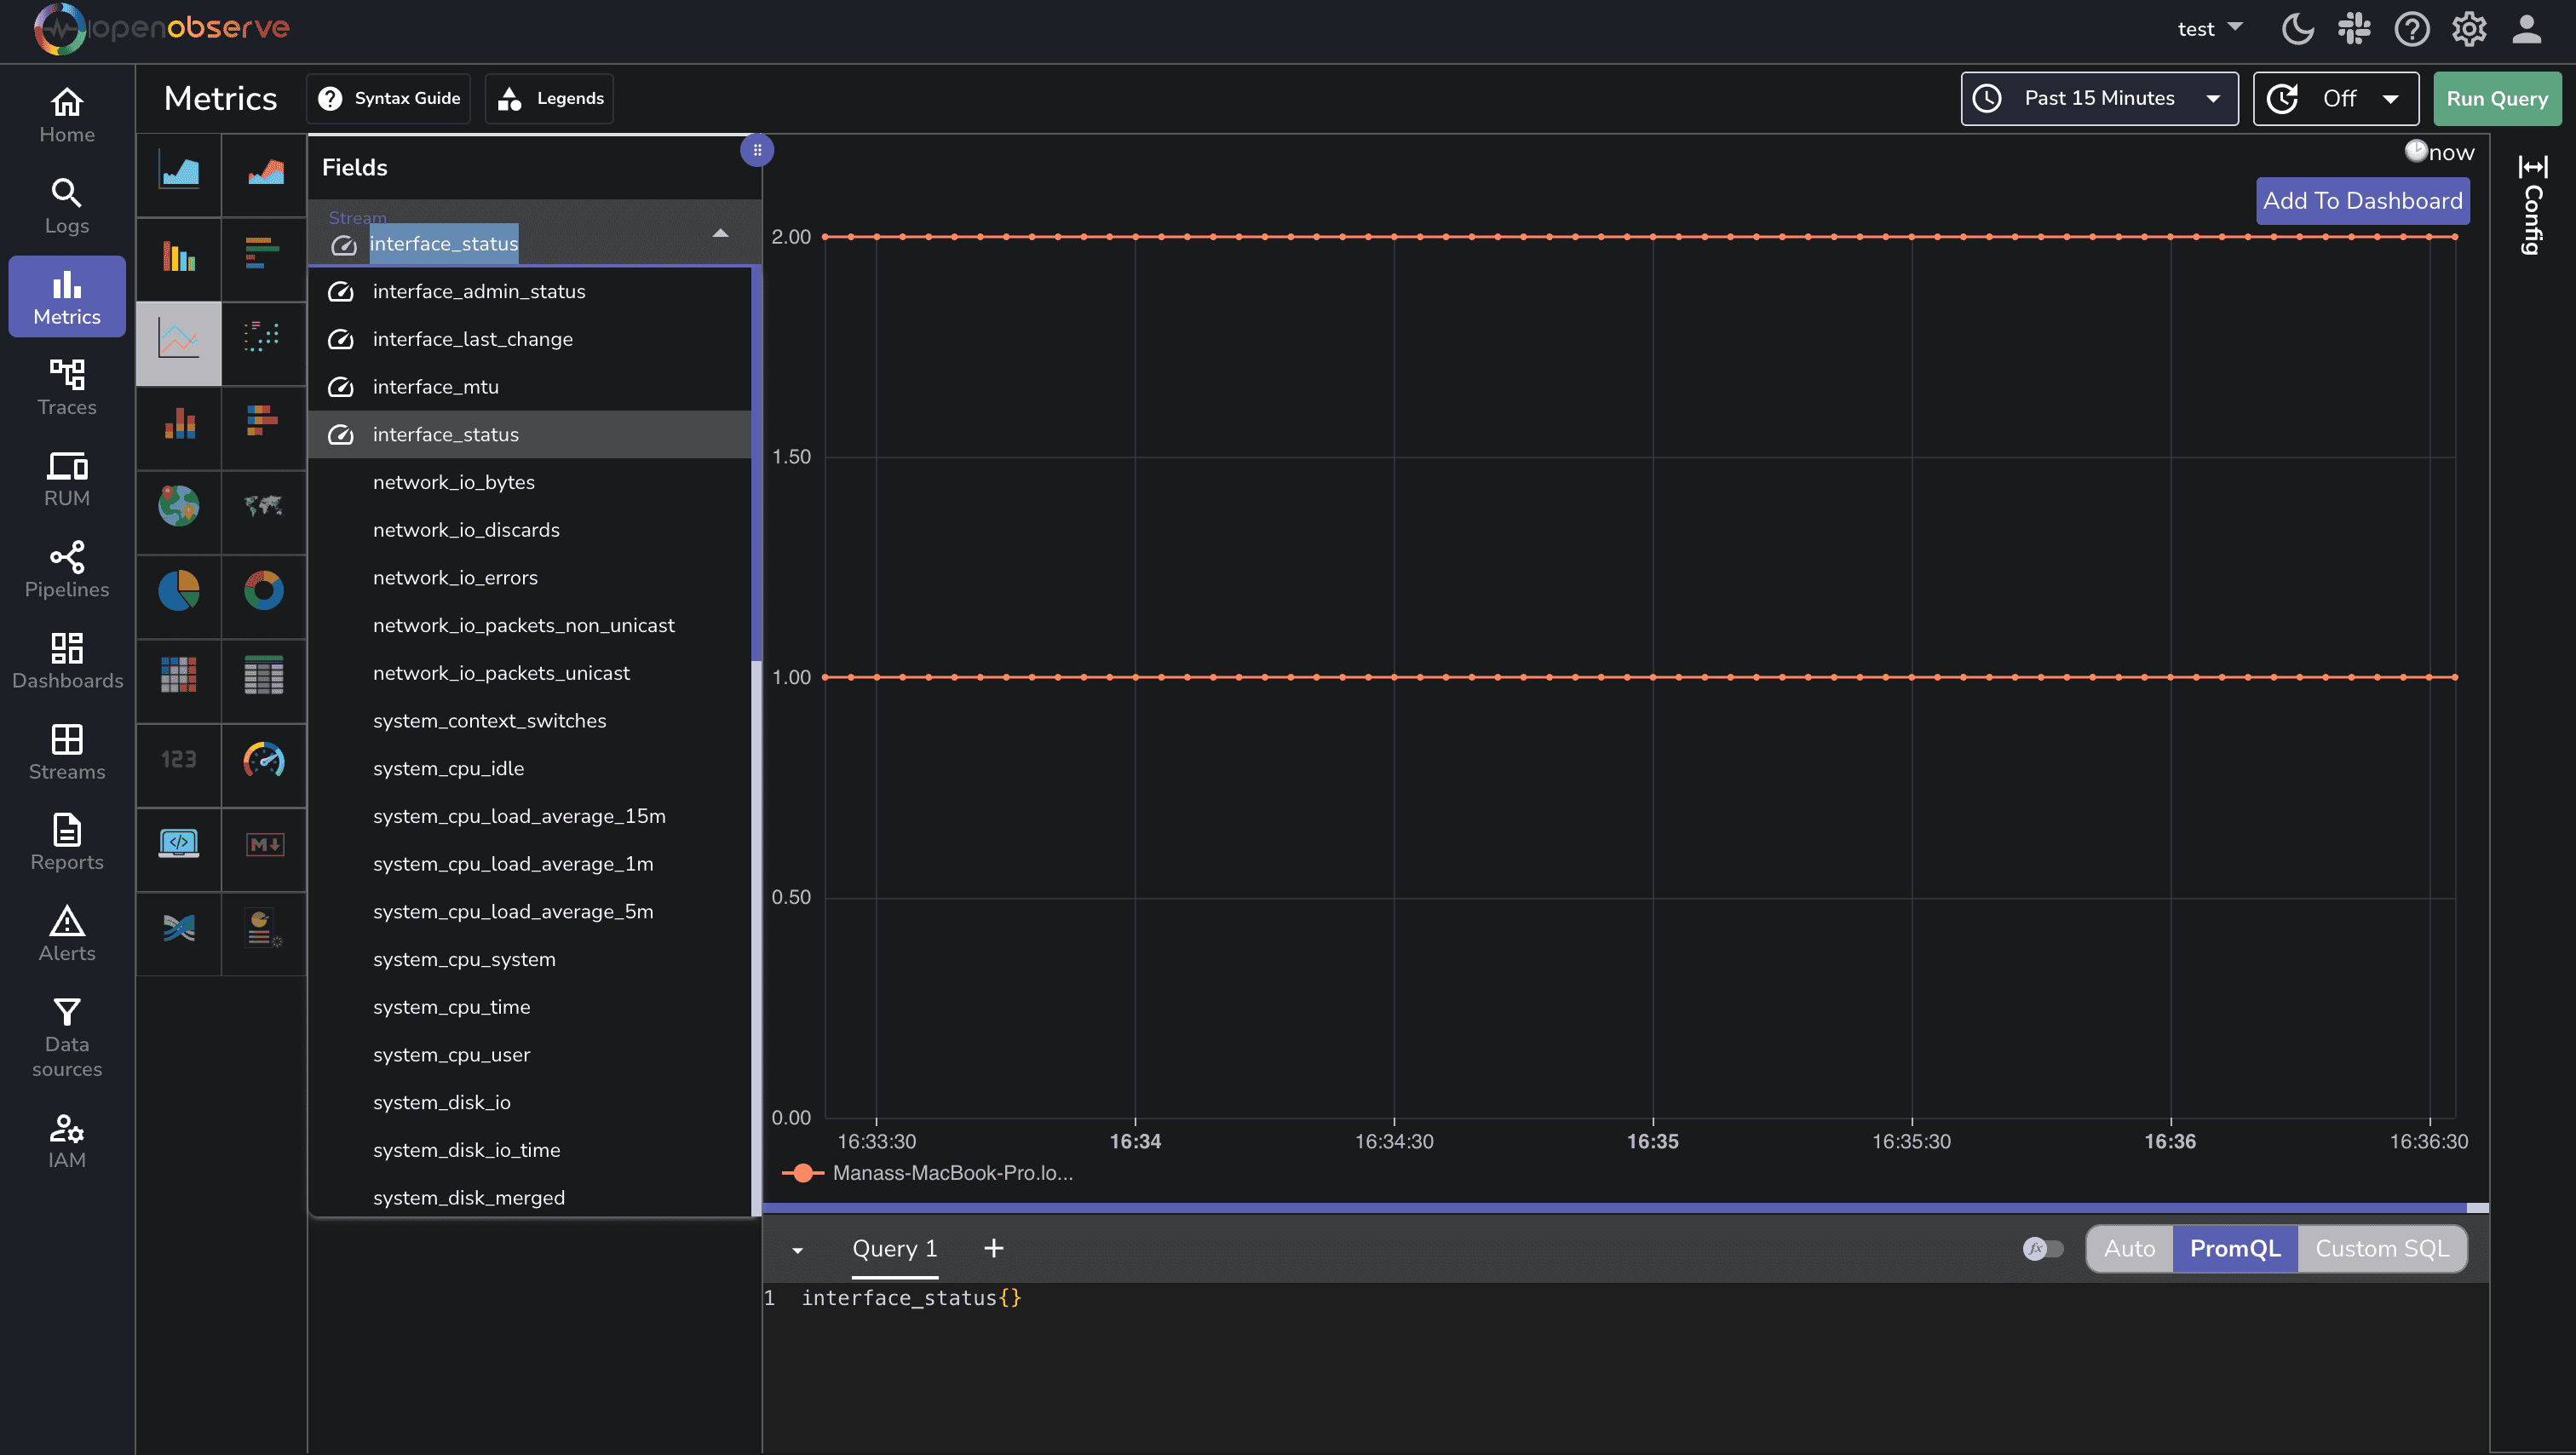
Your SNMP metrics will be organized by resource (device) and include attributes like interface name, making it easy to filter and group your data.
Troubleshooting SNMP Monitoring
Connection Timeouts
- Verify network connectivity with
ping - Check that the device allows SNMP traffic (UDP port 161)
- Verify the device's SNMP service is enabled
- Check firewall rules on both the collector and device
- Verify network connectivity with
Authentication Failures
- Double-check community strings (for v1/v2c)
- Verify username, authentication, and privacy settings (for v3)
- Ensure the device's SNMP access control lists permit your collector's IP address
Missing or Incorrect Data
- Verify OID support with
snmpwalkorsnmpget - Check that the collector has the correct MIB information
- Adjust collection intervals for frequently changing metrics
- Ensure OID syntax is correct (scalar OIDs must end with .0)
- Verify OID support with
Debugging SNMP Communications
- Increase the collector's log level to
debug - Use the
debugexporter to verify collected data - Use a packet analyzer like Wireshark to capture SNMP traffic
- Increase the collector's log level to
Conclusion
Implementing SNMP monitoring with OpenTelemetry and OpenObserve provides a powerful solution for network visibility. This approach combines the universal compatibility of SNMP with the flexibility and scalability of modern observability tools.
The configuration we've explored focuses on the most critical network interface metrics that network administrators need to monitor. With these metrics flowing into OpenObserve, you can create comprehensive dashboards to visualize your network's performance and set up alerts for potential issues.
For more information on OpenObserve and its capabilities, visit the OpenObserve Documentation.
Happy monitoring! 🚀
About the Author
Manas Sharma


Manas is a passionate Dev and Cloud Advocate with a strong focus on cloud-native technologies, including observability, cloud, kubernetes, and opensource. building bridges between tech and community.