Monitoring EKS Fargate Logs with Fluent Bit and OpenObserve




Ready to get started?
Try OpenObserve Cloud today for more efficient and performant observability.
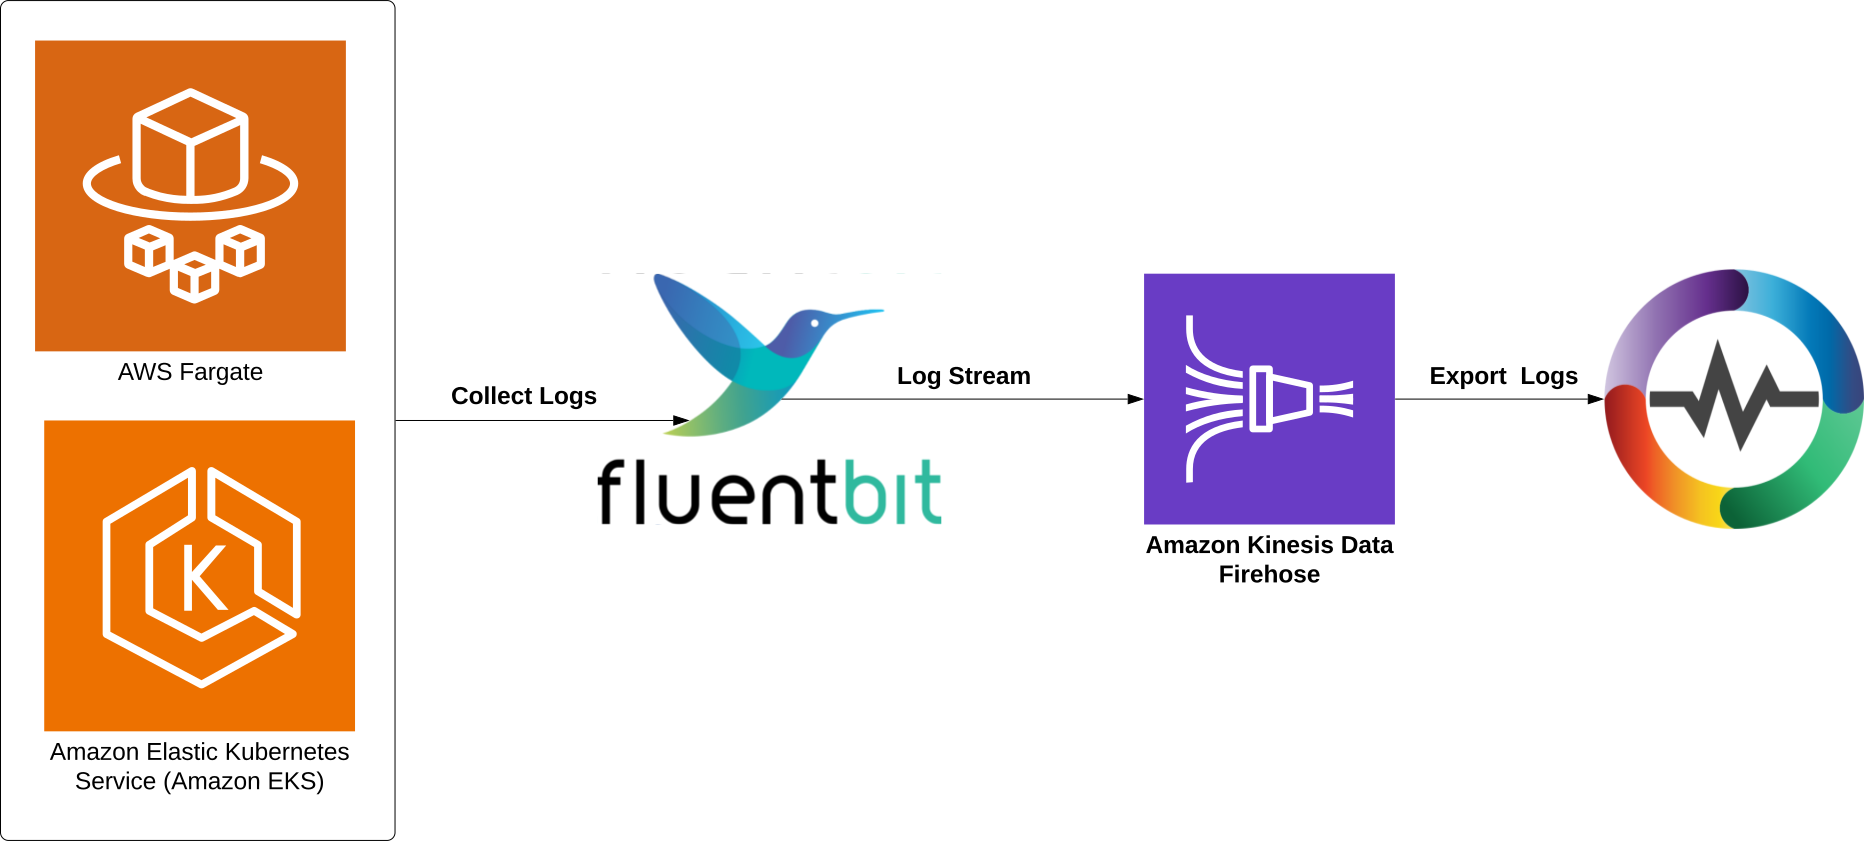
Amazon EKS Fargate combines the power of Kubernetes with the simplicity of serverless computing. Unlike traditional EKS clusters that run on EC2 instances, Fargate eliminates the need to provision, configure, or scale virtual machines for your pods. This serverless approach means you don't have to worry about patching, securing, or maintaining the underlying infrastructure.
However, with this convenience comes a challenge: how do you effectively capture and analyze logs from your Fargate pods? This is where AWS's built-in Fluent Bit log router for Fargate comes into play. Fluent Bit runs as a sidecar within your Fargate environment, automatically collecting container logs without requiring any additional configuration in your applications.
In this comprehensive guide, we'll walk through setting up a logging pipeline for Amazon EKS Fargate workloads using the built-in Fluent Bit log router, Kinesis Firehose, and OpenObserve. You'll learn how to overcome Fargate's logging limitations and create a robust observability solution for your serverless Kubernetes workloads.
Understanding the Architecture
Amazon EKS on Fargate includes a built-in Fluent Bit log router that automatically collects container logs. However, Fargate's implementation only supports specific output plugins, which doesn't include direct HTTP output to third-party observability platforms like OpenObserve.
Our solution uses this architecture:
- Fargate's built-in Fluent Bit collects container logs
- Logs are sent to Amazon Kinesis Firehose
- Kinesis Firehose delivers logs to OpenObserve
- OpenObserve provides visualization and analysis capabilities
Prerequisites
Before we begin, ensure you have the following:
- An Amazon EKS cluster
- AWS CLI installed and configured with appropriate permissions
- kubectl configured to connect to your EKS cluster
Step 1: Create a Fargate Profile for Your EKS Cluster
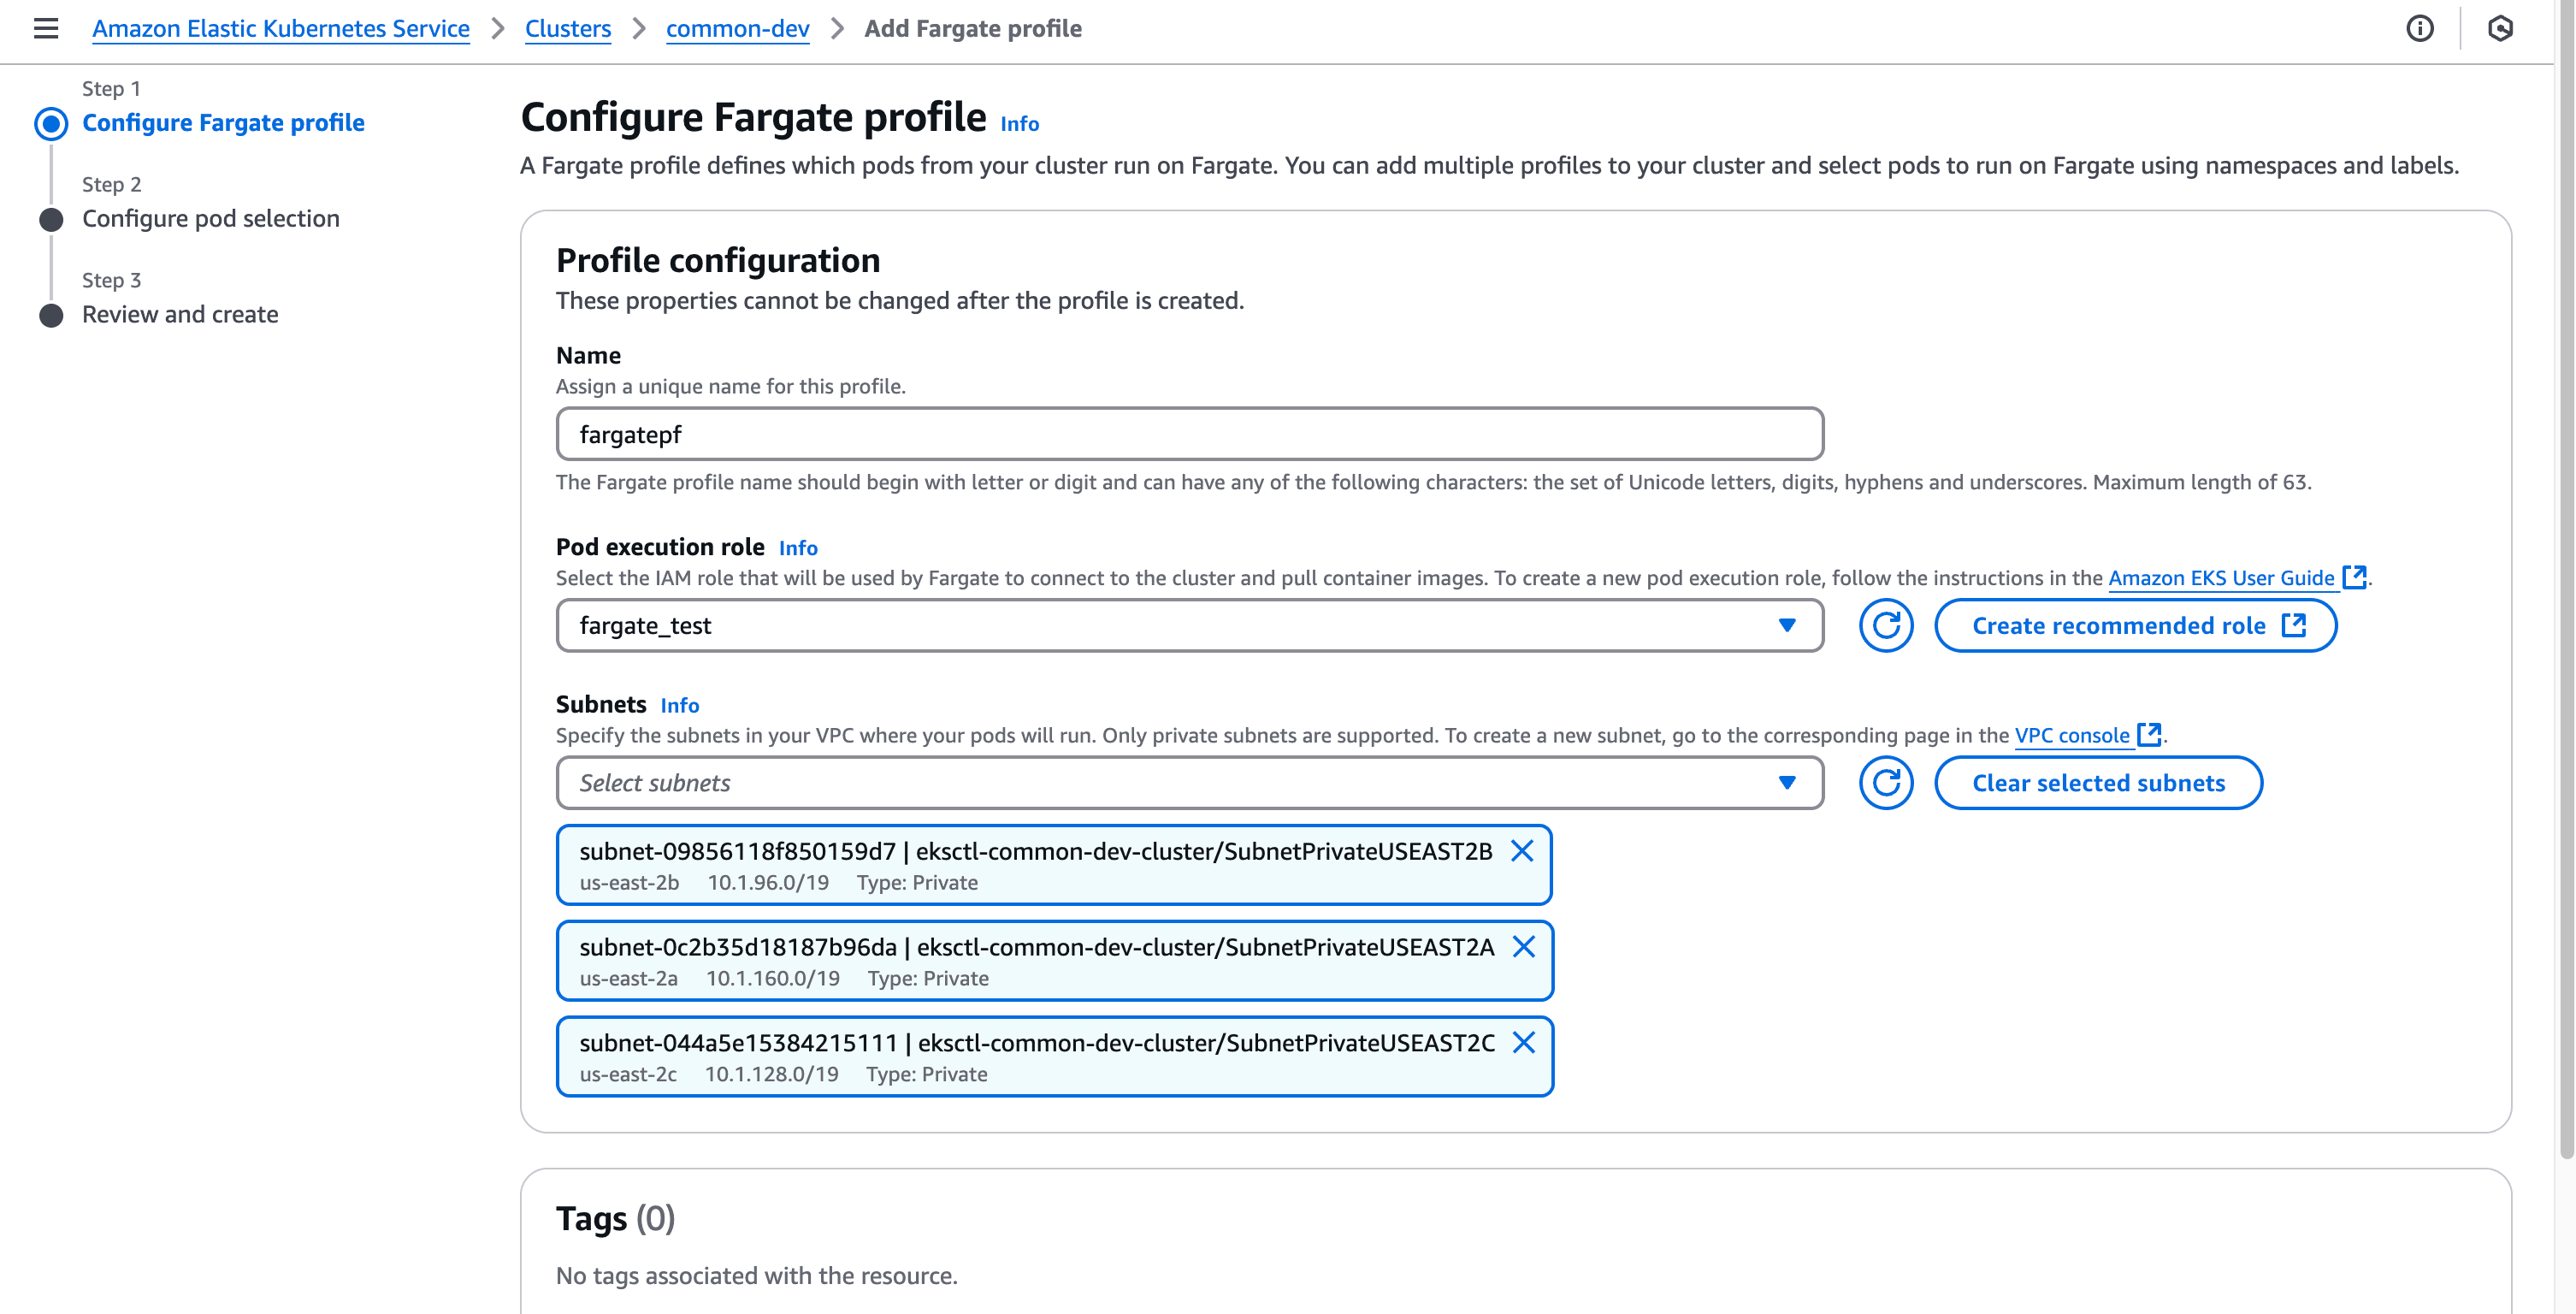
A Fargate profile defines which pods should run on Fargate. Let's create one through the AWS Management Console:
- Navigate to the EKS console
- Select your cluster
- Go to the "Compute" tab
- Click "Add Fargate Profile"
- Enter the profile details:
- Name: fargatepf
- Pod execution role: fargate_test (or create a new one)
- Subnets: Select your private subnets
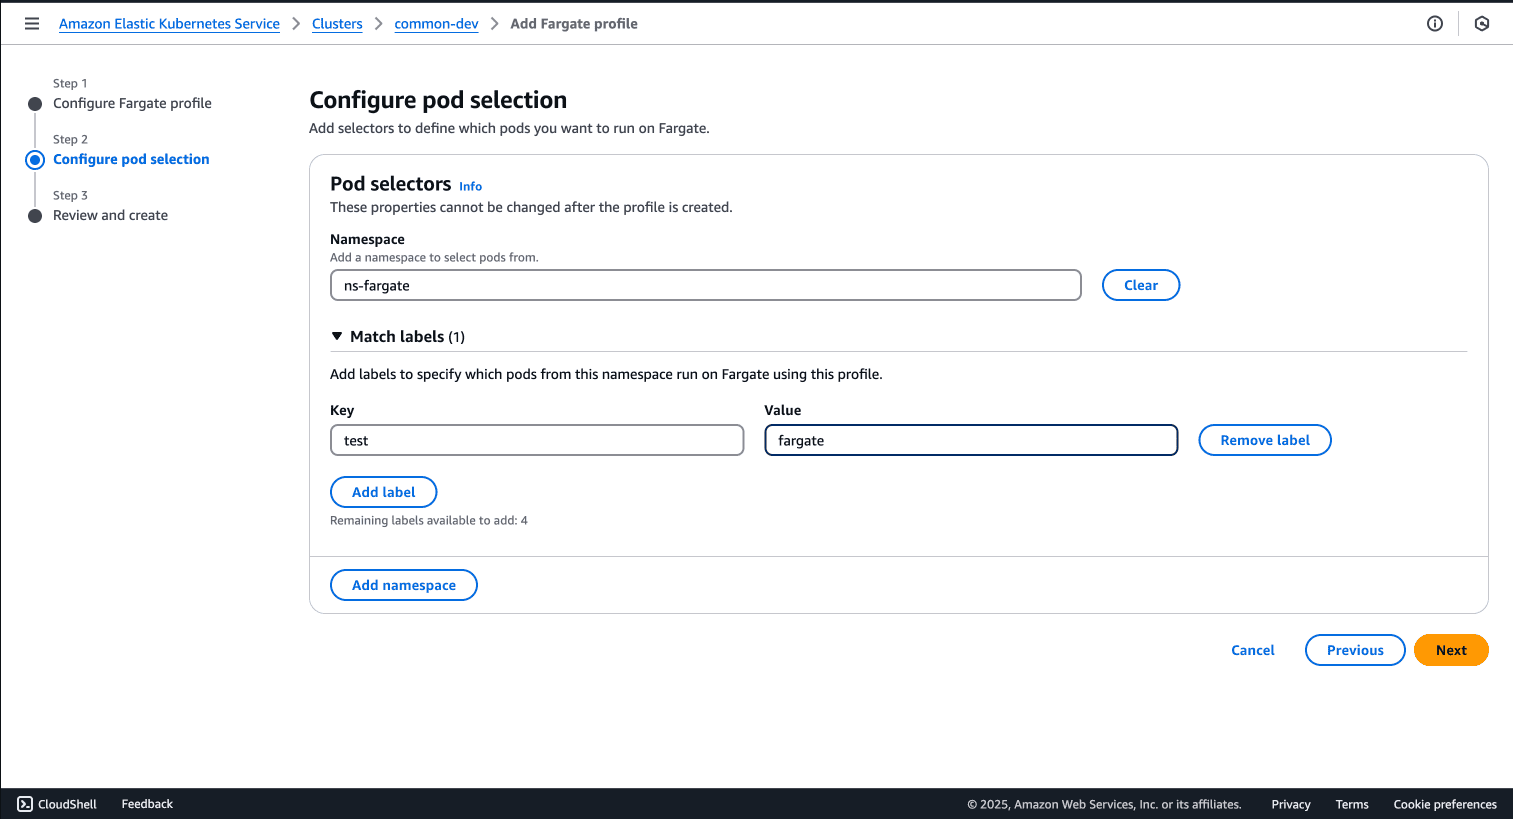
- Namespace: ns-fargate
- Labels: test=fargate
- Click "Create"
Step 2: Create the aws-observability Namespace
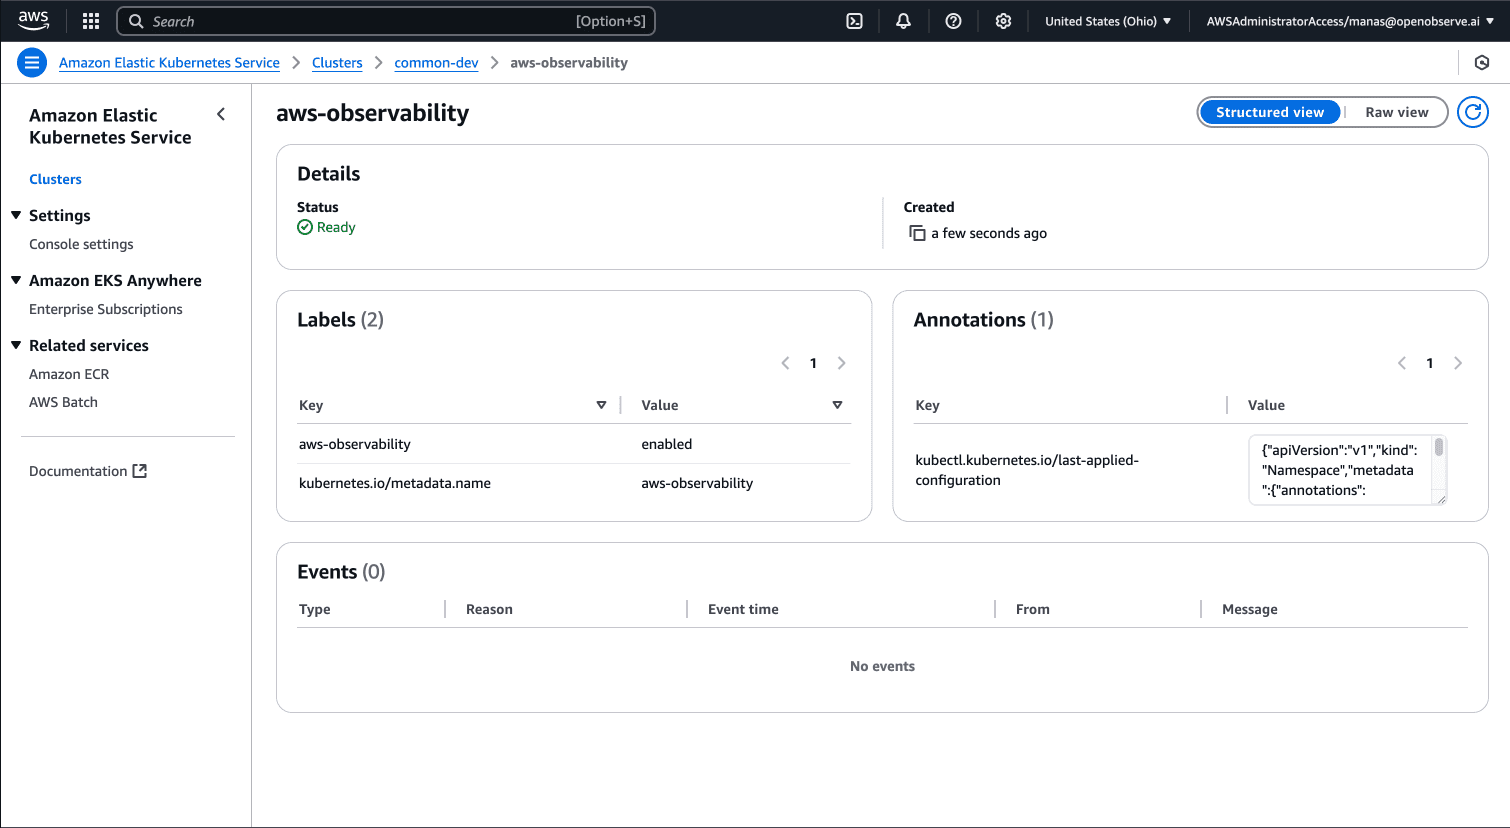
EKS Fargate requires a dedicated namespace for logging configuration:
cat > aws-observability-namespace.yaml << 'EOF'
kind: Namespace
apiVersion: v1
metadata:
  name: aws-observability
  labels:
    aws-observability: enabled
EOF

kubectl apply -f aws-observability-namespace.yaml
This namespace is specifically required by EKS Fargate for logging configuration.
Step 3: Create a Kinesis Firehose Delivery Stream
Next, we'll create a Kinesis Firehose delivery stream to forward logs to OpenObserve:
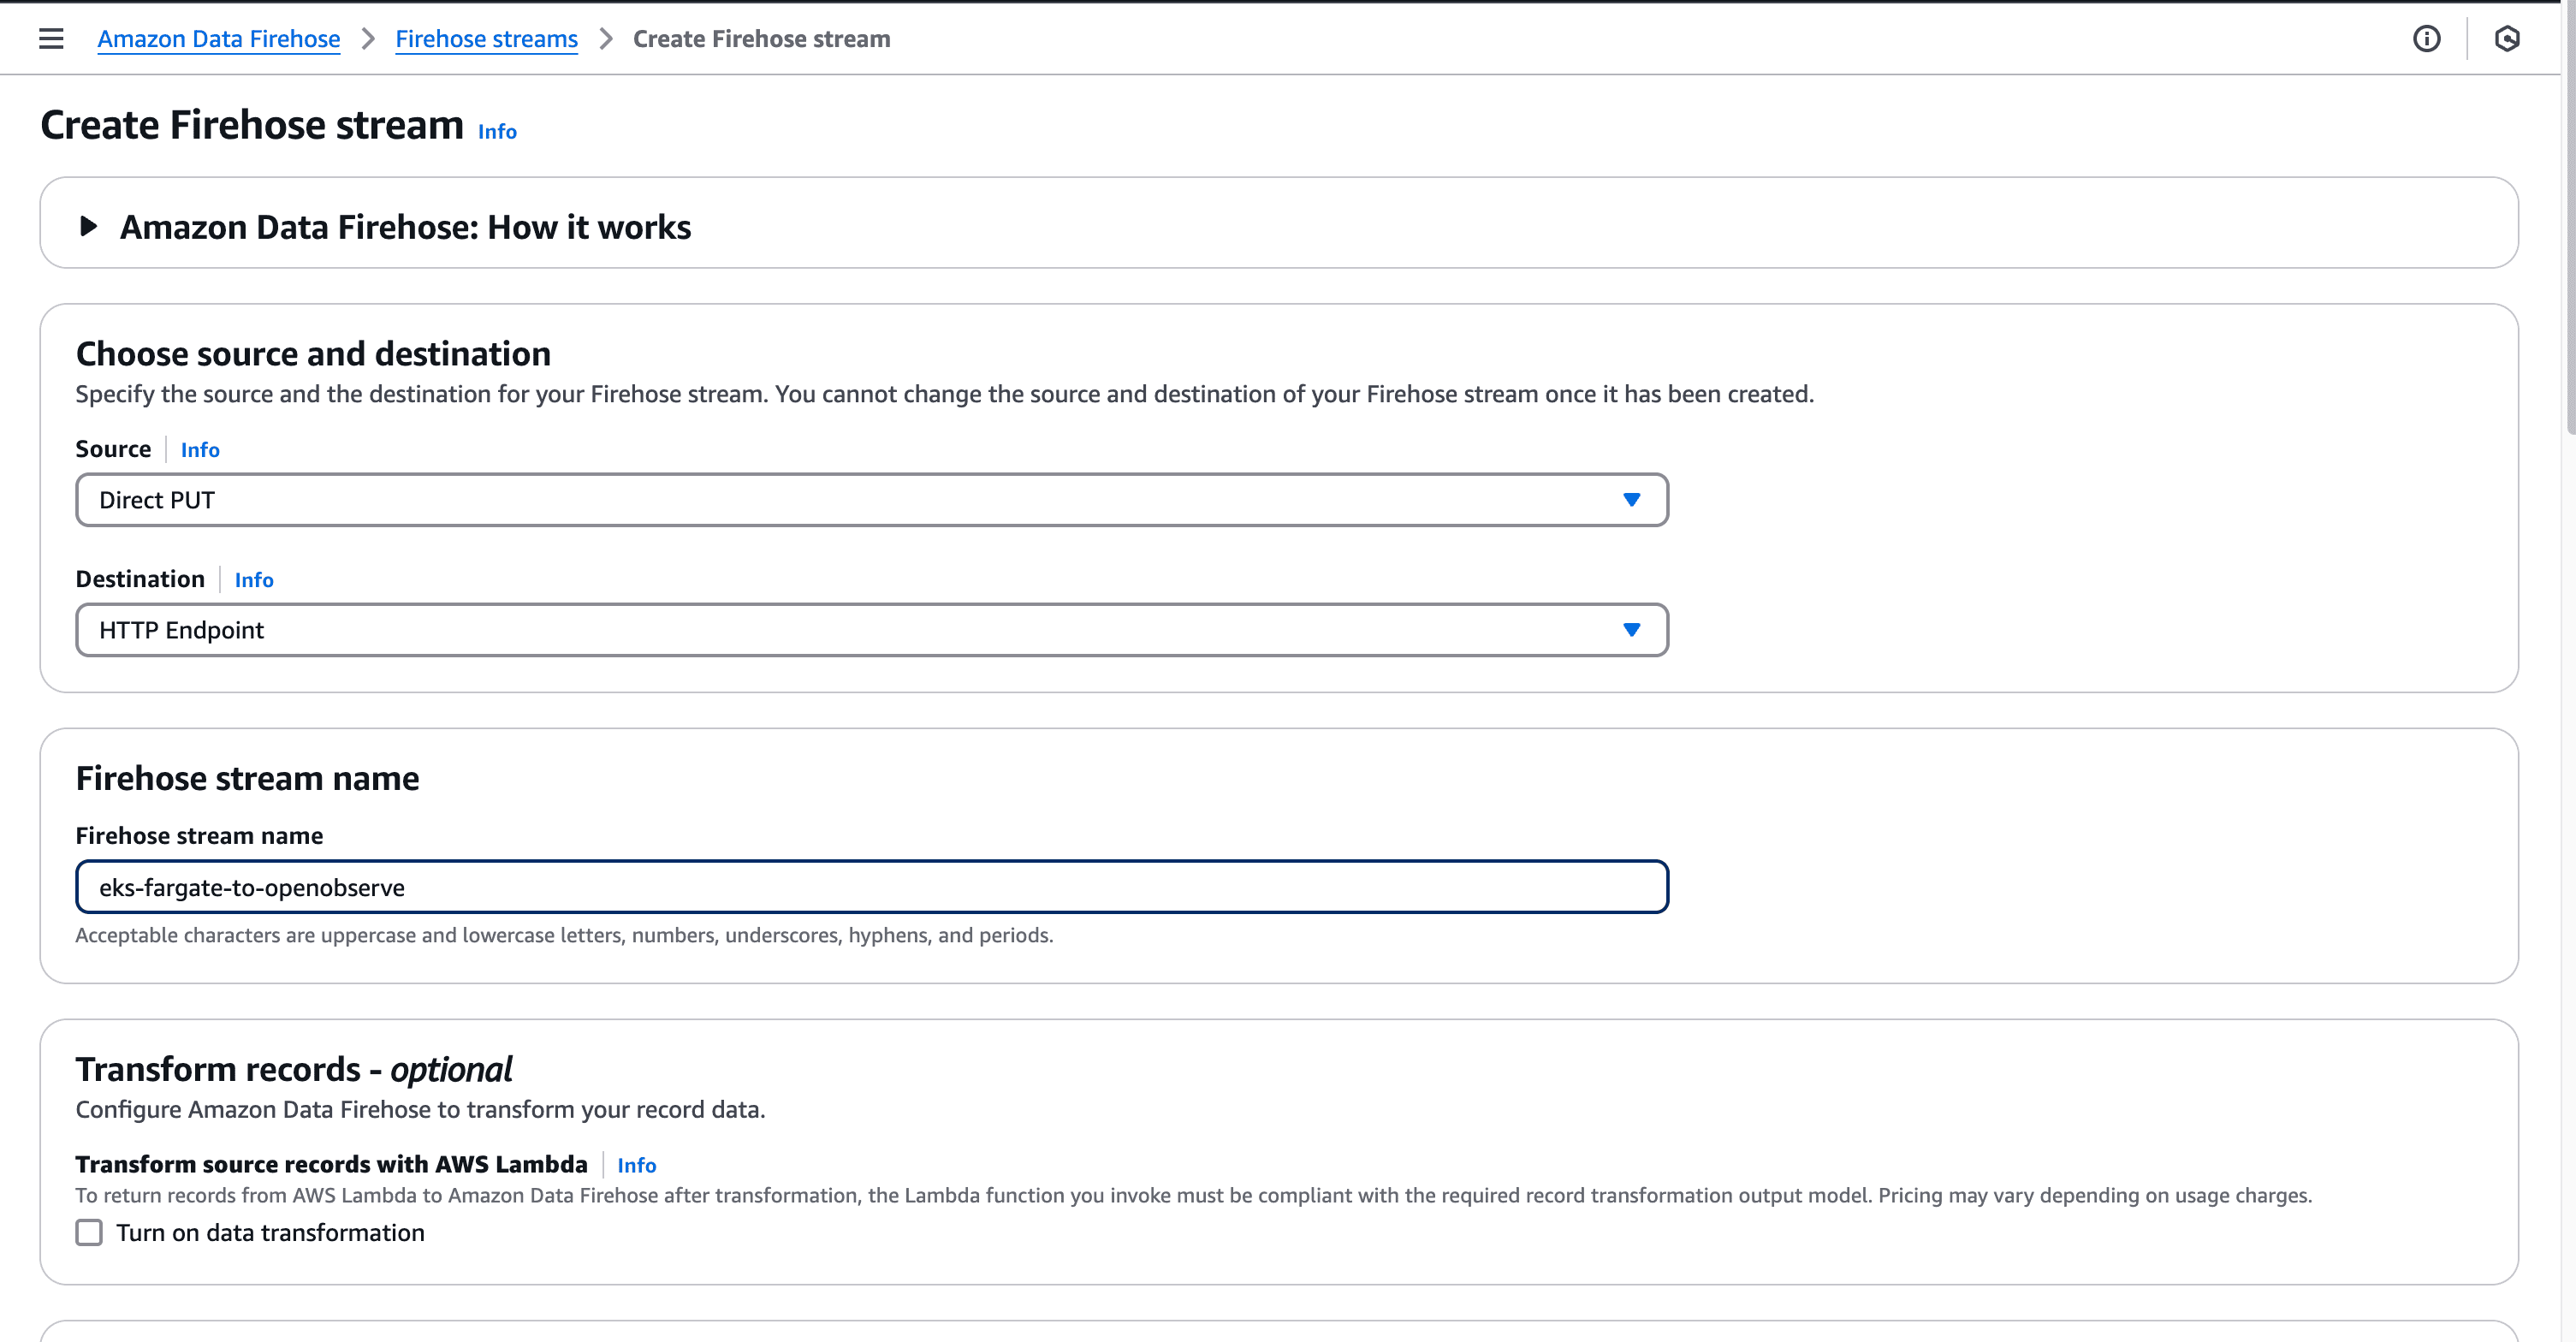
Go to the Amazon Kinesis Console and select "Create delivery stream"
Select "Direct PUT" as the source
Choose "HTTP endpoint" as the destination
Provide a name for your delivery stream (e.g.,
eks-fargate-to-openobserve)Configure the HTTP endpoint:
- HTTP endpoint URL:
https://your-openobserve-instance/aws/your-org/your-stream/_kinesis_firehose - Authentication: Select "Use access key for authentication"
- Access key: Your OpenObserve access key
- HTTP endpoint URL:
Configure S3 backup:
- For backup mode, select "Failed data only" (or "All data" if you want to keep a copy of all logs)
- Create or select an S3 bucket for backup
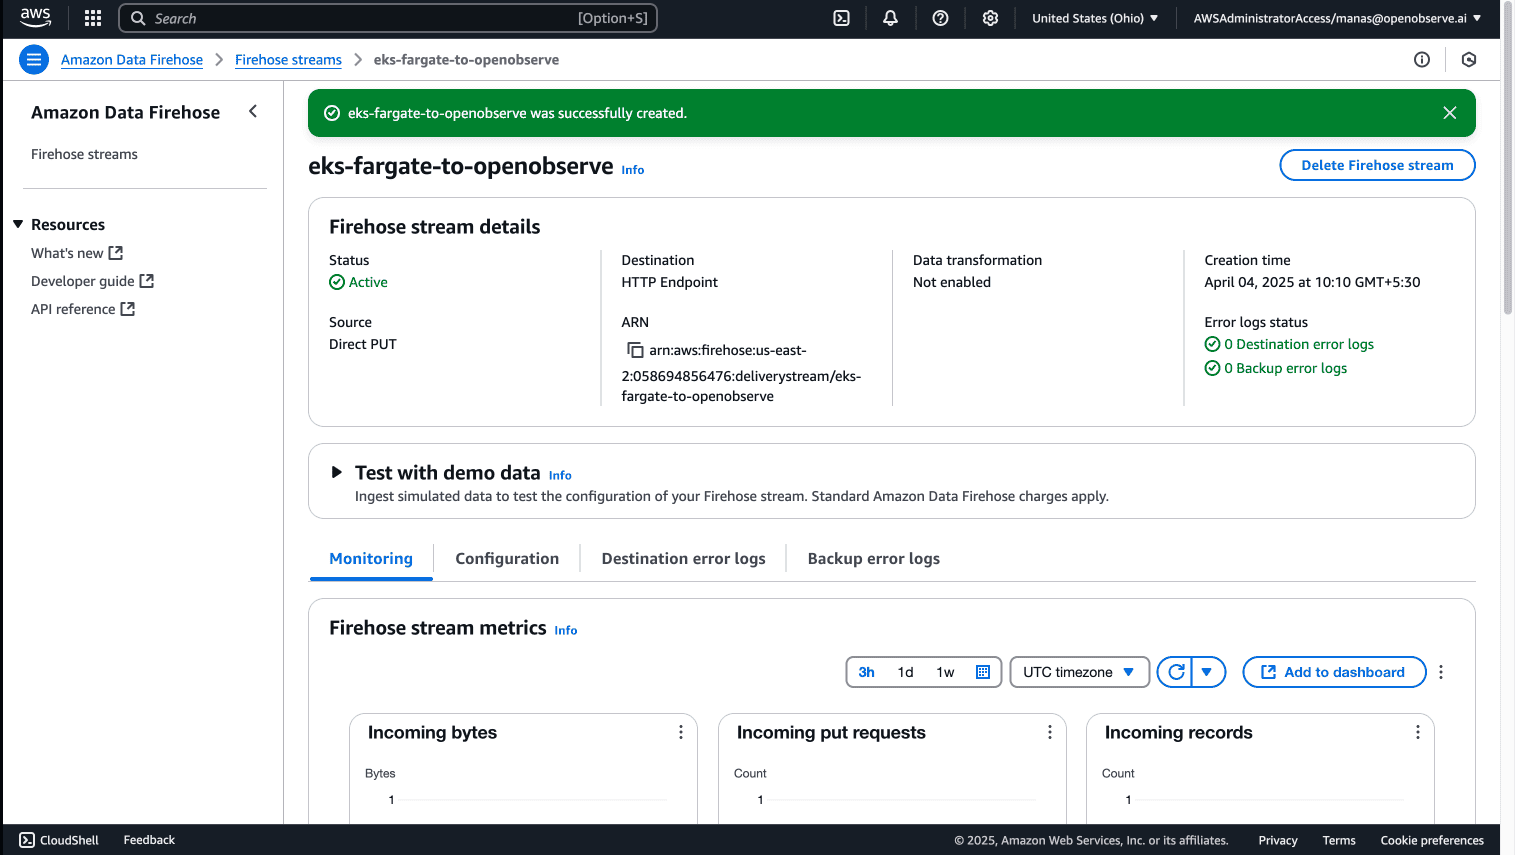
Review and create the delivery stream
Step 4: Set Up IAM Permissions
The Fargate pod execution role needs permissions to send logs to Kinesis Firehose. Let's create and attach the necessary policy through the AWS Management Console:
- Navigate to the IAM console
- Select "Policies" from the left navigation
- Click "Create policy"
- Select the "JSON" tab
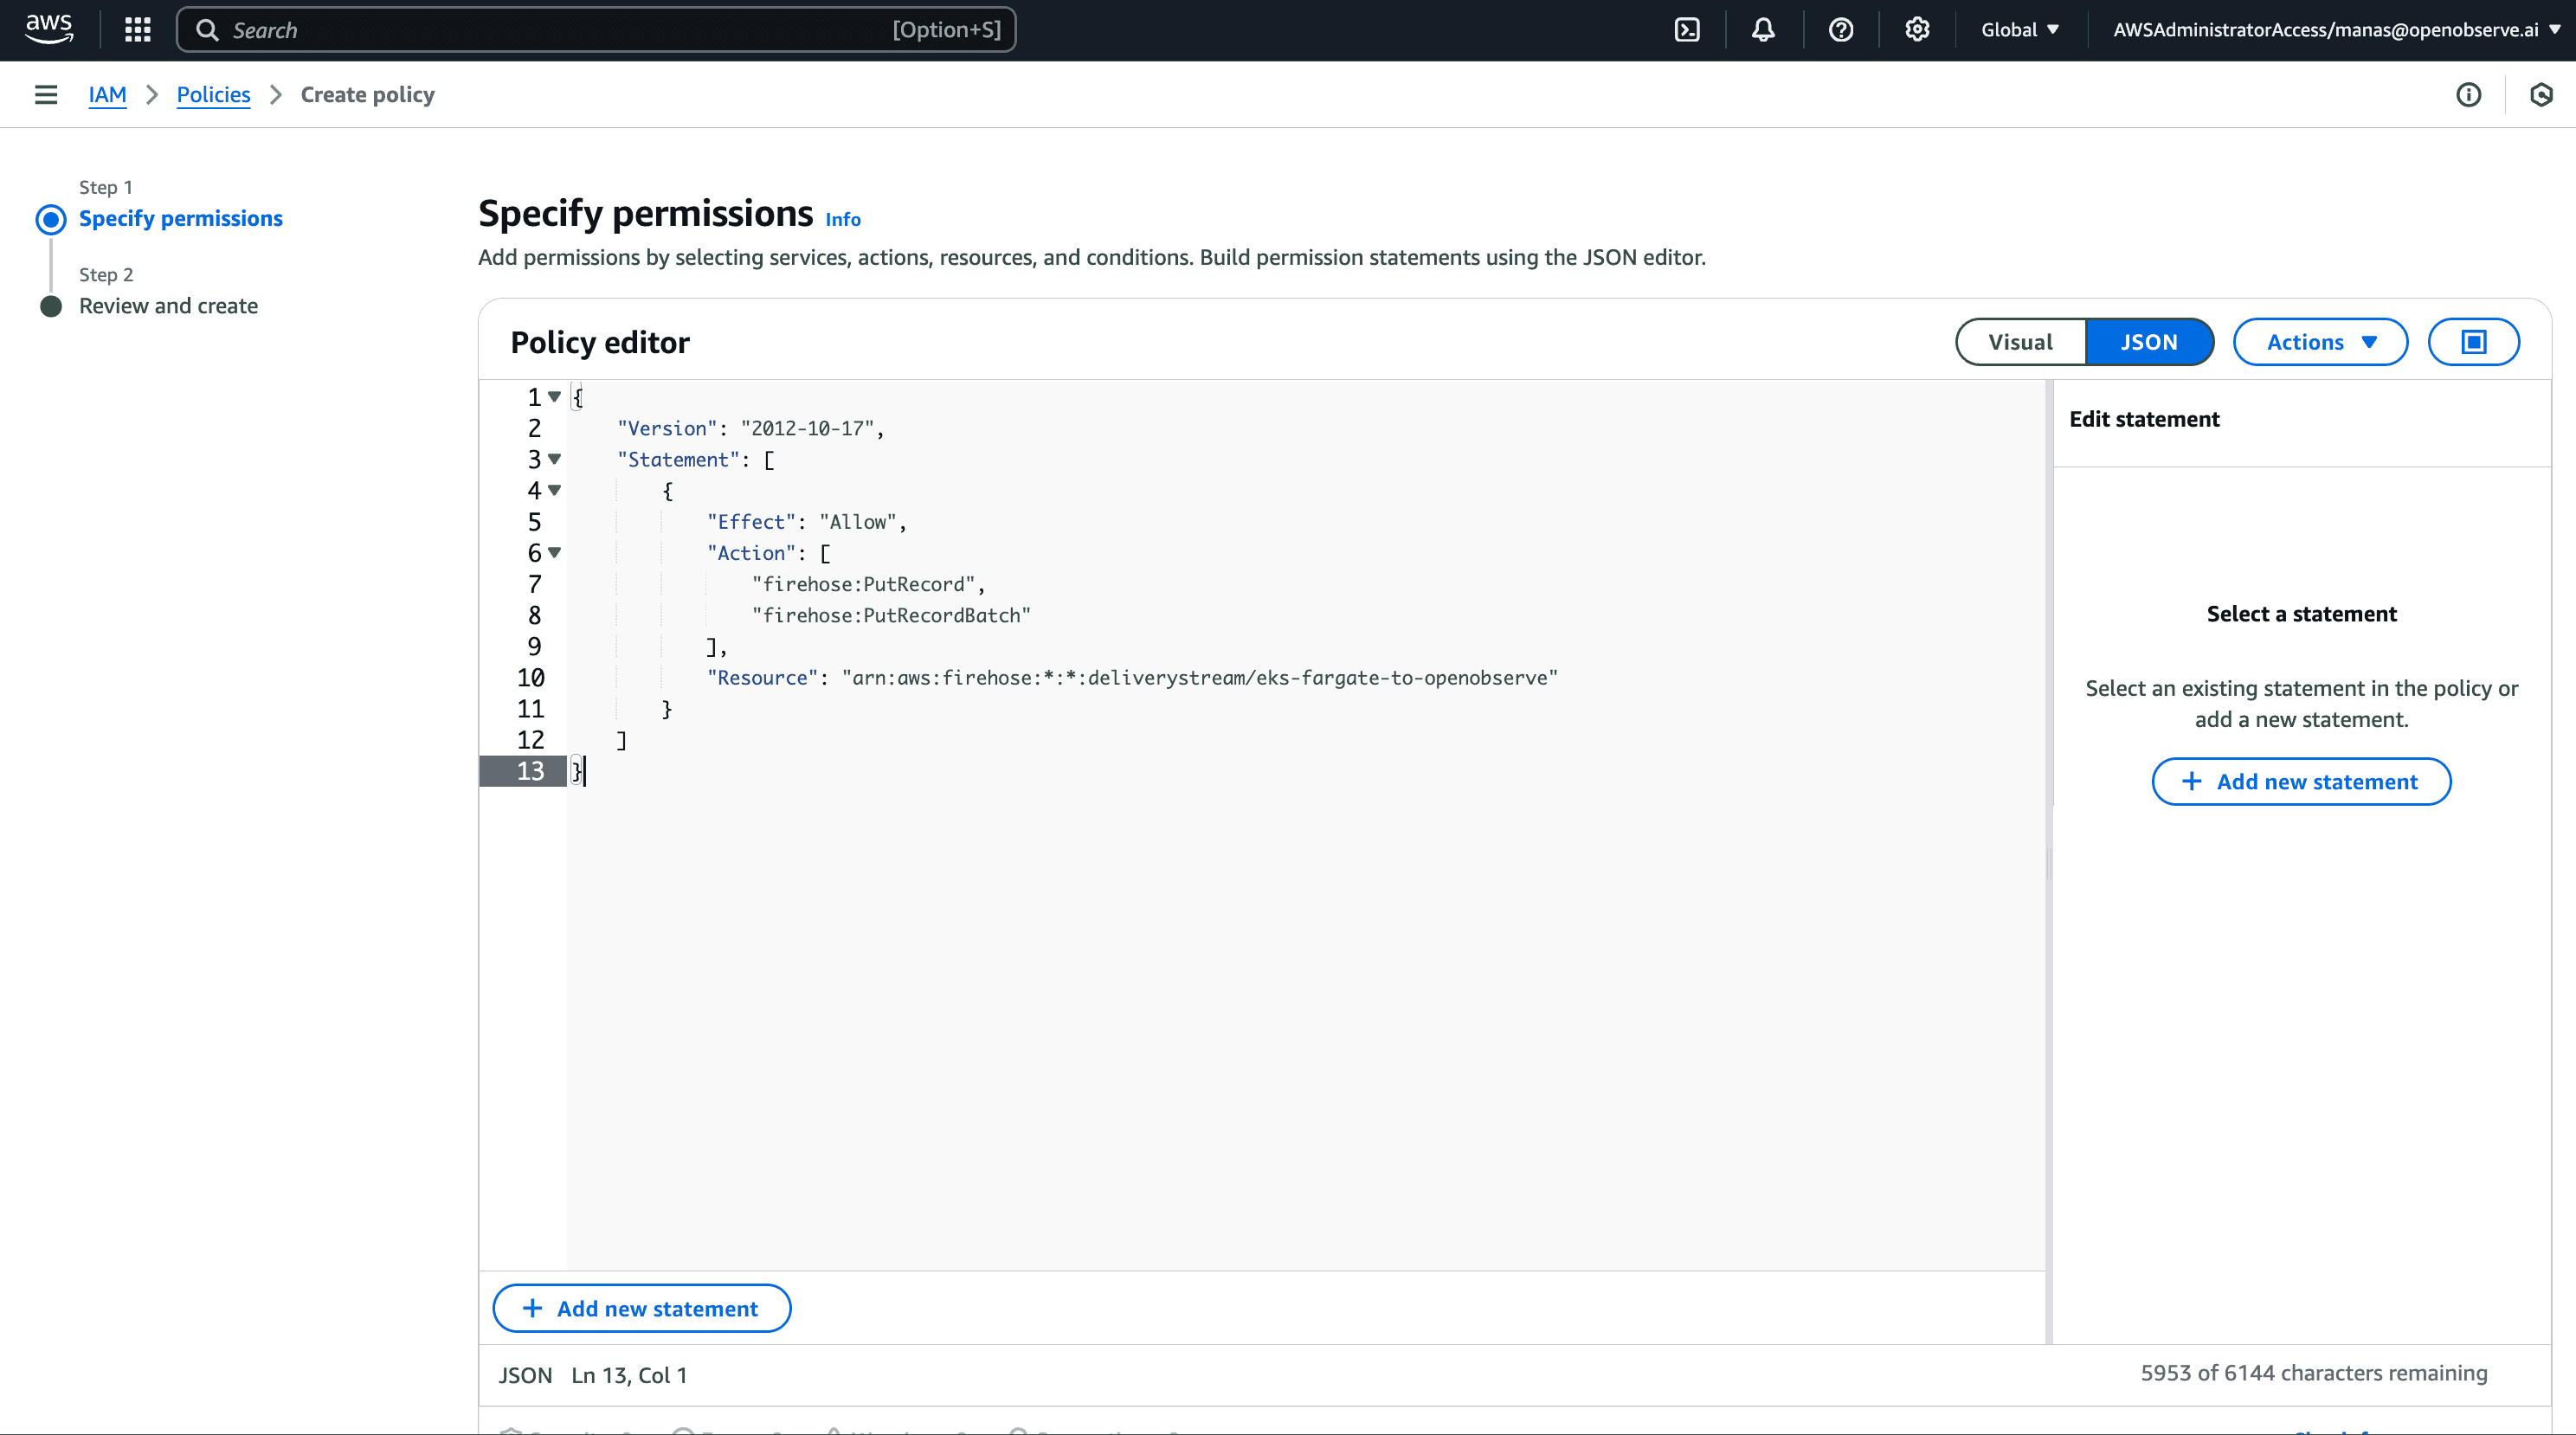
- Paste the following policy:
{
  "Version": "2012-10-17",
  "Statement": [
    {
      "Effect": "Allow",
      "Action": [
        "firehose:PutRecord",
        "firehose:PutRecordBatch"
      ],
      "Resource": "arn:aws:firehose:*:*:deliverystream/eks-fargate-to-openobserve"
    }
  ]
}
- Click "Next: Tags" (add tags if needed)
- Click "Next: Review"
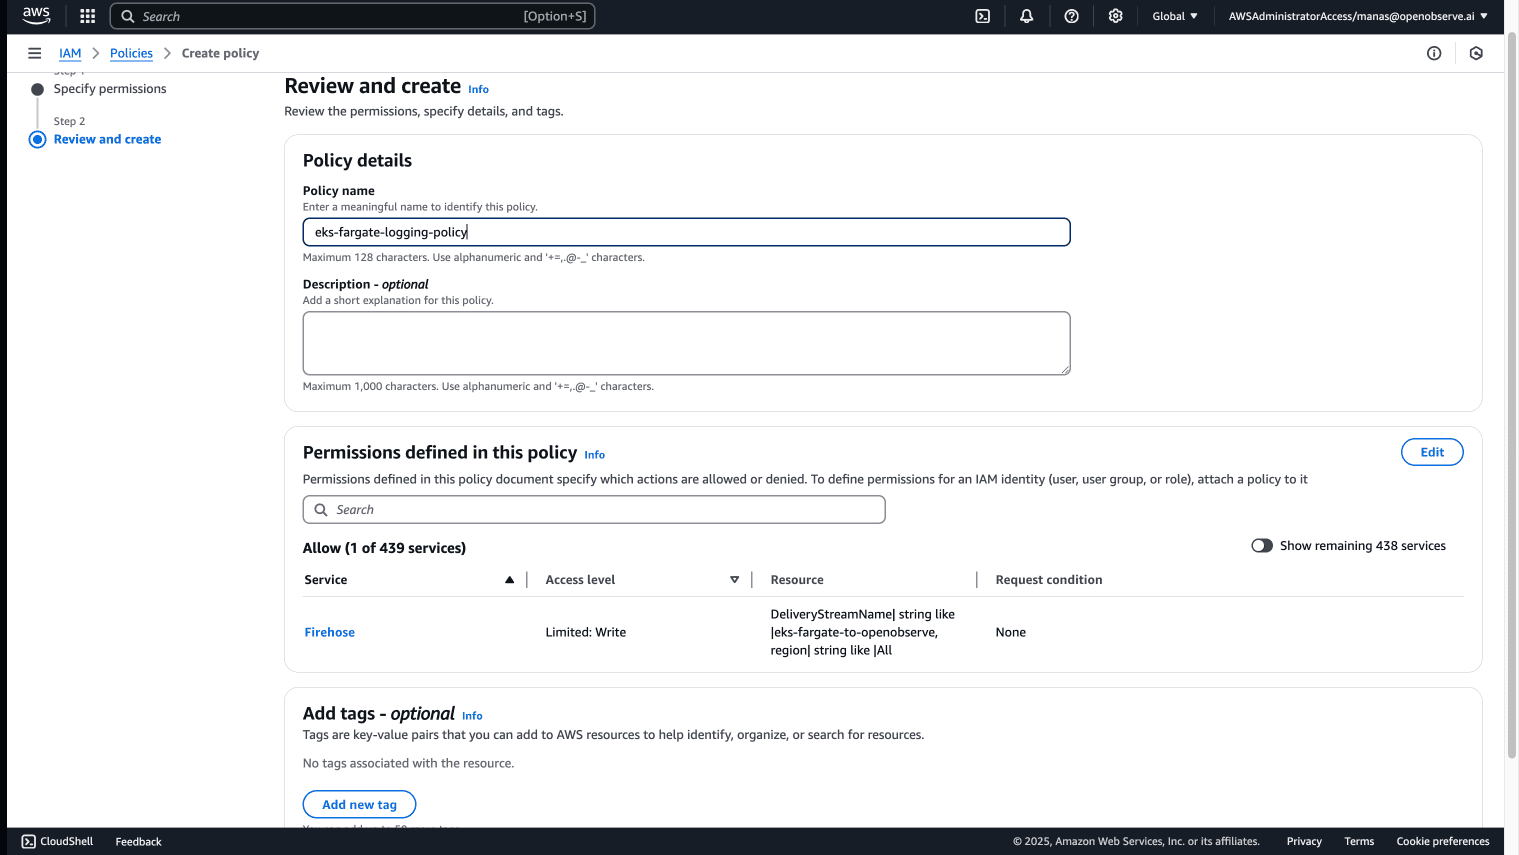
- Name the policy "eks-fargate-firehose-policy"
- Click "Create policy"
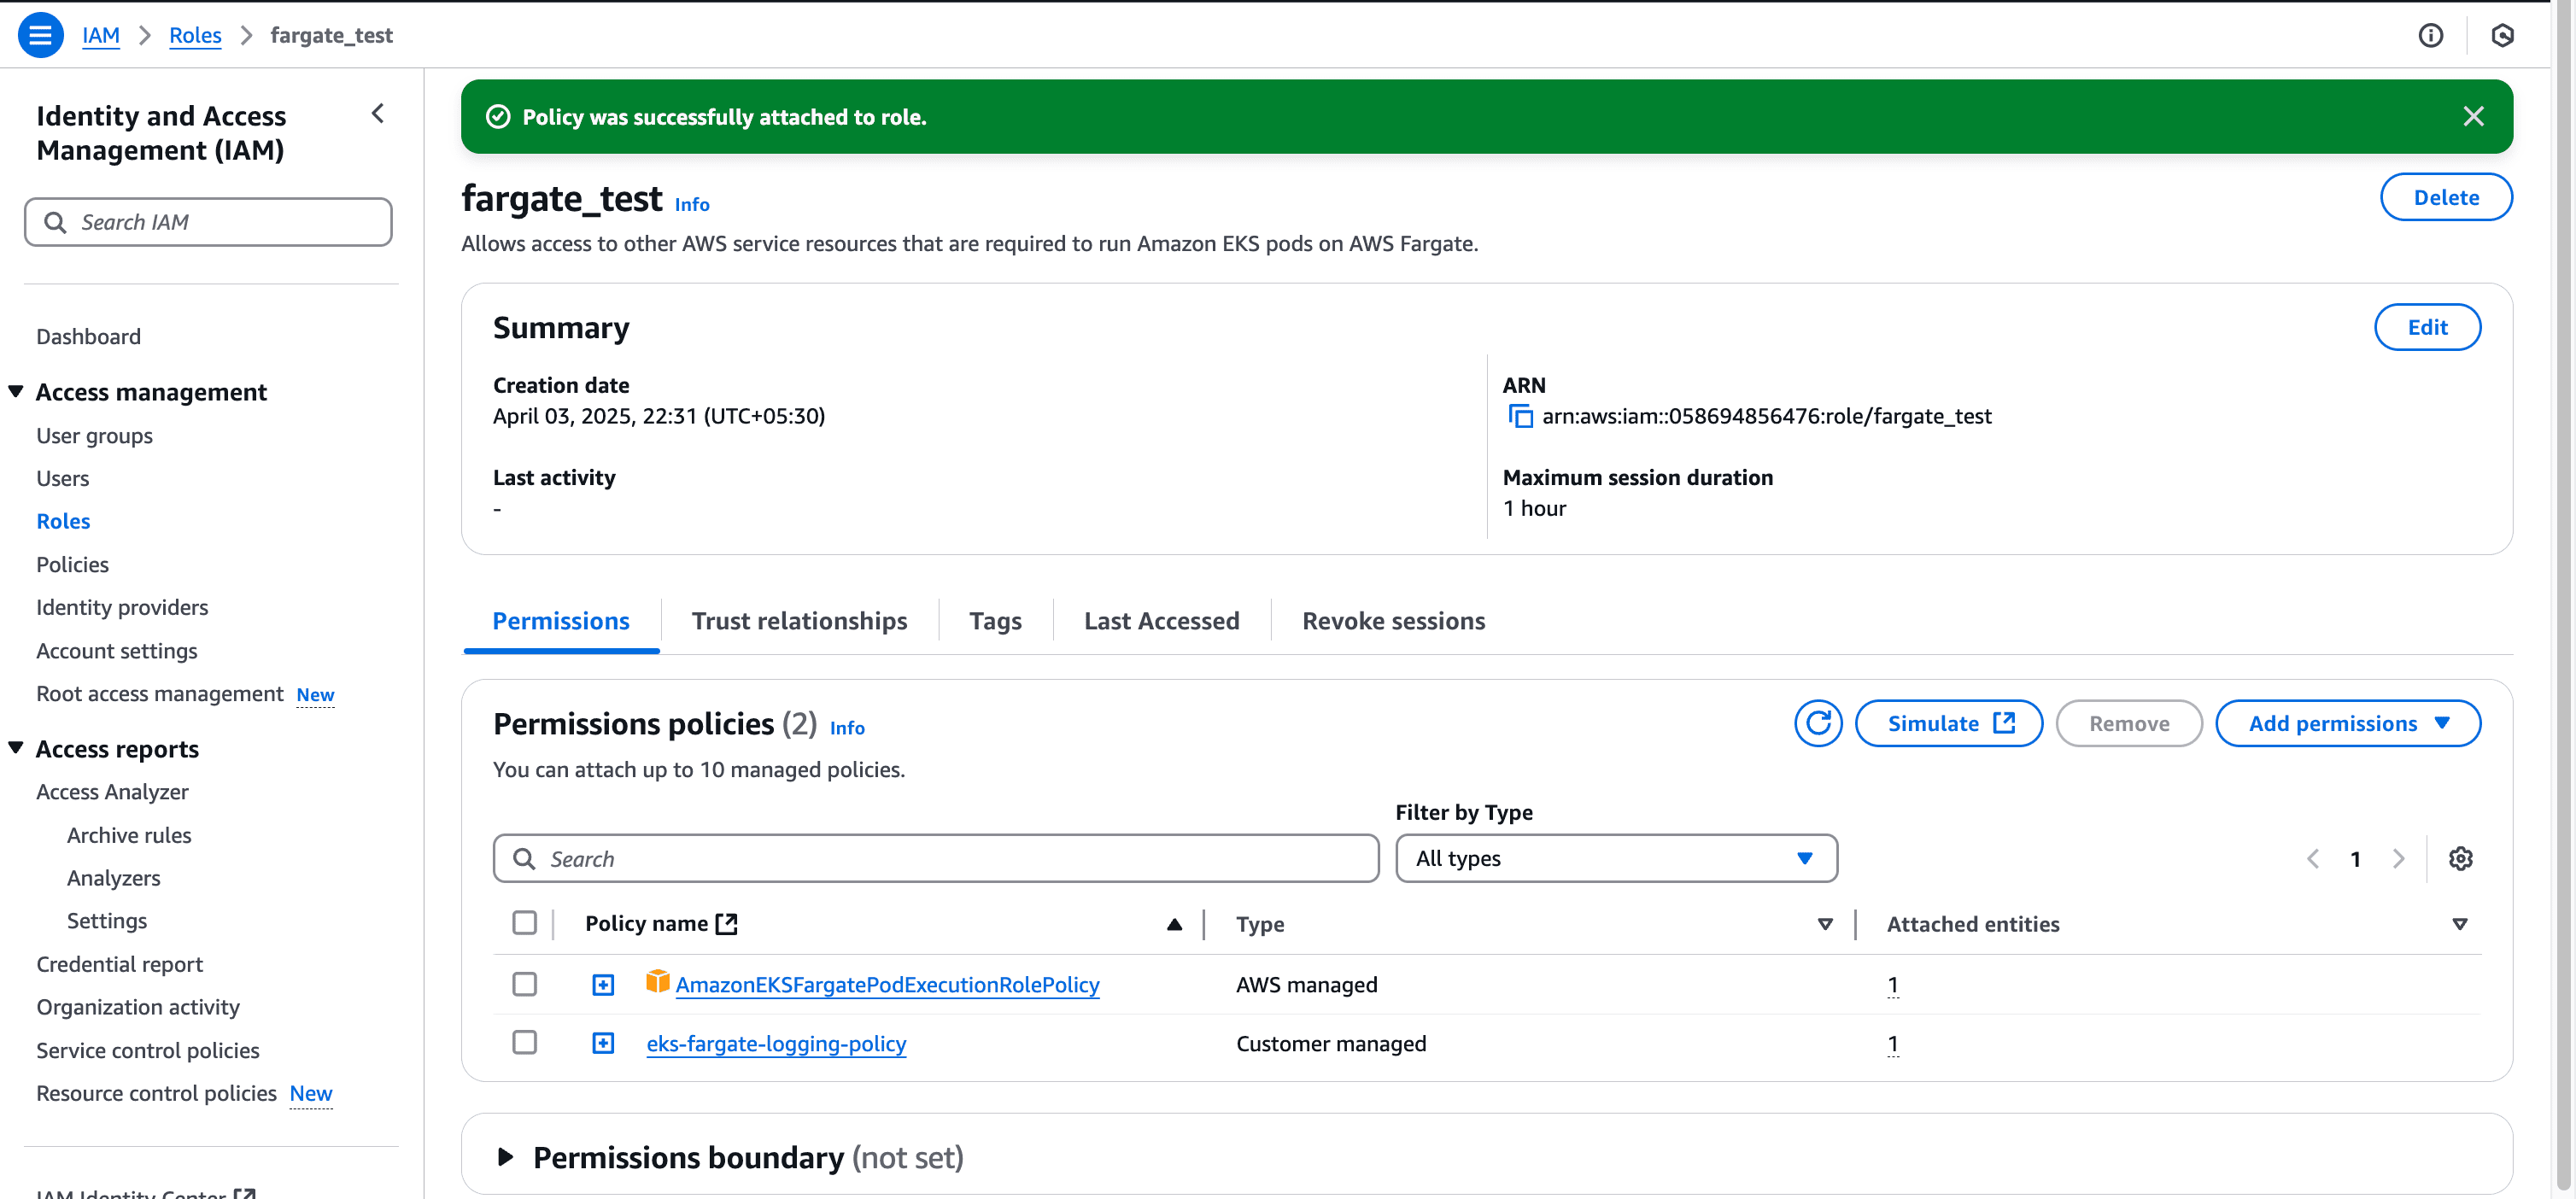
Now attach this policy to your Fargate pod execution role:
- In the IAM console, select "Roles"
- Search for and select your Fargate pod execution role (fargate_test)
- Click "Add permissions" and select "Attach policies"
- Search for "eks-fargate-firehose-policy"
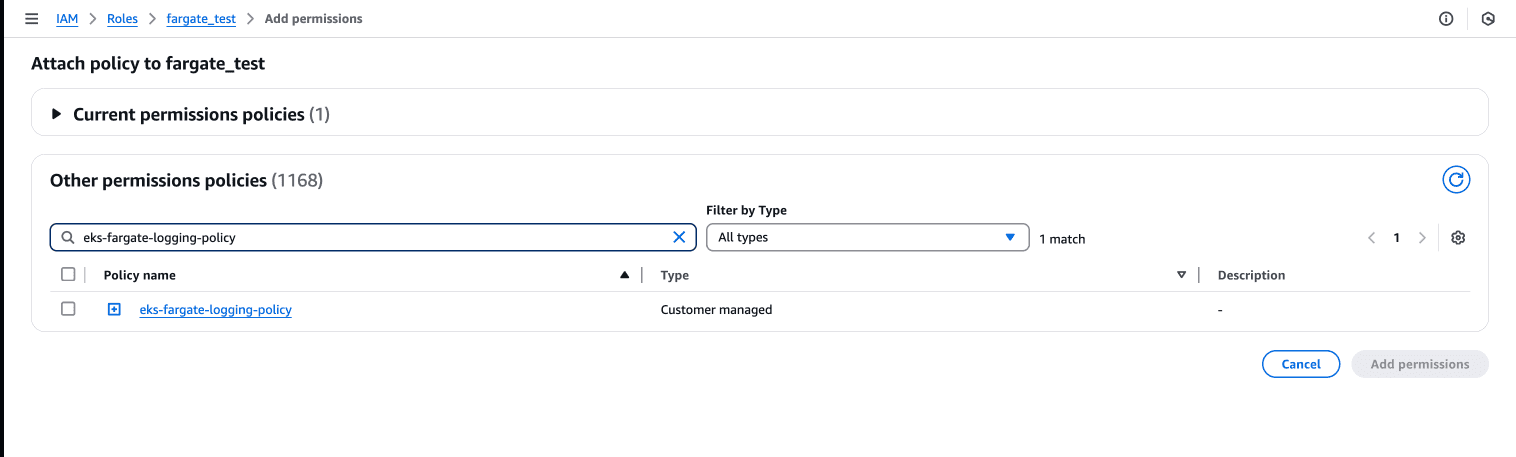
- Select the policy and click "Attach policy"
Step 5: Configure Fargate Logging with ConfigMap
Now we'll create a ConfigMap that configures the built-in Fluent Bit to send logs to our Firehose delivery stream:
cat > aws-logging-firehose-configmap.yaml << 'EOF'
kind: ConfigMap
apiVersion: v1
metadata:
  name: aws-logging
  namespace: aws-observability
data:
  filters.conf: |
    [FILTER]
        Name parser
        Match *
        Key_name log
        Parser crio
    [FILTER]
        Name kubernetes
        Match kube.*
        Merge_Log On
        Keep_Log Off
        Buffer_Size 0
        Kube_Meta_Cache_TTL 300s
  output.conf: |
    [OUTPUT]
        Name kinesis_firehose
        Match *
        region ${AWS_REGION}
        delivery_stream eks-fargate-to-openobserve
  parsers.conf: |
    [PARSER]
        Name crio
        Format Regex
        Regex ^(?<time>[^ ]+) (?<stream>stdout|stderr) (?<logtag>P|F) (?<log>.*)$
        Time_Key time
        Time_Format %Y-%m-%dT%H:%M:%S.%L%z
EOF

# Replace ${AWS_REGION} with your actual AWS region
sed -i '' "s/\${AWS_REGION}/us-east-2/g" aws-logging-firehose-configmap.yaml

kubectl apply -f aws-logging-firehose-configmap.yaml
Note: Make sure to replace
eks-fargate-to-openobservewith your Firehose delivery stream name.
Step 6: Create a Namespace for Fargate Workloads
Create the namespace specified in your Fargate profile:
kubectl create namespace ns-fargate
Step 7: Deploy Test Pods in the Fargate Namespace
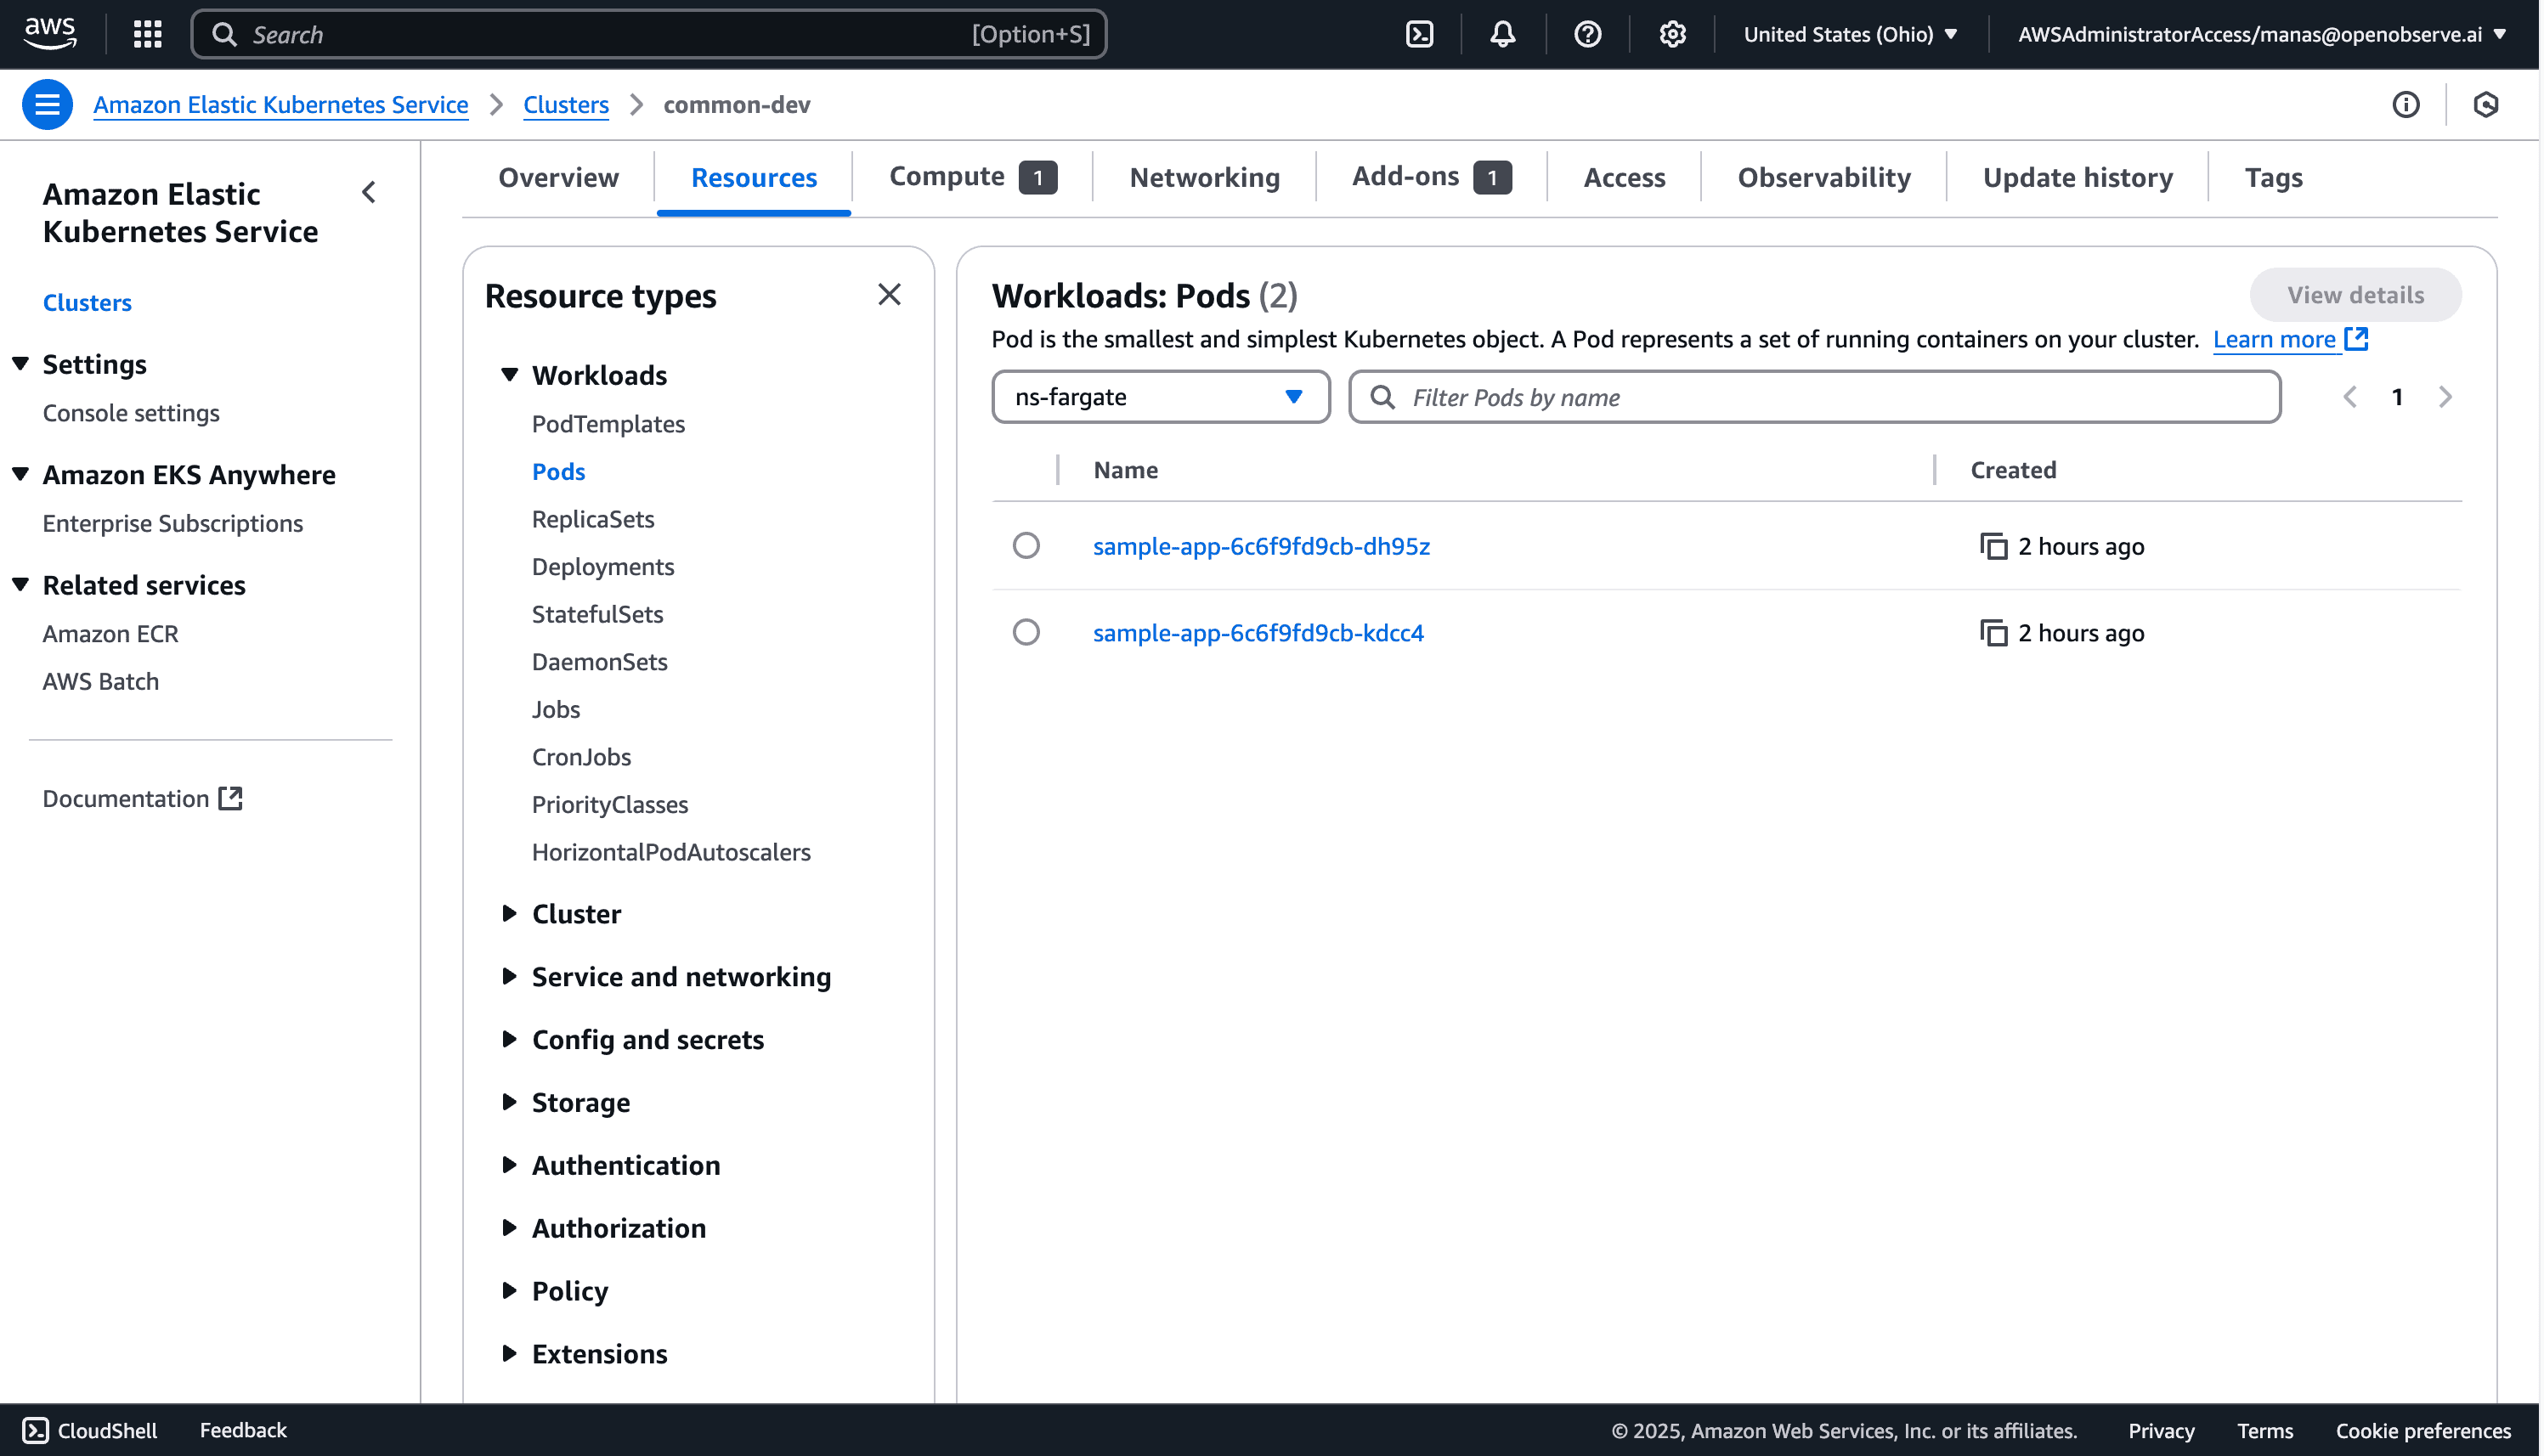
Let's deploy a test application to verify our logging setup:
cat > sample-app.yaml << 'EOF'
apiVersion: apps/v1
kind: Deployment
metadata:
  name: sample-app
  namespace: ns-fargate
  labels:
    test: fargate
spec:
  replicas: 2
  selector:
    matchLabels:
      app: nginx
      test: fargate
  template:
    metadata:
      labels:
        app: nginx
        test: fargate
    spec:
      containers:
        - name: nginx
          image: nginx:latest
          ports:
            - name: http
              containerPort: 80
          # Generate some logs
          command: ["/bin/sh", "-c"]
          args:
            - while true; do
                echo "Test log message at $(date)";
                sleep 5;
              done
EOF

kubectl apply -f sample-app.yaml
This deployment creates two pods in the ns-fargate namespace with the appropriate labels to match our Fargate profile.
Step 8: Verify the Setup
Let's verify that our pods are running and generating logs:
# Check if pods are running
kubectl get pods -n ns-fargate

Step 9: View Logs in OpenObserve
Now, let's check if logs are appearing in OpenObserve:
- Log in to your OpenObserve UI
- Navigate to the Logs section
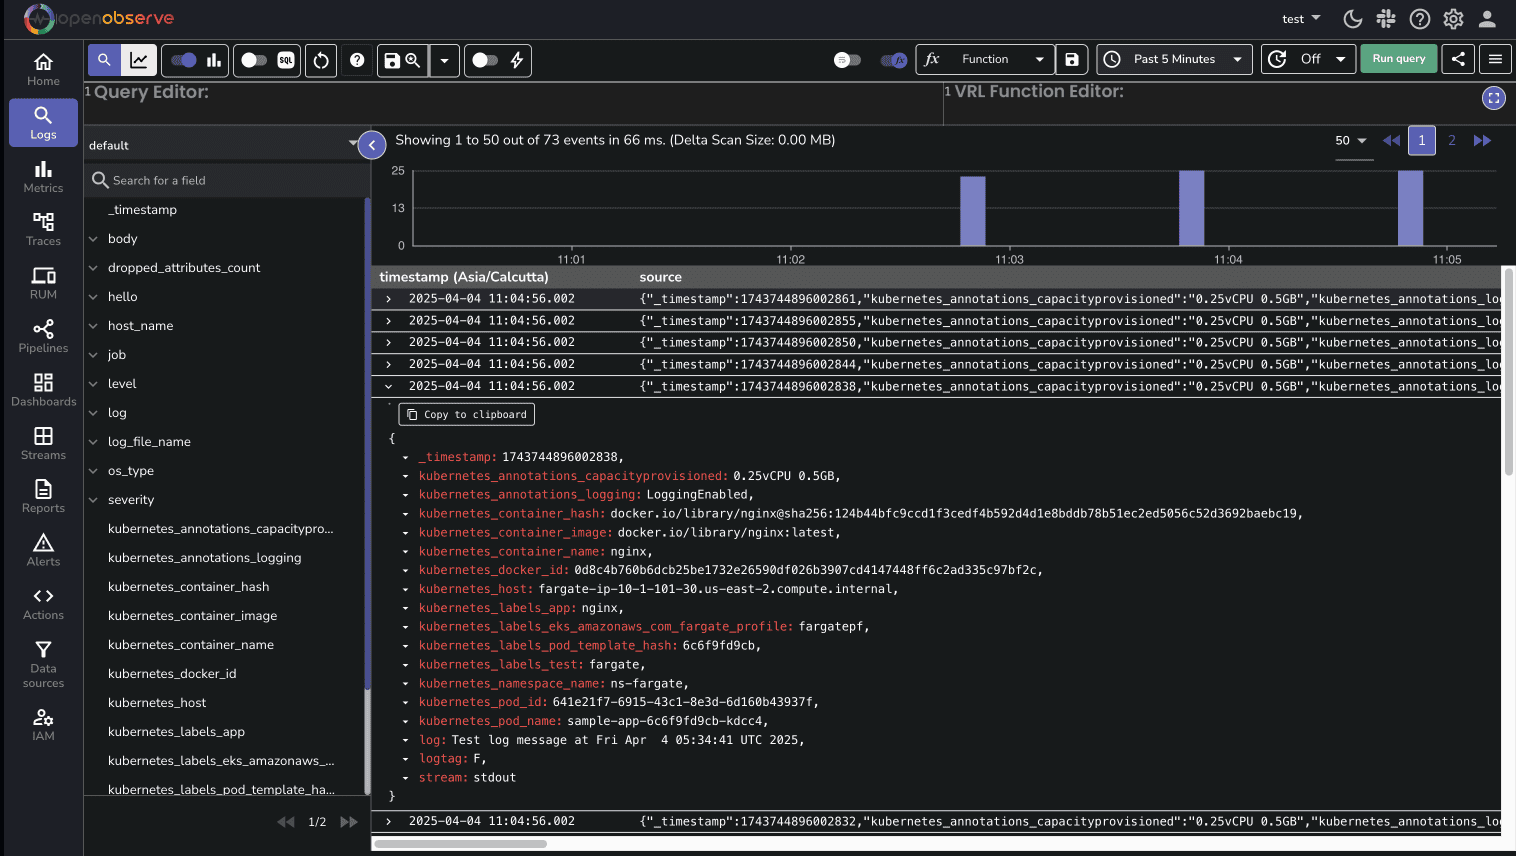
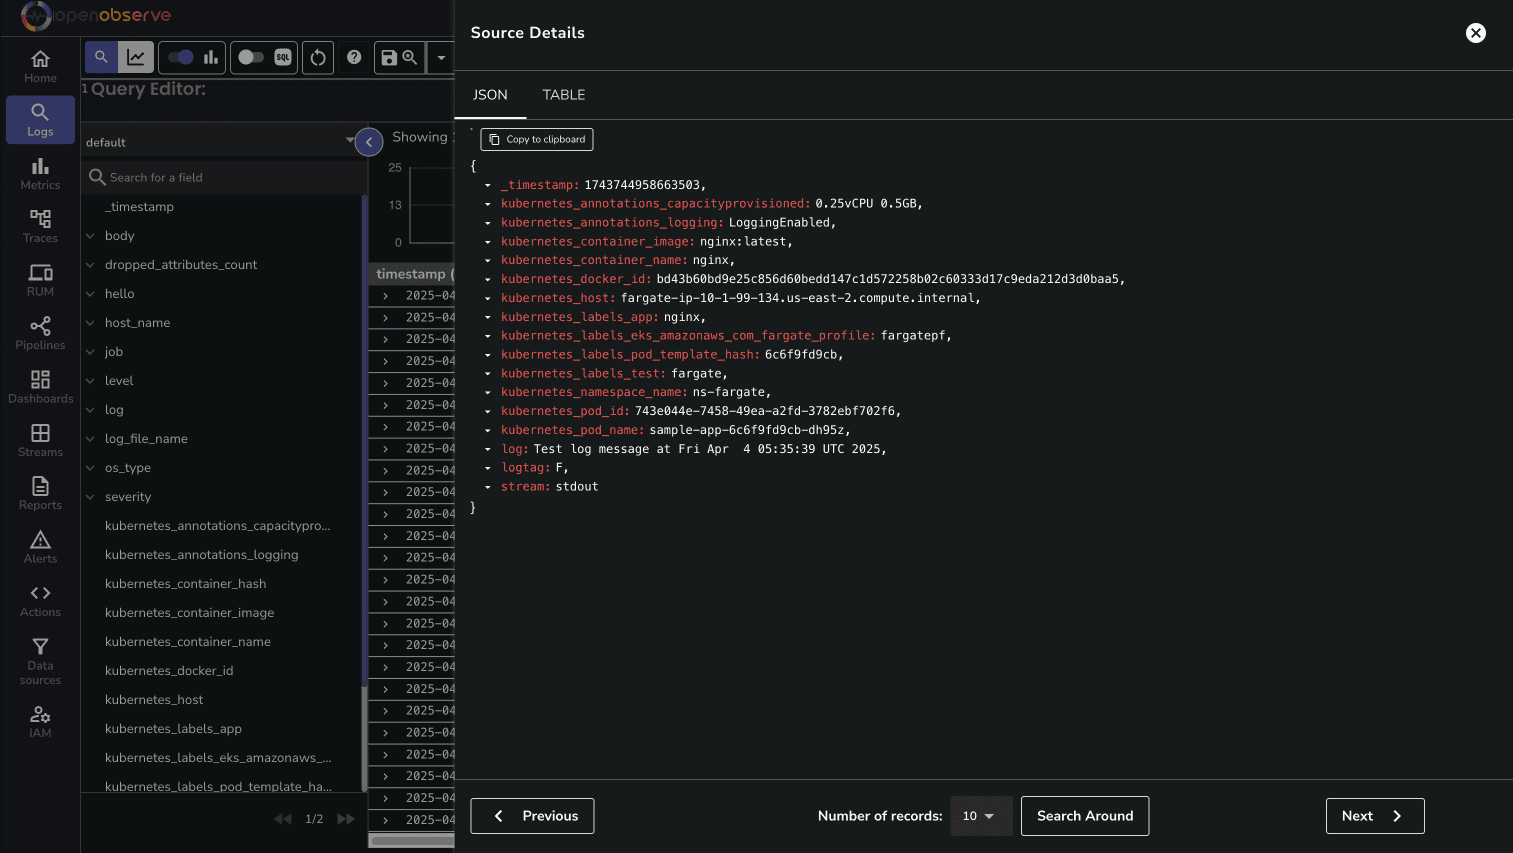
You might need to wait a few minutes for logs to appear in OpenObserve, as Firehose batches data before sending it.
Troubleshooting
If logs aren't appearing in OpenObserve, here are some troubleshooting steps:
Check Firehose delivery stream metrics in the AWS console to see if data is being received and delivered
Enable Fluent Bit debug logs by updating the ConfigMap:
flb_log_cw: "true" # Ships Fluent Bit process logs to CloudWatchCheck CloudWatch Logs for Fluent Bit process logs:
- Look for a log group named something like
my-cluster-fluent-bit-logs
- Look for a log group named something like
Check pod events for any logging-related issues:
kubectl describe pod -l app=nginx -n ns-fargateVerify the Firehose delivery stream configuration in the AWS console
Conclusion
In this guide, we've successfully built a complete logging pipeline for Amazon EKS Fargate workloads using Kinesis Firehose and OpenObserve. This approach elegantly addresses the limitations of Fargate's built-in Fluent Bit implementation while maintaining a fully serverless architecture. By leveraging AWS's managed services alongside OpenObserve's powerful analysis capabilities, you now have a robust observability solution that requires minimal maintenance.
For further exploration, check out the official documentation for Amazon EKS Fargate Logging, Fluent Bit, and OpenObserve. Consider enhancing your setup with custom dashboards, alerts, and structured logging to gain even deeper insights into your containerized applications.
Happy Monitoring🚀
About the Author
Manas Sharma


Manas is a passionate Dev and Cloud Advocate with a strong focus on cloud-native technologies, including observability, cloud, kubernetes, and opensource. building bridges between tech and community.
Follow OpenObserve on Google
Add OpenObserve as a preferred source to see more of our articles in Google Search and Top Stories.













