Complete Windows Monitoring with OpenObserve: Event Logs, Metrics and More




Ready to get started?
Try OpenObserve Cloud today for more efficient and performant observability.

Windows servers and workstations form the backbone of many enterprise environments, but monitoring them effectively can be challenging. From critical system events to performance metrics, Windows generates a wealth of telemetry data that-when properly collected and analyzed-can provide invaluable insights into system health, security posture, and performance bottlenecks.
In this comprehensive guide, we'll explore how to implement complete Windows monitoring using OpenObserve. We'll cover two powerful approaches: the streamlined OpenObserve agent for quick deployment and the customizable OpenTelemetry Collector for advanced configurations. Whether you're troubleshooting system issues, tracking security events, or monitoring performance metrics, this guide will help you gain full visibility into your Windows environment.
Understanding Windows Monitoring Data
Windows systems generate several types of monitoring data that are essential for maintaining system health and security:
Windows Event Logs
Windows Event Logs are organized into channels, with the most common ones being:
- Application: Records events from applications and programs
- Security: Contains security-related events like login attempts and security policy changes
- System: Tracks system events such as driver failures and hardware changes
- Setup: Records events related to application setup
- Forwarded Events: Contains events collected from remote computers
Each event in these logs contains several key components:
- Timestamp: When the event occurred
- Event ID: A unique identifier for the type of event
- Level: The severity of the event (Information, Warning, Error, Critical)
- Source: The application, service, or component that generated the event
- Description: A detailed message about what happened
Windows Event Logs provide invaluable insights that serve multiple purposes across IT operations. They enable early problem detection by revealing issues before they impact users, strengthen security monitoring by tracking unauthorized access attempts, support compliance requirements by maintaining audit trails, facilitate troubleshooting by providing detailed diagnostic information, and enable performance analysis by tracking resource utilization patterns.
Here's a sample Windows Event Log record as captured by OpenTelemetry:
{
  "_timestamp": 1743779634244849,
  "body_channel": "Application",
  "body_computer": "DESKTOP-EB5G184",
  "body_event_data_data": "[{\"\":\"Service stopped\"}]",
  "body_event_id_id": "0",
  "body_event_id_qualifiers": "0",
  "body_execution_process_id": "4656",
  "body_execution_thread_id": "0",
  "body_keywords": "[\"0x80000000000000\"]",
  "body_level": "4",
  "body_message": "",
  "body_opcode": "0",
  "body_provider_event_source": "",
  "body_provider_guid": "",
  "body_provider_name": "brave",
  "body_record_id": "30058",
  "body_system_time": "2025-04-04T15:13:54.2448490Z",
  "body_task": "0",
  "dropped_attributes_count": 0,
  "host_name": "DESKTOP-EB5G184",
  "os_type": "windows",
  "severity": "INFO"
}
Windows Performance Metrics
Beyond event logs, Windows provides detailed performance metrics through Windows Performance Counters. These metrics track:
- CPU Usage: Processor time, queue length, and interrupts
- Memory: Available memory, page faults, and cache usage
- Disk I/O: Read/write operations, queue length, and latency
- Network: Bytes sent/received, connection rates, and errors
- Process-specific metrics: Resource usage by individual processes
Monitoring these metrics helps identify performance bottlenecks, capacity issues, and resource constraints before they impact users.
Setting Up Windows Monitoring with OpenObserve
OpenObserve offers two powerful approaches for Windows monitoring:
- OpenObserve Agent: A streamlined, all-in-one solution for quick deployment
- OpenTelemetry Collector: A customizable approach for advanced configurations
Let's explore both options, starting with the recommended and simplest approach.
Option 1: Using the OpenObserve Agent (Recommended)
The OpenObserve agent provides a simple, one-command installation that automatically collects both Windows Event Logs and Performance Metrics.
Prerequisites
Before we begin, ensure you have:
- A Windows machine (Windows 10/11 or Windows Server)
- Administrator access to install and configure services
- Access to an OpenObserve instance (cloud or self-hosted)
Installation
To install the OpenObserve agent:
- Log in to your OpenObserve instance
- Navigate to Data Sources → Recommended → Windows
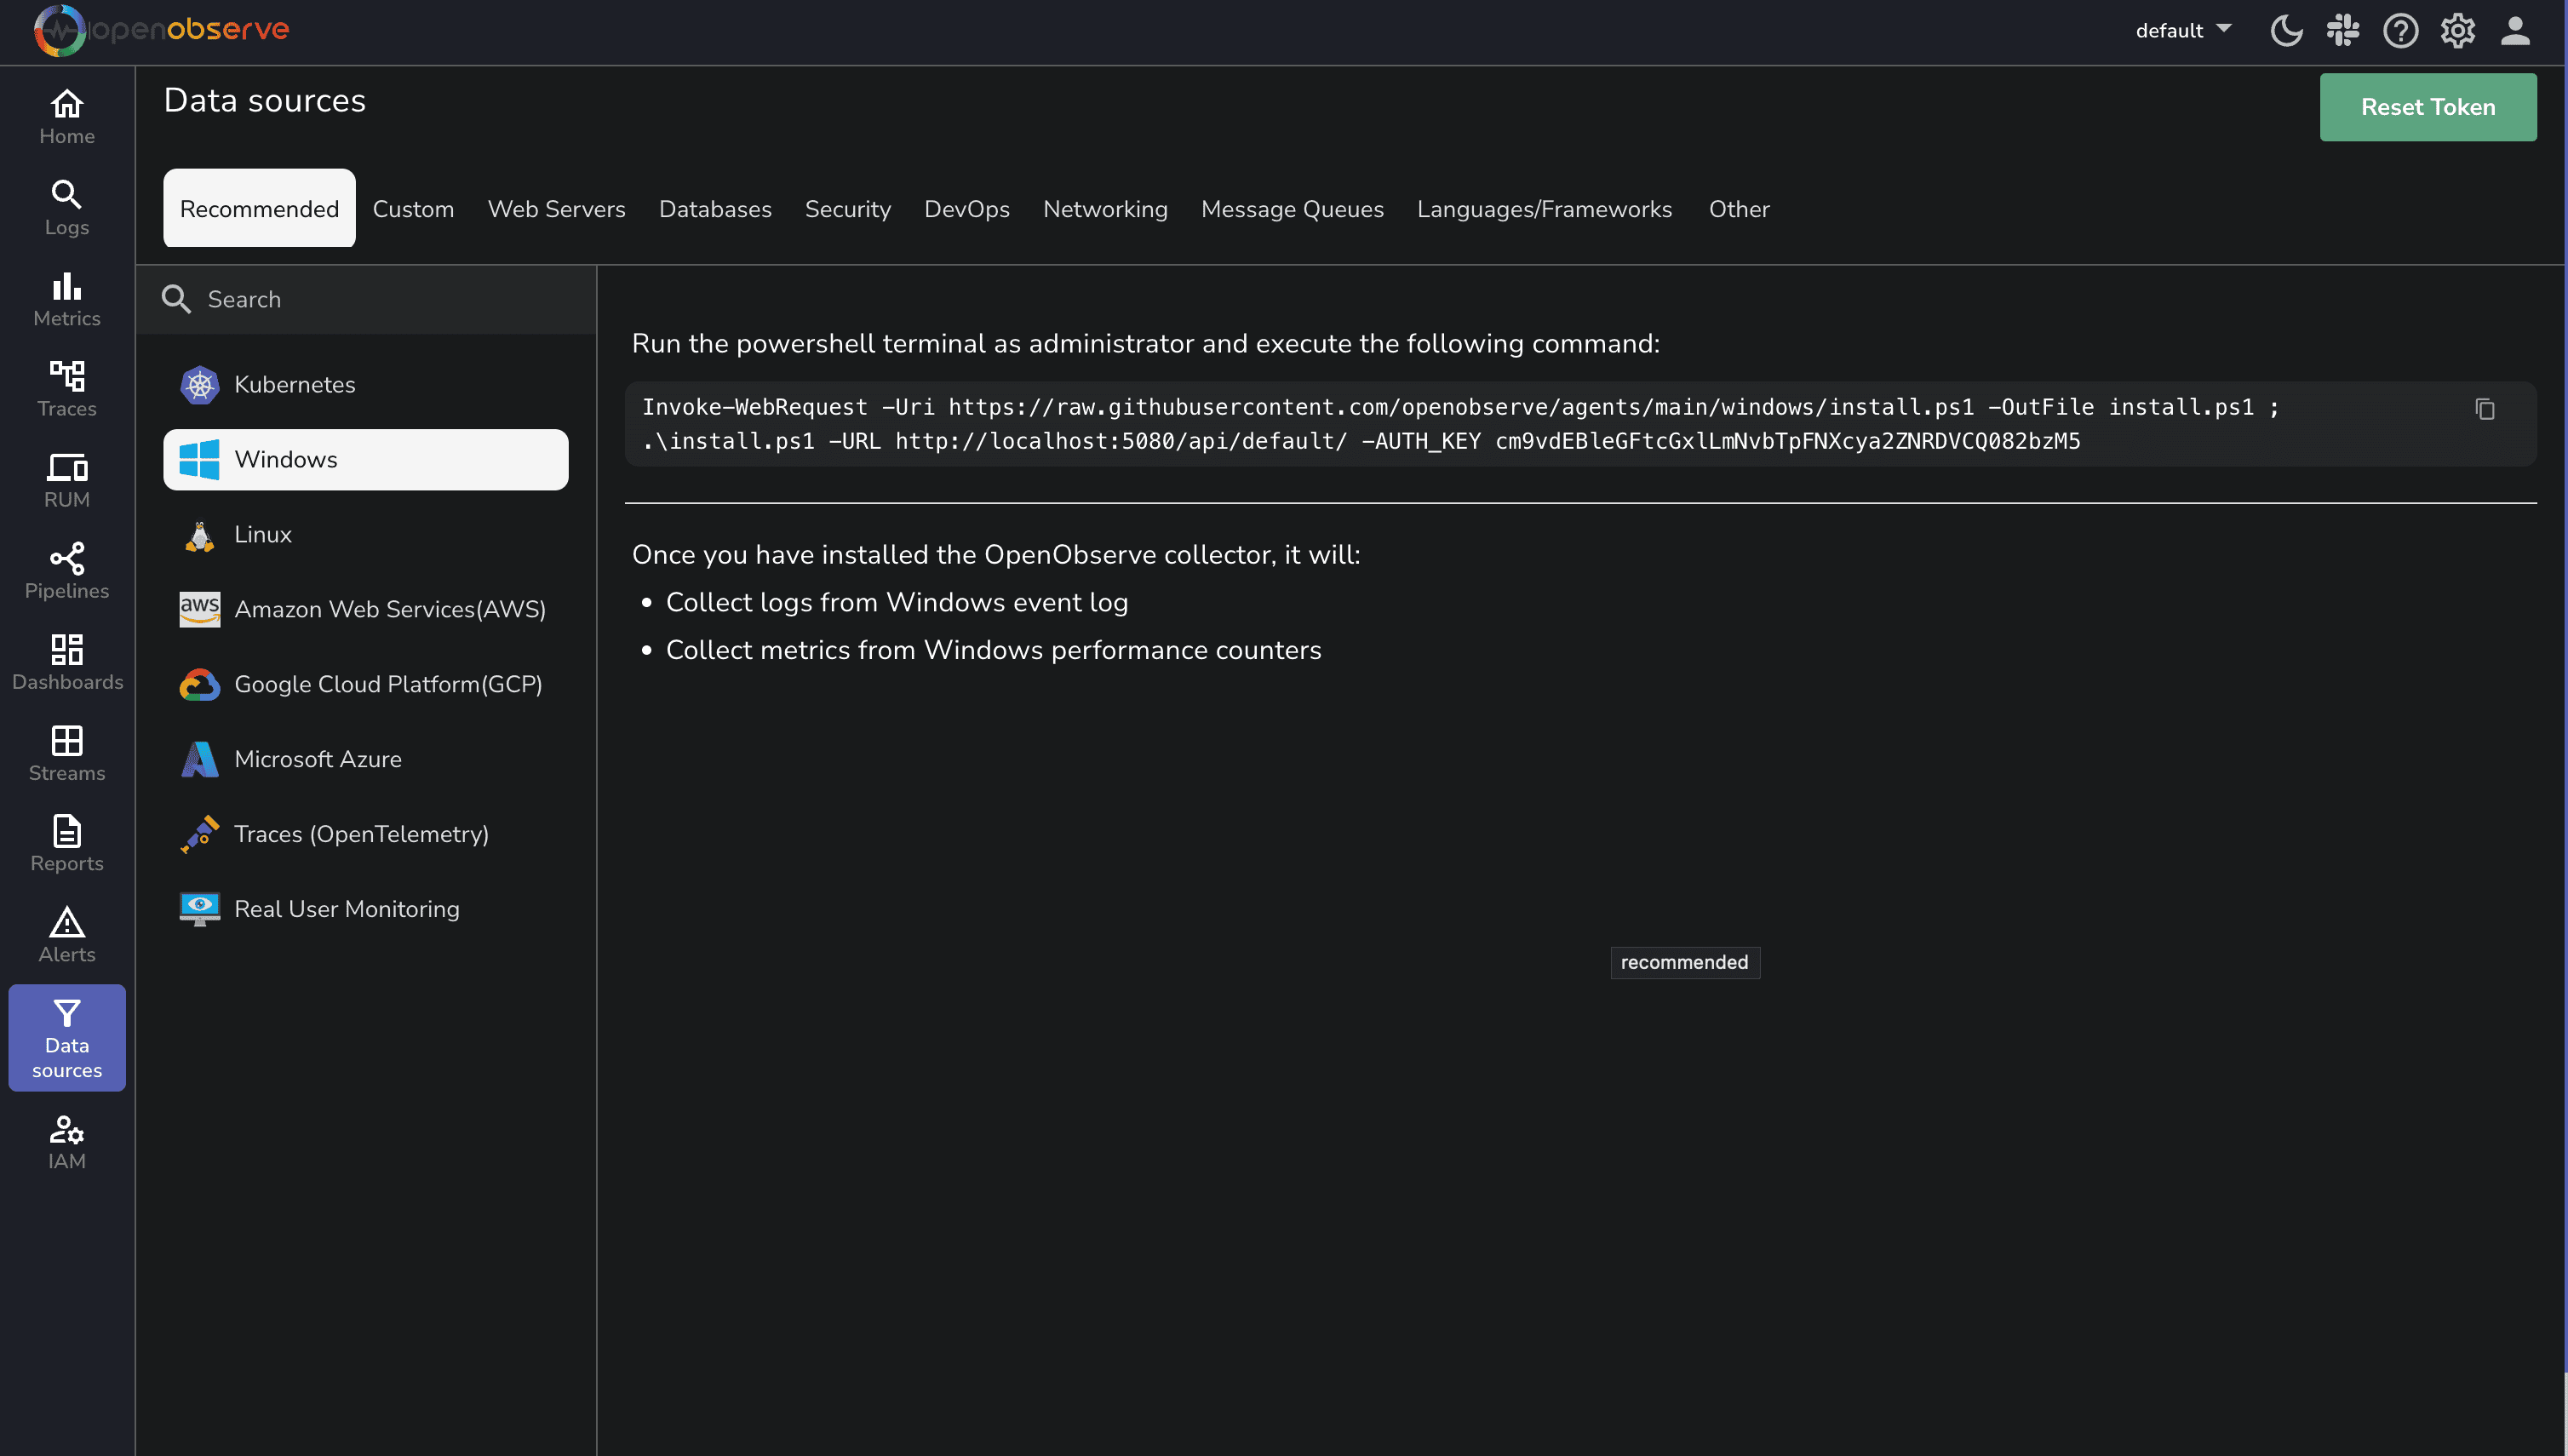
- Copy the provided PowerShell command
- Open PowerShell as Administrator and execute the command:
Invoke-WebRequest -Uri https://raw.githubusercontent.com/openobserve/agents/main/windows/install.ps1 -OutFile install.ps1 ; .\install.ps1 -URL https://your-openobserve-instance.com/api/default/ -AUTH_KEY YOUR_API_KEY
That's it! The agent will automatically:
- Install as a Windows service that starts automatically
- Collect logs from Windows Event Log (Application, System, Security)
- Collect metrics from Windows Performance Counters
- Forward all data to your OpenObserve instance
What's Being Collected
The OpenObserve agent collects:
Event Logs:
- Application logs
- System logs
- Security logs
Performance Metrics:
- CPU usage (total and per core)
- Memory usage and availability
- Disk I/O and space utilization
- Network traffic and errors
- Process-level metrics
Option 2: Using the OpenTelemetry Collector
For more advanced configurations or if you're already using OpenTelemetry in your environment, you can use the OpenTelemetry Collector with the Windows Event Log Receiver.
Step 1: Setting Up the OpenTelemetry Collector
First, let's set up the OpenTelemetry Collector:
# Create a directory for the collector
New-Item -Path "C:\otel-collector" -ItemType Directory -Force
cd C:\otel-collector

# Download the latest collector contrib distribution
Invoke-WebRequest -Uri "https://github.com/open-telemetry/opentelemetry-collector-releases/releases/download/v0.115.0/otelcol-contrib_0.115.0_windows_amd64.tar.gz" -OutFile "otelcol-contrib.tar.gz"

# Extract the archive
tar -xzf otelcol-contrib.tar.gz
Step 2: Configure the OpenTelemetry Collector
Create a file named config.yaml in the C:\otel-collector directory with the following content:
receivers:
  windowseventlog/application:
    channel: application
  windowseventlog/system:
    channel: system
  windowseventlog/security:
    channel: security
  windowsperfcounters:
    collection_interval: 30s
    perfcounters:
      - object: "Processor"
        counters:
          - "% Processor Time"
        instances: ["*"]
      - object: "Memory"
        counters:
          - "Available Bytes"
          - "Committed Bytes"
        instances: [""]
      - object: "LogicalDisk"
        counters:
          - "% Free Space"
          - "Avg. Disk Queue Length"
        instances: ["*"]
      - object: "Network Interface"
        counters:
          - "Bytes Received/sec"
          - "Bytes Sent/sec"
        instances: ["*"]

processors:
  batch:
    send_batch_size: 1024
    timeout: 10s
  resourcedetection:
    detectors: [system]
    system:
      hostname_sources: ["os"]

exporters:
  otlphttp/openobserve:
    endpoint: "https://your-openobserve-instance.com/api/default"
    headers:
      Authorization: "Basic YOUR_API_KEY"
      stream-name: "windows-events"
  debug:
    verbosity: detailed

service:
  pipelines:
    logs:
      receivers:
        [
          windowseventlog/application,
          windowseventlog/system,
          windowseventlog/security,
        ]
      processors: [resourcedetection, batch]
      exporters: [otlphttp/openobserve, debug]
    metrics:
      receivers: [windowsperfcounters]
      processors: [resourcedetection, batch]
      exporters: [otlphttp/openobserve, debug]
  telemetry:
    logs:
      level: "info"
Replace
https://your-openobserve-instance.com/api/defaultwith your OpenObserve endpoint andYOUR_API_KEYwith your actual API key.
Step 3: Run the OpenTelemetry Collector
Run the collector using the following command:
.\otelcol-contrib.exe --config "C:\otel-collector\config.yaml"
To run the collector as a Windows service, you can use the New-Service PowerShell cmdlet or the SC command-line tool.
Advanced Configuration Options
Here are some practical configurations to enhance your Windows monitoring:
Filtering Security Events
Security logs can be voluminous. Focus on critical events by using XPath queries:
windowseventlog/security:
  channel: security
  xpath_query: "*[System[(EventID=4624 or EventID=4625 or EventID=4634 or EventID=4648 or EventID=4672)]]"
This configuration captures only login successes (4624), login failures (4625), logouts (4634), explicit credential uses (4648), and special privilege assignments (4672).
Remote Collection for Multiple Servers
For centralized monitoring of multiple servers:
receivers:
  # Local server logs
  windowseventlog/local_system:
    channel: system

  # Remote server logs
  windowseventlog/server1_system:
    channel: system
    remote:
      server: "server1.example.com"
      username: "${env:DOMAIN_USER}"
      password: "${env:DOMAIN_PASSWORD}"
      domain: "EXAMPLE"
Visualizing Windows Monitoring Data in OpenObserve
Once your data is flowing into OpenObserve, you can view and analyze it through the intuitive interface.
Exploring Windows Event Logs
Navigate to the Logs page in OpenObserve to view your Windows Event Logs:
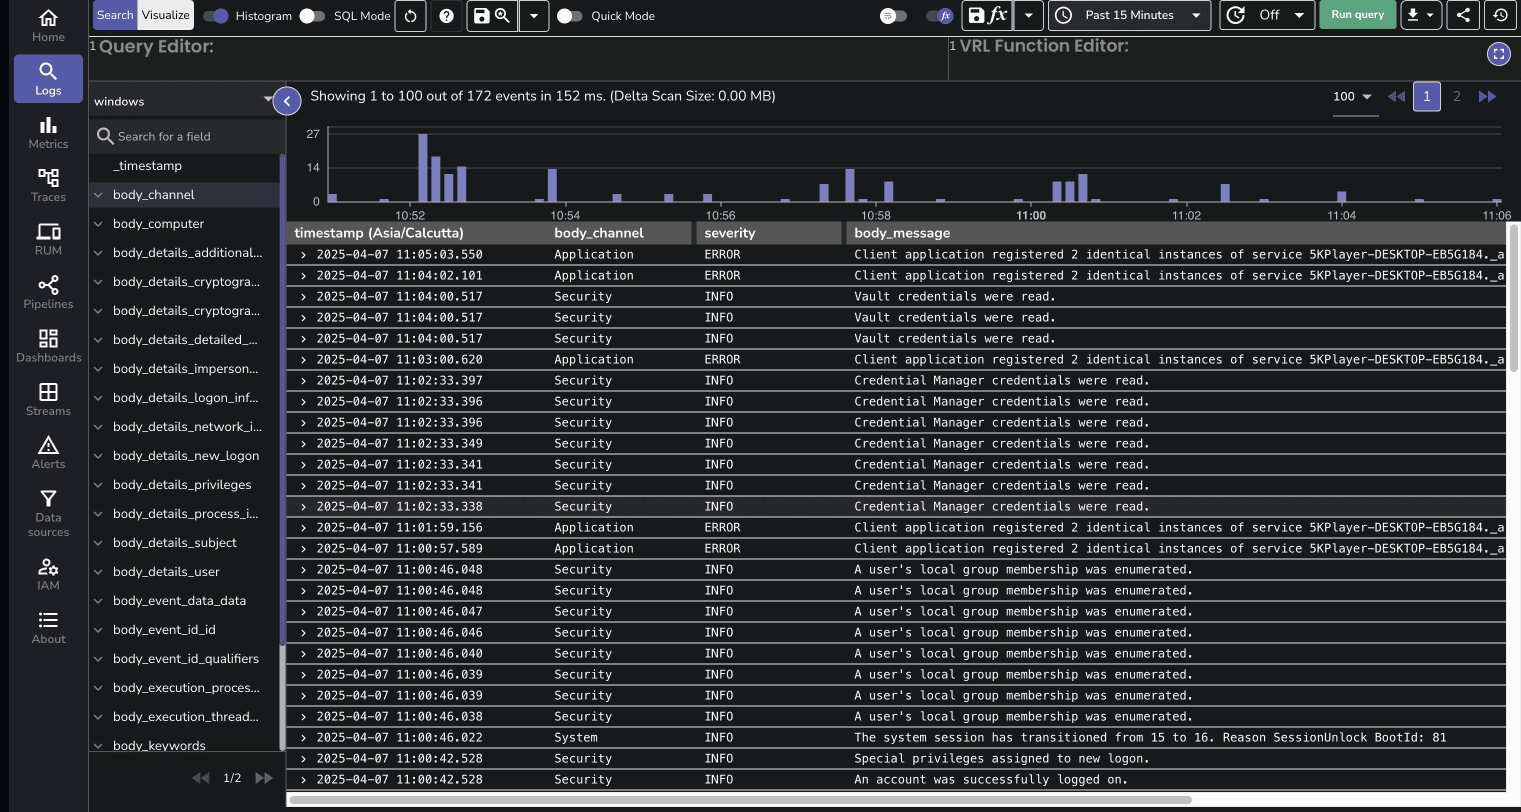
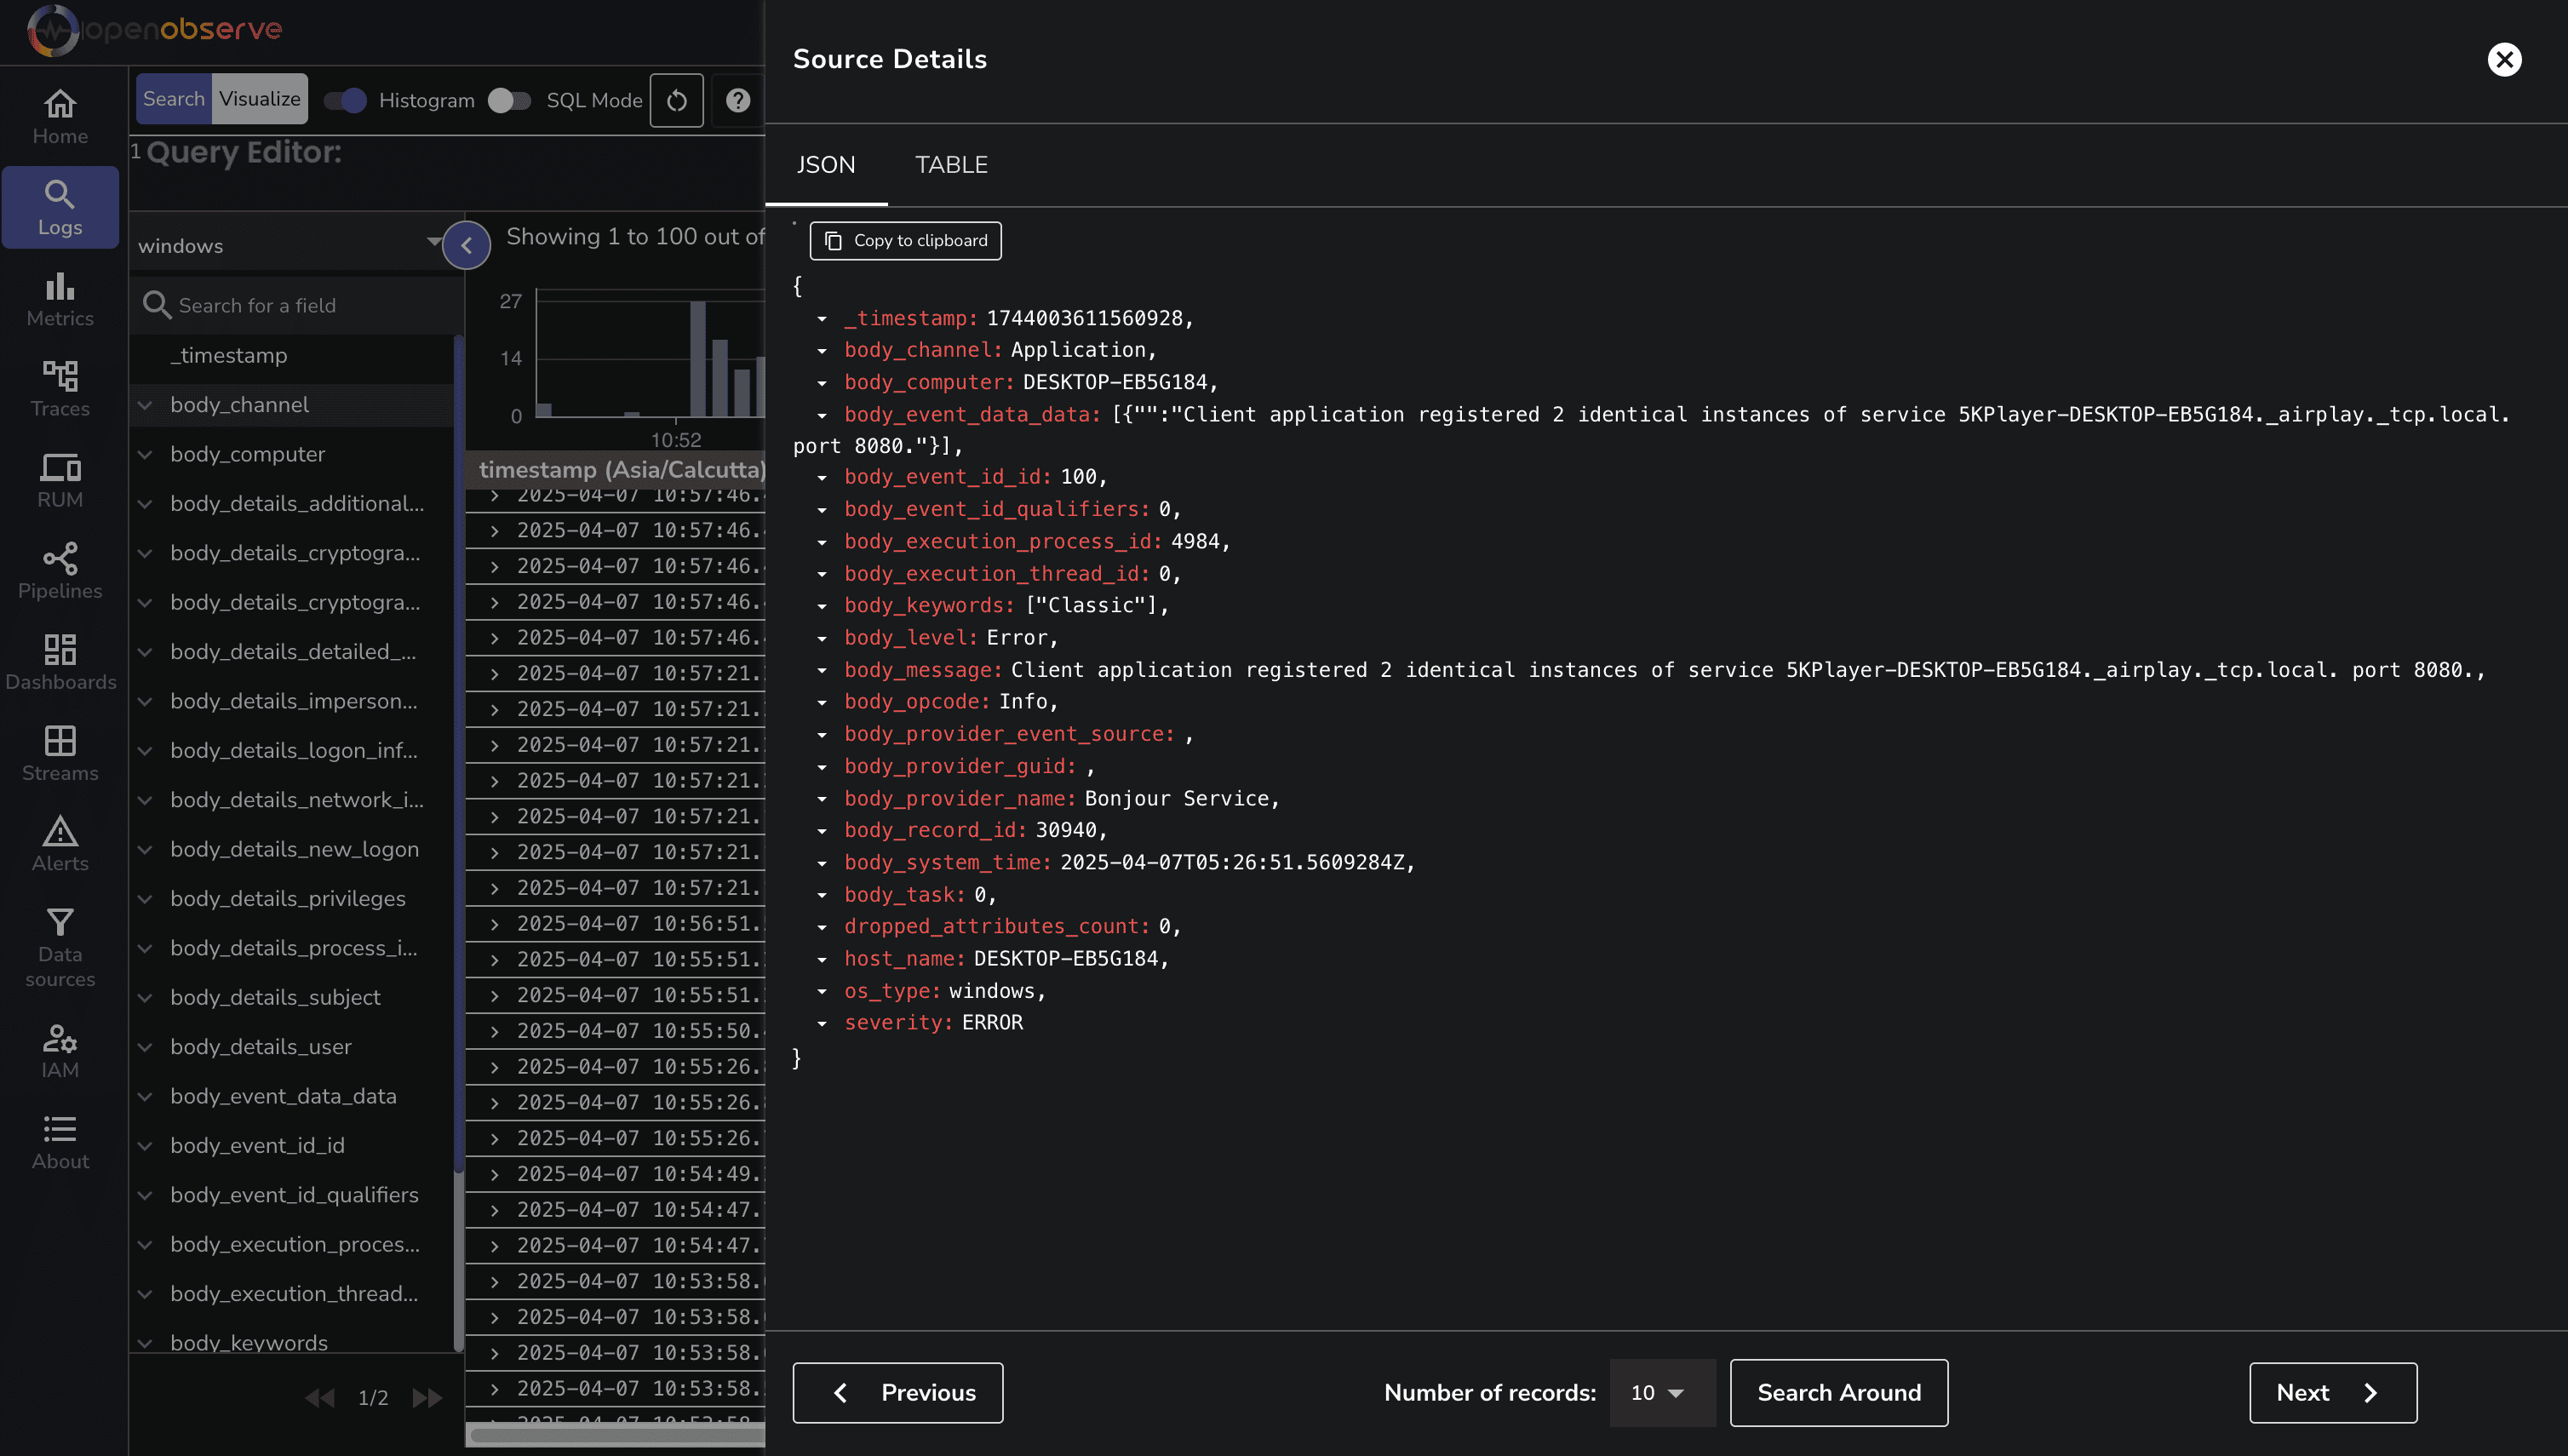
You can filter logs by severity, channel, or any other field to focus on specific events.
Analyzing Performance Metrics
The Metrics page allows you to visualize and analyze Windows system metrics:
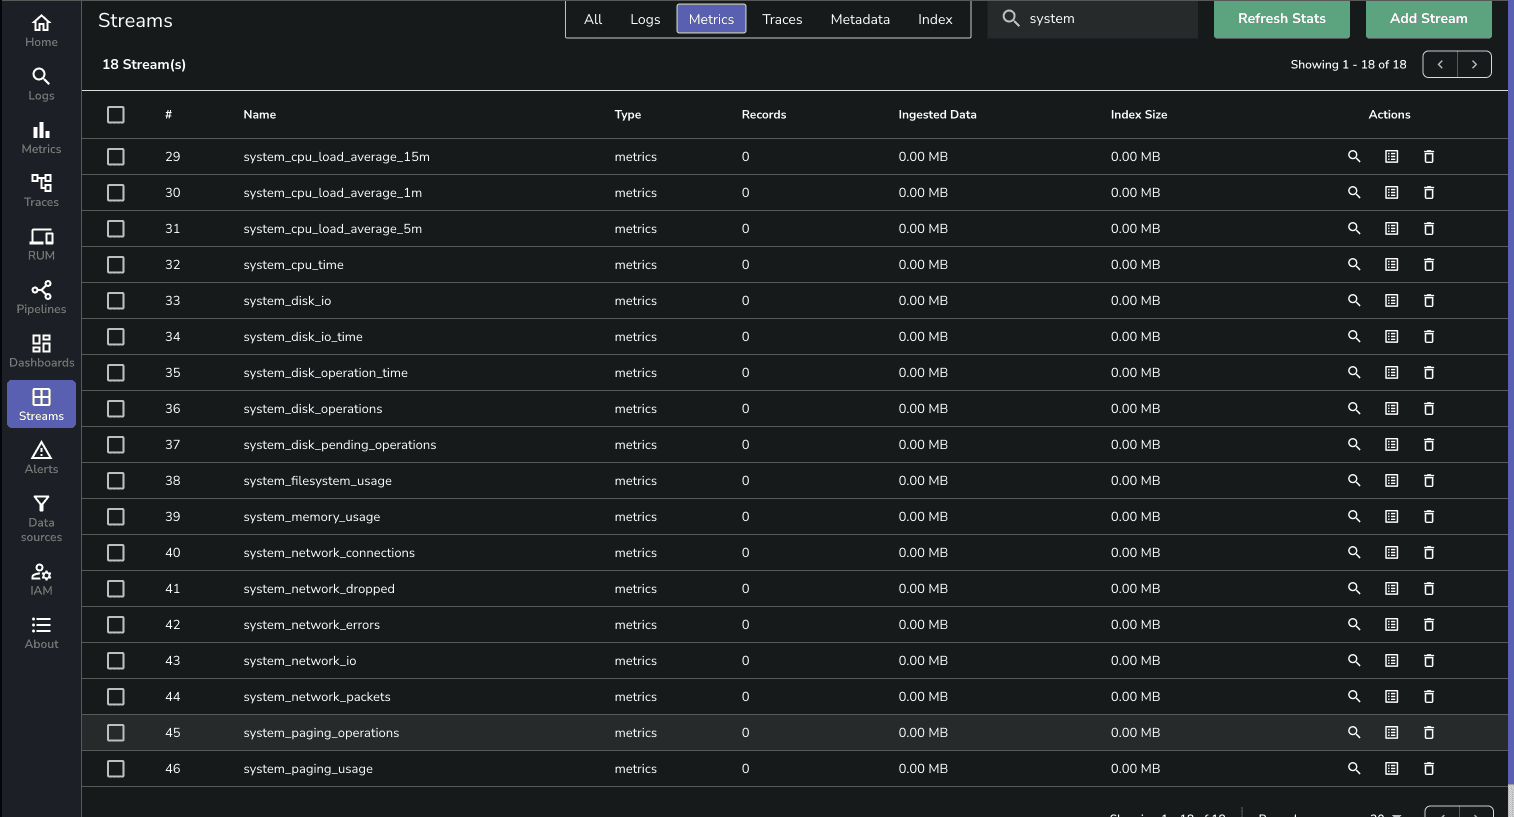
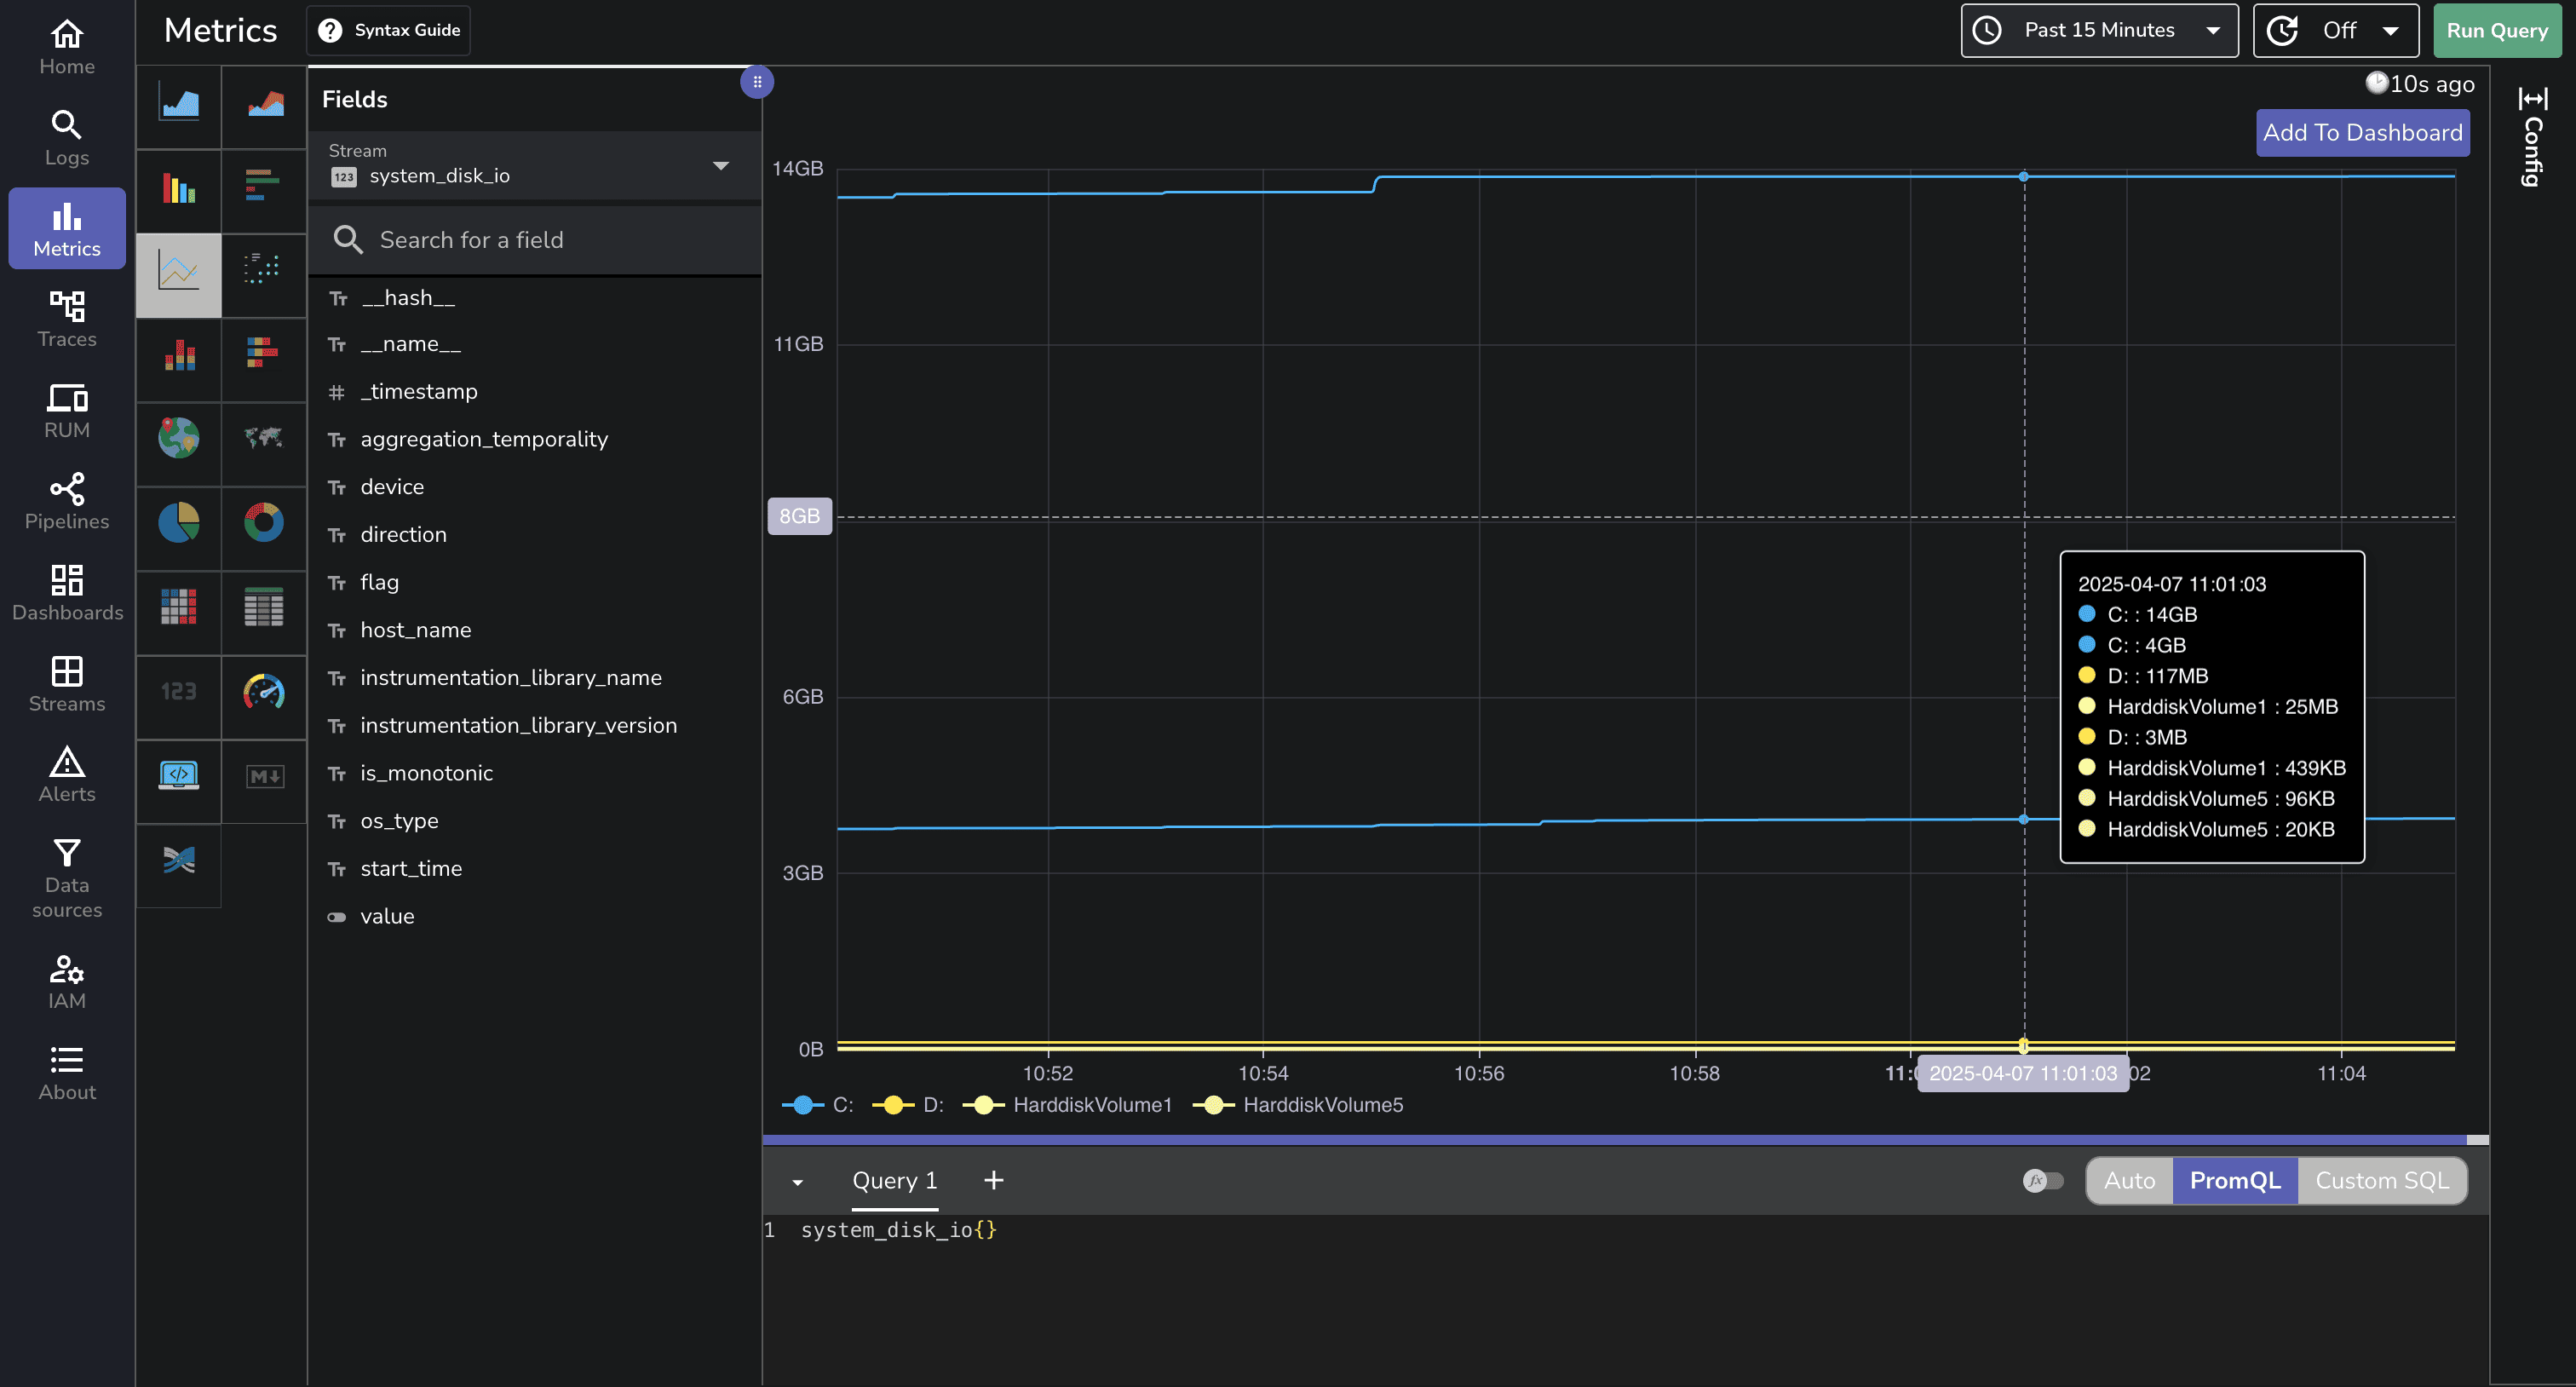
You can create custom charts to track CPU usage, memory consumption, disk I/O, and network activity over time.
Pre-built Dashboard
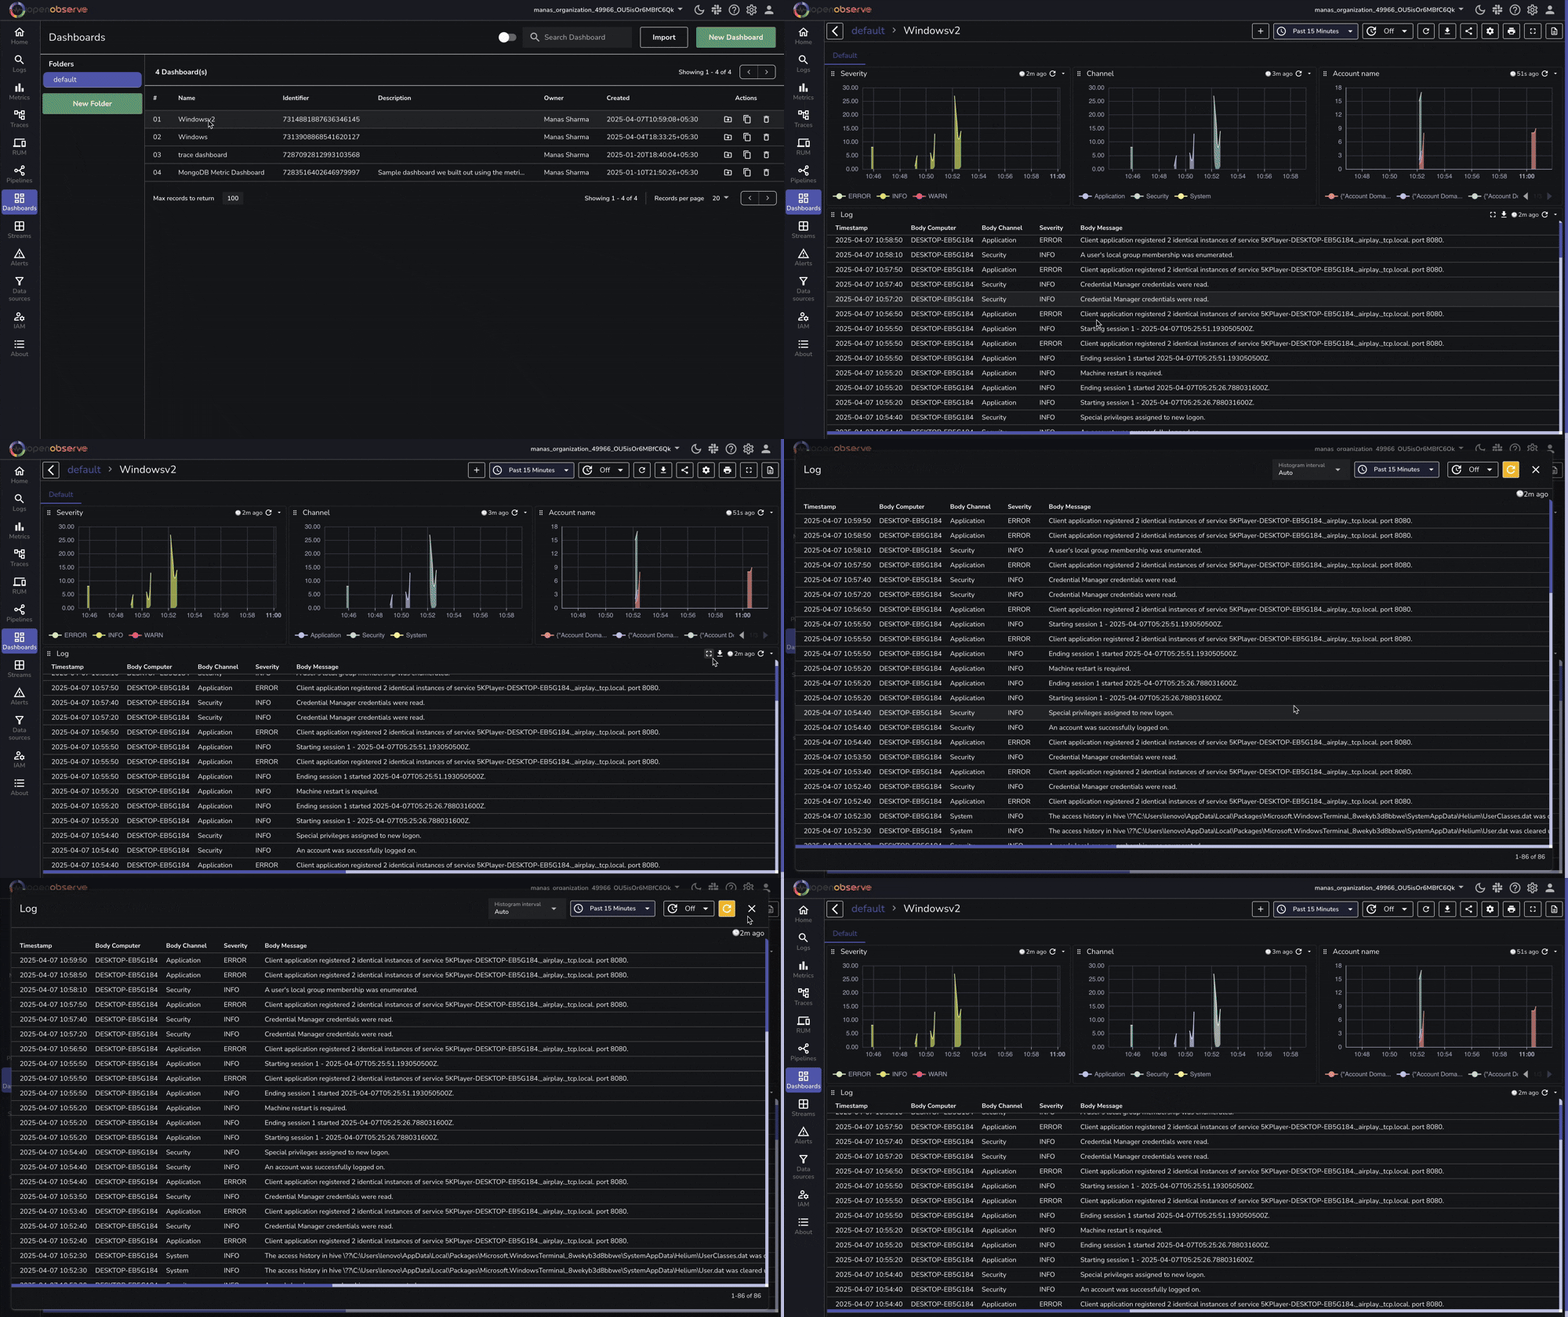
OpenObserve provides a pre-built dashboard for Windows monitoring that you can import directly:
Troubleshooting Tips
If you encounter issues with your Windows monitoring setup:
Verify Agent Installation: Check if the OpenObserve agent service is running with
Get-Service -Name "OpenObserveAgent".Check Permissions: The service account must have administrative privileges to access Windows Event Logs and Performance Counters.
Test Connectivity: Ensure your server can reach your OpenObserve instance with
Test-NetConnection -ComputerName your-openobserve-instance.com -Port 443.Review Event Log Access: For security logs, ensure the service account has the "Manage auditing and security log" right.
Conclusion
Effective Windows monitoring is crucial for maintaining reliable, secure, and performant systems. With OpenObserve, you now have two straightforward options for comprehensive Windows monitoring: the simple one-command OpenObserve agent for quick deployment, or the highly customizable OpenTelemetry Collector for advanced scenarios.
By centralizing your Windows monitoring in OpenObserve, you gain the ability to correlate events across systems, track performance trends, and quickly identify the root cause of issues. The combination of event logs and performance metrics provides a complete picture of your Windows environment, enabling you to be proactive rather than reactive in your IT operations.
Whether you're managing a single Windows server or a large fleet of machines, this monitoring approach scales with your needs while providing the deep visibility required for effective troubleshooting, security monitoring, and performance optimization.
For more information, check out the OpenObserve documentation and start transforming your Windows monitoring today.
Happy monitoring! 🚀
About the Author
Manas Sharma


Manas is a passionate Dev and Cloud Advocate with a strong focus on cloud-native technologies, including observability, cloud, kubernetes, and opensource. building bridges between tech and community.
Follow OpenObserve on Google
Add OpenObserve as a preferred source to see more of our articles in Google Search and Top Stories.













