Complete Linux Monitoring with OpenObserve: Event Logs, Host Metrics, and More




Ready to get started?
Try OpenObserve Cloud today for more efficient and performant observability.

Linux powers everything from web servers and databases to containers and IoT devices. While its stability is legendary, effective monitoring remains essential for maintaining performance, security, and reliability. Linux generates a wealth of telemetry data through system logs and performance metrics that-when properly collected and analyzed-provides invaluable insights into system health and behavior.
In this comprehensive guide, we'll explore how to implement complete Linux monitoring using OpenObserve. We'll cover two powerful approaches: the streamlined OpenObserve agent for quick deployment and the customizable OpenTelemetry Collector for advanced configurations. Whether you're troubleshooting system issues, tracking security events, or monitoring performance metrics, this guide will help you gain full visibility into your Linux environment.
Understanding Linux Monitoring Data
Linux systems generate several types of monitoring data that are essential for maintaining system health and security:
Linux System Logs
Linux system logs are records of system activities, errors, warnings, and informational messages generated by the Linux kernel, applications, and services. Think of them as your system's diary – they note everything that happens behind the scenes.
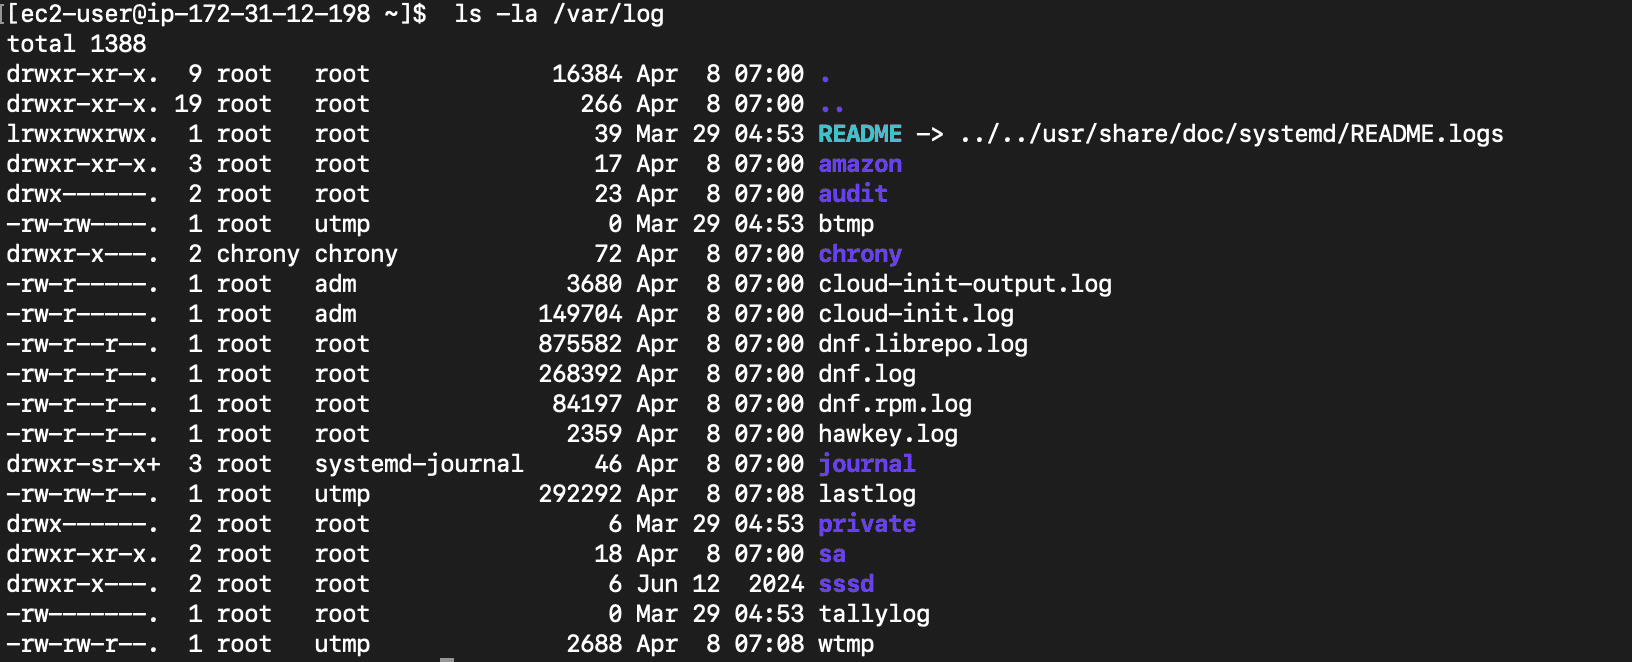
The most important log files and their locations include:
- /var/log/syslog or /var/log/messages: General system events (the primary system log)
- /var/log/auth.log or /var/log/secure: Authentication and security events
- /var/log/kern.log: Kernel messages and hardware-related events
- /var/log/dmesg: Boot-time messages
- /var/log/cron: Scheduled task (cron job) logs
- /var/log/faillog: Failed login attempts
- /var/log/[application]: Application-specific logs (e.g., Apache, MySQL)
Note: Log file locations may vary slightly between different Linux distributions. For example, CentOS and RHEL use
/var/log/messageswhile Ubuntu and Debian use/var/log/syslog.
Running ls -la /var/log shows you all available logs:
Each log entry typically contains:
- Timestamp: When the event occurred
- Hostname: Which system generated the event
- Application/service name: What generated the event
- Process ID (PID): Which process wrote the log
- Message: The actual event details
Here's a sample log entry from syslog:
Apr 15 14:23:01 ubuntu-server systemd[1]: Started Daily apt download activities.
Modern Linux distributions use one of two main logging systems:
- Traditional Syslog: Text-based log files managed by rsyslog or syslog-ng daemons
- Systemd Journal: Binary structured logs managed by systemd-journald, accessed via the
journalctlcommand
Important: Understanding your Linux distribution's logging system is crucial for effective monitoring. Most modern distributions use systemd and journald, but many still maintain traditional syslog files for compatibility.
Linux Performance Metrics
Beyond logs, Linux provides detailed performance metrics through various interfaces:
- CPU Usage: User time, system time, idle time, and load averages
- Memory: Used/free memory, swap usage, and buffer/cache statistics
- Disk I/O: Read/write operations, throughput, and utilization
- Network: Bytes sent/received, packet statistics, and connection states
- Process Metrics: Resource usage by individual processes
Monitoring these metrics helps identify performance bottlenecks, capacity issues, and resource constraints before they impact users.
Setting Up Linux Monitoring with OpenObserve
OpenObserve offers two powerful approaches for Linux monitoring:
- OpenObserve Agent: A streamlined, all-in-one solution for quick deployment
- OpenTelemetry Collector: A customizable approach for advanced configurations
Let's explore both options, starting with the recommended and simplest approach.
Option 1: Using the OpenObserve Agent (Recommended)
The OpenObserve agent provides a simple, one-command installation that automatically collects both Linux system logs and performance metrics.
Prerequisites
Before we begin, ensure you have:
- A Linux machine (Ubuntu, Debian, CentOS, RHEL, etc.)
- Root or sudo access to install and configure services
- Access to an OpenObserve instance (cloud or self-hosted)
Installation
To install the OpenObserve agent:
- Log in to your OpenObserve instance
- Navigate to Data Sources → Recommended → Linux
- Copy the provided bash command
- Open a terminal and execute the command:
curl -O https://raw.githubusercontent.com/openobserve/agents/main/linux/install.sh && chmod +x install.sh && sudo ./install.sh https://your-openobserve-instance.com/api/default/ YOUR_API_KEY
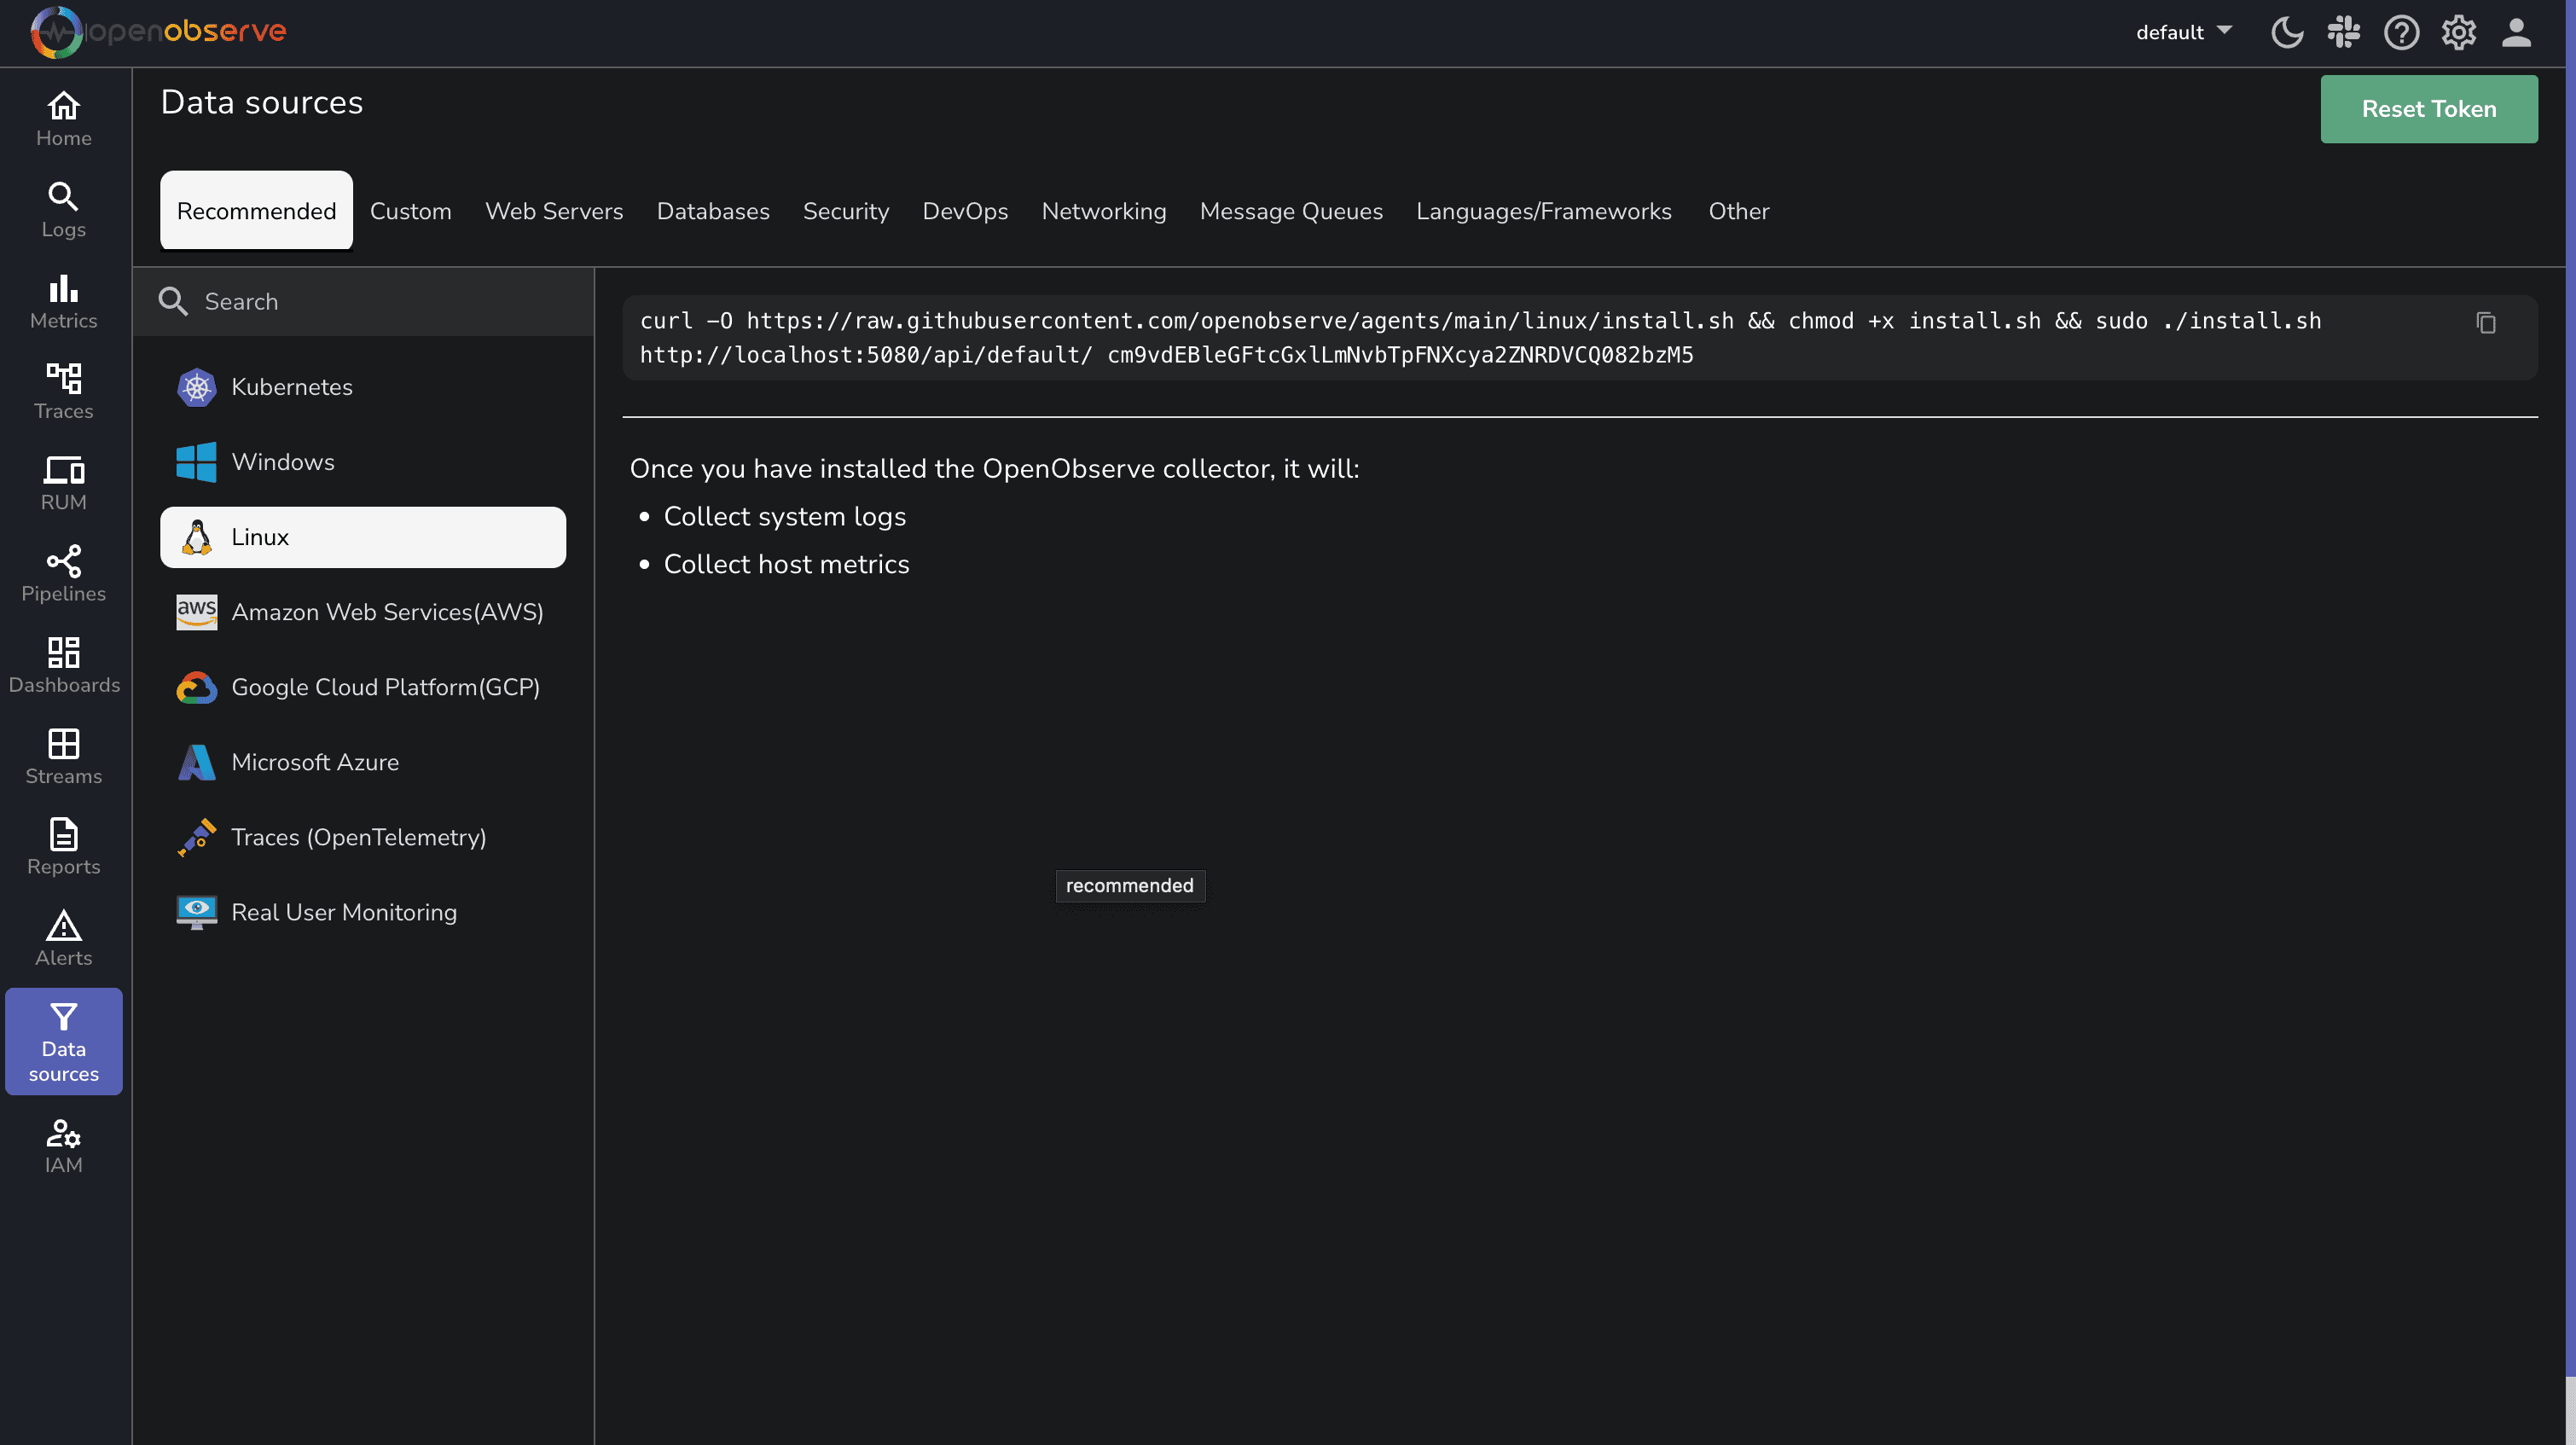
The command will automatically be populated with your specific OpenObserve endpoint and API key from the UI, so you can simply copy and paste it.
That's it! The agent will automatically:
- Install as a systemd service that starts automatically
- Collect system logs from journald or syslog
- Collect host metrics (CPU, memory, disk, network)
- Forward all data to your OpenObserve instance
What's Being Collected
The OpenObserve agent collects:
System Logs:
- Journald logs (on systemd-based distributions)
- Syslog (on traditional syslog-based systems)
- Authentication events
- Kernel messages
Performance Metrics:
- CPU usage (total and per core)
- Memory usage and availability
- Disk I/O and space utilization
- Network traffic and errors
- Process-level metrics
Note: The agent automatically detects your Linux distribution and configures itself accordingly, making it work seamlessly across different environments.
Option 2: Using the OpenTelemetry Collector
For more advanced configurations or if you're already using OpenTelemetry in your environment, you can use the OpenTelemetry Collector with the appropriate receivers.
Step 1: Setting Up the OpenTelemetry Collector
First, let's set up the OpenTelemetry Collector:
# Create a directory for the collector
sudo mkdir -p /opt/otel-collector
cd /opt/otel-collector

# Download the latest collector contrib distribution
curl -L https://github.com/open-telemetry/opentelemetry-collector-releases/releases/download/v0.115.0/otelcol-contrib_0.115.0_linux_amd64.tar.gz -o otelcol-contrib.tar.gz

# Extract the archive
tar -xzf otelcol-contrib.tar.gz
Important: Always check for the latest version of the OpenTelemetry Collector on the official releases page.
Step 2: Configure the OpenTelemetry Collector
Create a file named config.yaml in the /opt/otel-collector directory with the following content:
receivers:
  filelog:
    include:
      - /var/log/syslog
      - /var/log/auth.log
      - /var/log/kern.log
      - /var/log/messages
      - /var/log/secure
    start_at: end
    include_file_path: true
    include_file_name: true
    operators:
      - type: regex_parser
        regex: '^(?P<time>[A-Z][a-z]{2}\s+\d{1,2}\s+\d{2}:\d{2}:\d{2})\s+(?P<host>[^\s]+)\s+(?P<service>[^\s\[]+)(\[(?P<pid>\d+)\])?:\s+(?P<message>.*)$'
        timestamp:
          parse_from: time
          layout: Jan 02 15:04:05

  hostmetrics:
    collection_interval: 30s
    scrapers:
      cpu:
        metrics:
          system.cpu.utilization:
            enabled: true
      memory:
        metrics:
          system.memory.utilization:
            enabled: true
      disk:
      filesystem:
      network:
      load:
      paging:
      process:
        mute_process_name_error: true
        metrics:
          process.cpu.utilization:
            enabled: true
          process.memory.utilization:
            enabled: true

processors:
  batch:
    send_batch_size: 1024
    timeout: 10s
  resourcedetection:
    detectors: [system, env]
    system:
      hostname_sources: ["os"]

exporters:
  otlphttp/openobserve:
    endpoint: "https://your-openobserve-instance.com/api/default"
    headers:
      Authorization: "Basic YOUR_API_KEY"
      stream-name: "linux-logs"
  debug:
    verbosity: detailed

service:
  pipelines:
    logs:
      receivers: [filelog]
      processors: [resourcedetection, batch]
      exporters: [otlphttp/openobserve, debug]
    metrics:
      receivers: [hostmetrics]
      processors: [resourcedetection, batch]
      exporters: [otlphttp/openobserve, debug]
  telemetry:
    logs:
      level: "info"
Replace
https://your-openobserve-instance.com/api/defaultwith your OpenObserve endpoint andYOUR_API_KEYwith your actual API key.
Step 3: Run the OpenTelemetry Collector
Run the collector using the following command:
sudo ./otelcol-contrib --config config.yaml
Advanced Configuration Options
Here are some essential configurations to enhance your Linux monitoring:
Security-Focused Monitoring
For enhanced security monitoring:
filelog:
  include:
    - /var/log/auth.log
    - /var/log/secure
    - /var/log/audit/audit.log
  operators:
    # For SSH authentication events
    - type: router
      routes:
        - expr: 'includes(file.name, "auth.log") or includes(file.name, "secure")'
          output: auth-parser
    - type: regex_parser
      id: auth-parser
      regex: '(?P<time>[A-Z][a-z]{2}\s+\d{1,2}\s+\d{2}:\d{2}:\d{2})\s+(?P<host>[^\s]+)\s+sshd\[(?P<pid>\d+)\]:\s+(?P<message>.*)'
      timestamp:
        parse_from: time
        layout: Jan 02 15:04:05
This configuration focuses on authentication logs to help detect unauthorized access attempts and potential security breaches.
Using Journald Receiver
If you prefer to collect logs directly from journald instead of log files:
journald:
  units:
    - ssh.service
    - systemd-logind.service
  priority: info
Important: The journald receiver requires systemd and only works on Linux systems using systemd as their init system.
Troubleshooting
If you encounter issues with your Linux monitoring setup, here are the most common problems and their solutions:
Agent Installation Issues
- Permission Denied: Run the installation command with
sudo - Service Not Starting: Check status with
sudo systemctl status openobserve-agentand look for error messages - Network Issues: Verify connectivity with
curl -v https://your-openobserve-instance.com
Log Collection Issues
- Missing Logs: Check file permissions and ensure the agent has read access to log files
- Journald Access: For systemd-based systems, ensure the agent has proper journal access
- Log Format Problems: If logs appear malformed, check timezone settings and log formats
Metrics Collection Issues
- Missing Metrics: Verify the agent has permissions to access system metrics
- Performance Impact: If the agent uses too many resources, adjust collection intervals
OpenTelemetry Collector Issues
- Configuration Errors: Validate your config.yaml syntax and check collector logs
- Export Failures: Verify your endpoint URL and API key are correct
- Resource Constraints: Adjust batch settings if the collector terminates unexpectedly
For detailed troubleshooting, check the agent logs in the console.
Visualizing Linux Monitoring Data in OpenObserve
Once your data is flowing into OpenObserve, you can view and analyze it through the intuitive interface.
Exploring Linux System Logs
Navigate to the Logs Page:
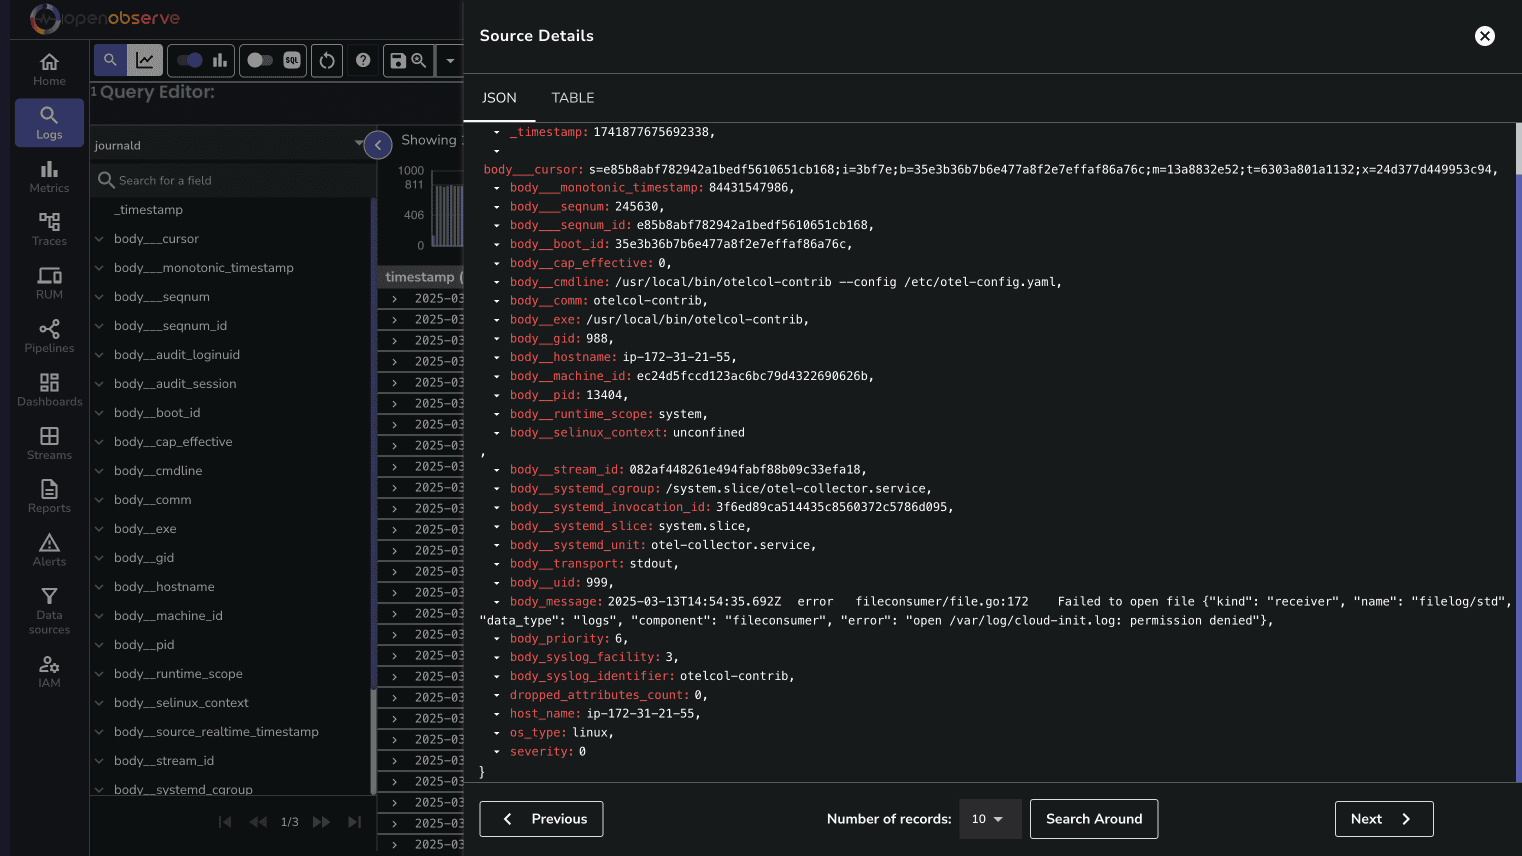
You can filter logs by severity, service, or any other field to focus on specific events.
Analyzing Performance Metrics
The Metrics page allows you to visualize and analyze system performance metrics:
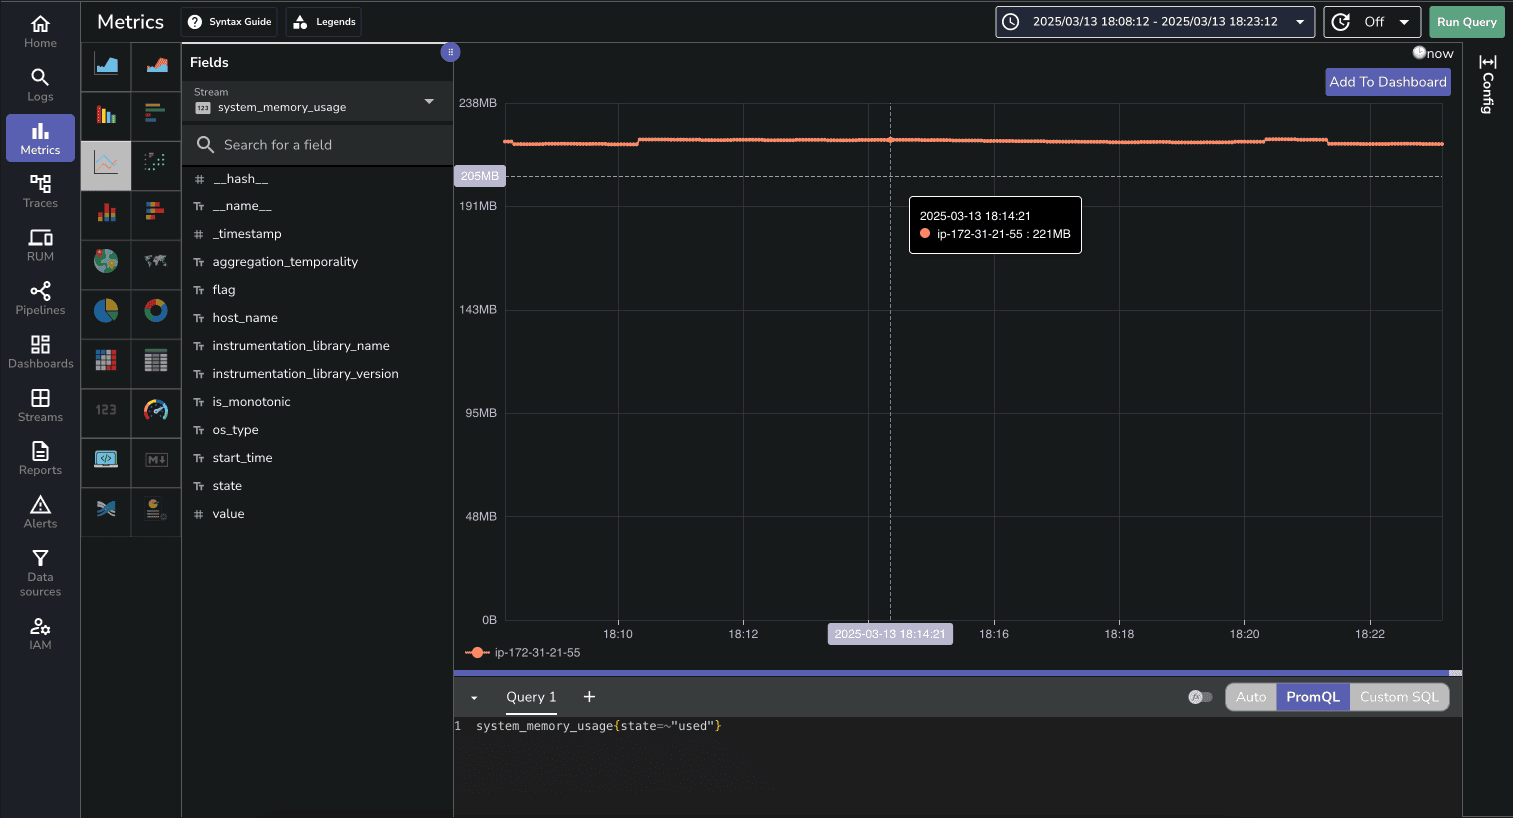
You can create custom charts to track CPU usage, memory consumption, disk I/O, and network activity over time.
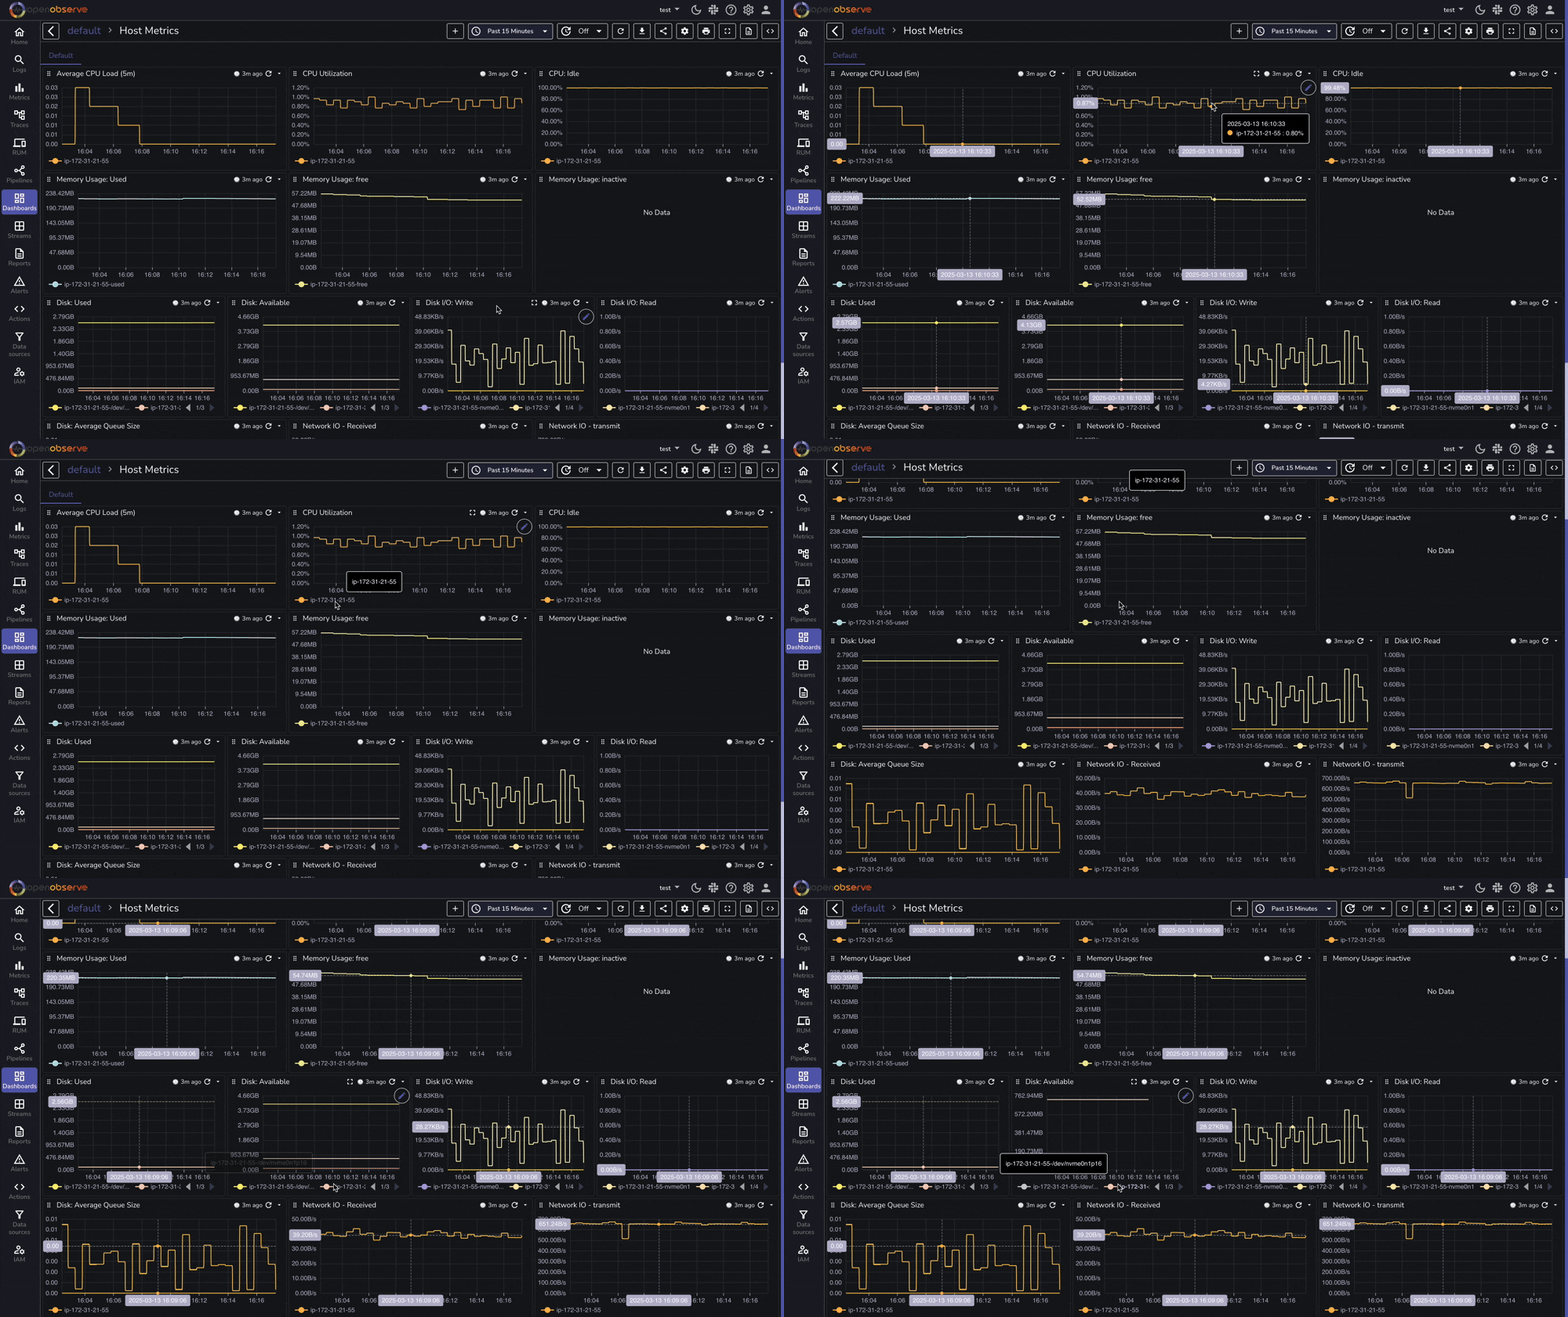
Pre-built Dashboard
OpenObserve provides a pre-built dashboard for Linux Host Metrics that you can import directly:
Conclusion
Effective Linux monitoring is essential for maintaining reliable, secure, and high-performing systems. With OpenObserve, you now have a powerful platform for collecting, analyzing, and visualizing your Linux logs and metrics.
By following this guide, you've set up comprehensive monitoring that provides deep visibility into your Linux environment. The combination of system logs and performance metrics gives you a complete picture of your systems' health and behavior.
To maximize the value of your monitoring setup:
- Implement log rotation to prevent logs from consuming too much disk space
- Correlate logs with metrics to quickly identify the root cause of issues
- Enhance security monitoring by tracking privileged commands and critical file changes
- Configure appropriate retention periods to meet compliance requirements
Whether you're managing a single server or a large fleet of Linux machines, this monitoring approach scales with your needs while providing the insights required for effective system administration.
For more information and advanced configurations, check out the OpenObserve documentation and start transforming your Linux monitoring today.
Happy monitoring! 🚀
About the Author
Manas Sharma


Manas is a passionate Dev and Cloud Advocate with a strong focus on cloud-native technologies, including observability, cloud, kubernetes, and opensource. building bridges between tech and community.
Follow OpenObserve on Google
Add OpenObserve as a preferred source to see more of our articles in Google Search and Top Stories.













