Monitoring OpenObserve: From Infrastructure Health to Internal Metrics




Ready to get started?
Try OpenObserve Cloud today for more efficient and performant observability.
Introduction
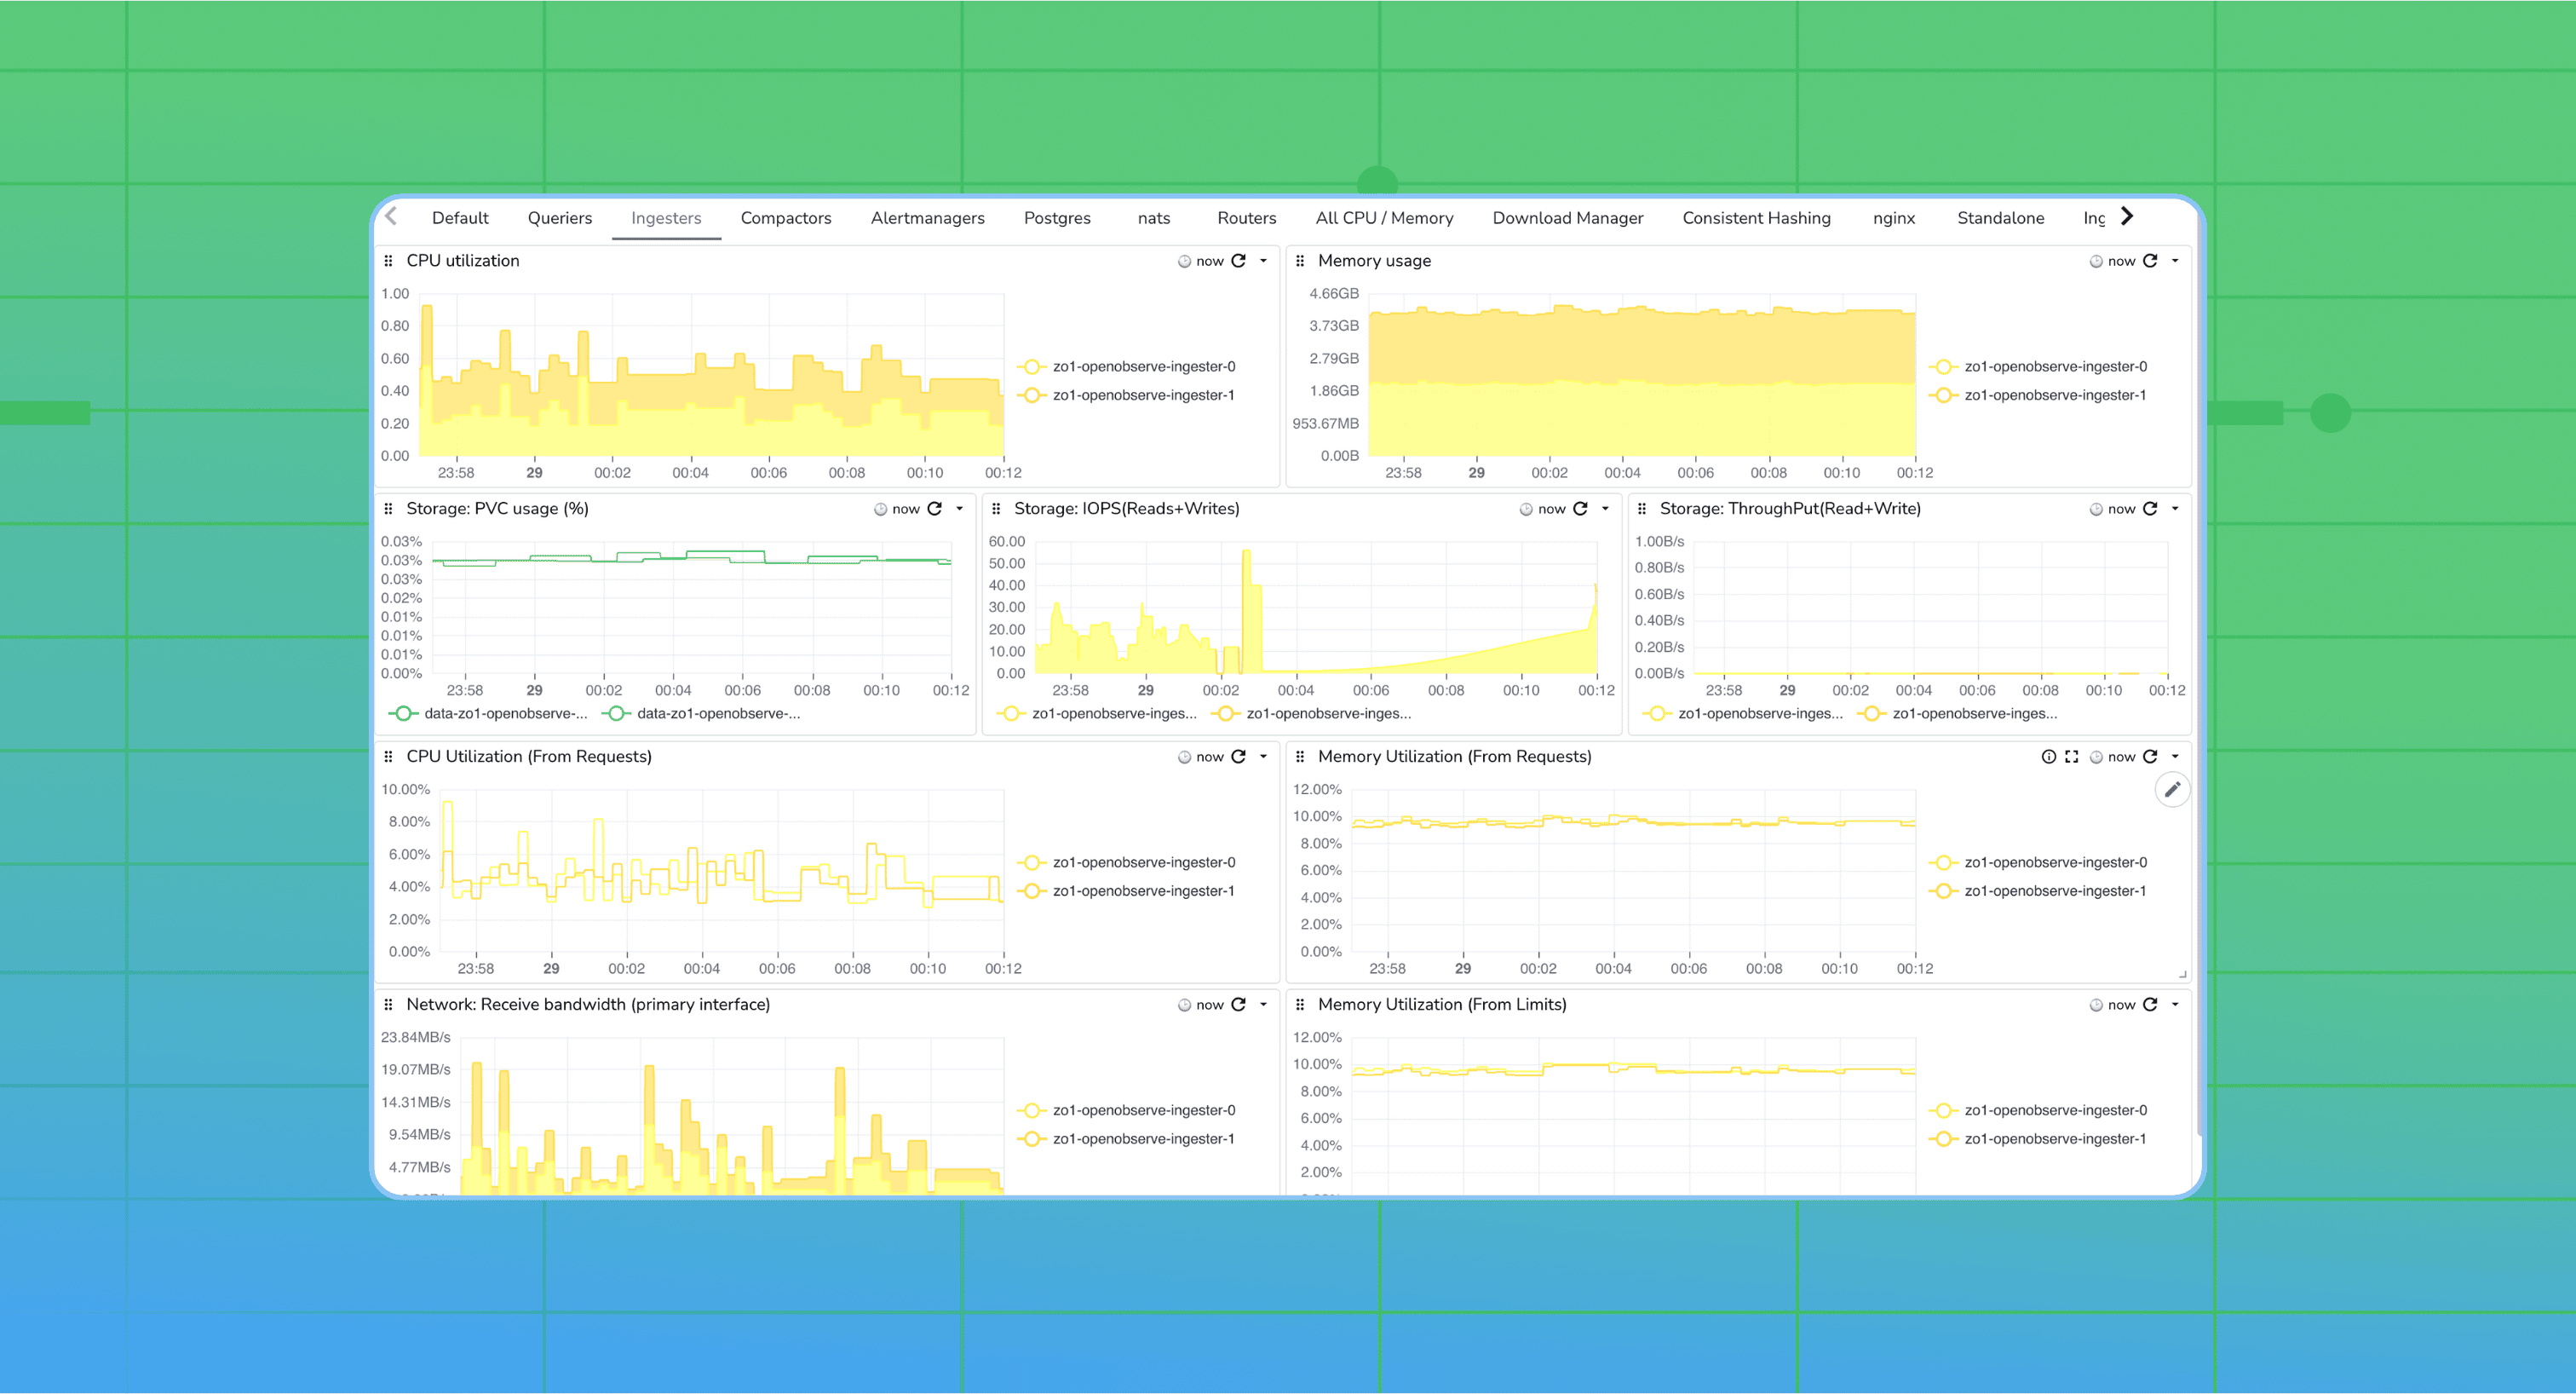
Monitoring is at the core of running reliable and performant systems and OpenObserve (O2) is no exception. Whether you’re running O2 as a single node or a multi-node cluster in Kubernetes, tracking both infrastructure-level health metrics and internal OpenObserve metrics ensures optimal performance and quick root cause analysis.
OpenObserve exposes Prometheus-compatible metrics that provide deep visibility into ingestion, querying, and storage processes. However, system-level monitoring (CPU, memory, disk, and network) forms the foundation of any healthy observability stack.
In this blog, we’ll cover both aspects:
- How to monitor system and infrastructure health
- How to collect OpenObserve’s internal metrics from the /metrics endpoint
- How to visualize these metrics inside OpenObserve using the OpenTelemetry Collector
Monitoring OpenObserve Infrastructure Health
Before diving into OpenObserve’s internal telemetry, it’s essential to establish baseline monitoring for the systems and environments hosting it.
System Metrics
Metrics such as CPU usage, memory utilization, disk consumption, and network throughput are essential to ensure that OpenObserve nodes (ingesters, queriers, compactors, etc.) are healthy and not resource constrained. These metrics are typically gathered using exporters like node_exporter, kube-state-metrics, or cAdvisor.
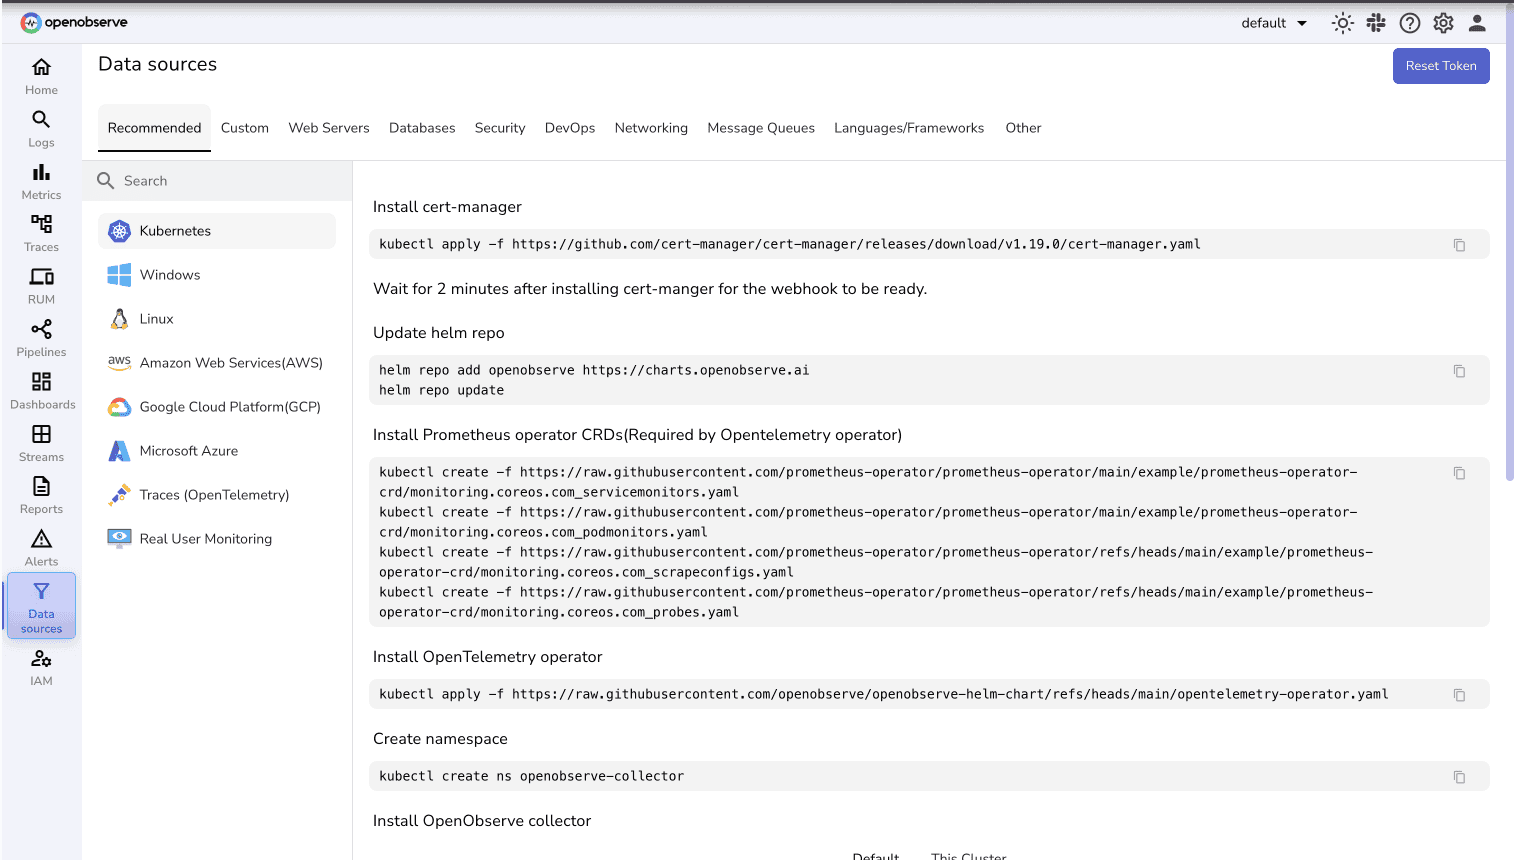
For users running O2 in Kubernetes or Linux environments, deploying the OpenObserve Collector is the easiest way to get started.
The O2 Collector is a pre-packaged OpenTelemetry Collector that comes with built-in receivers for common system-level metrics sources.
You can find setup instructions for the O2 Collector under the Datasources UI in OpenObserve.
Example: Network Bandwidth Monitoring for Queriers
Once system metrics are flowing into OpenObserve, you can query and visualize them using familiar PromQL-style syntax. For instance, to monitor network receive bandwidth for queriers:
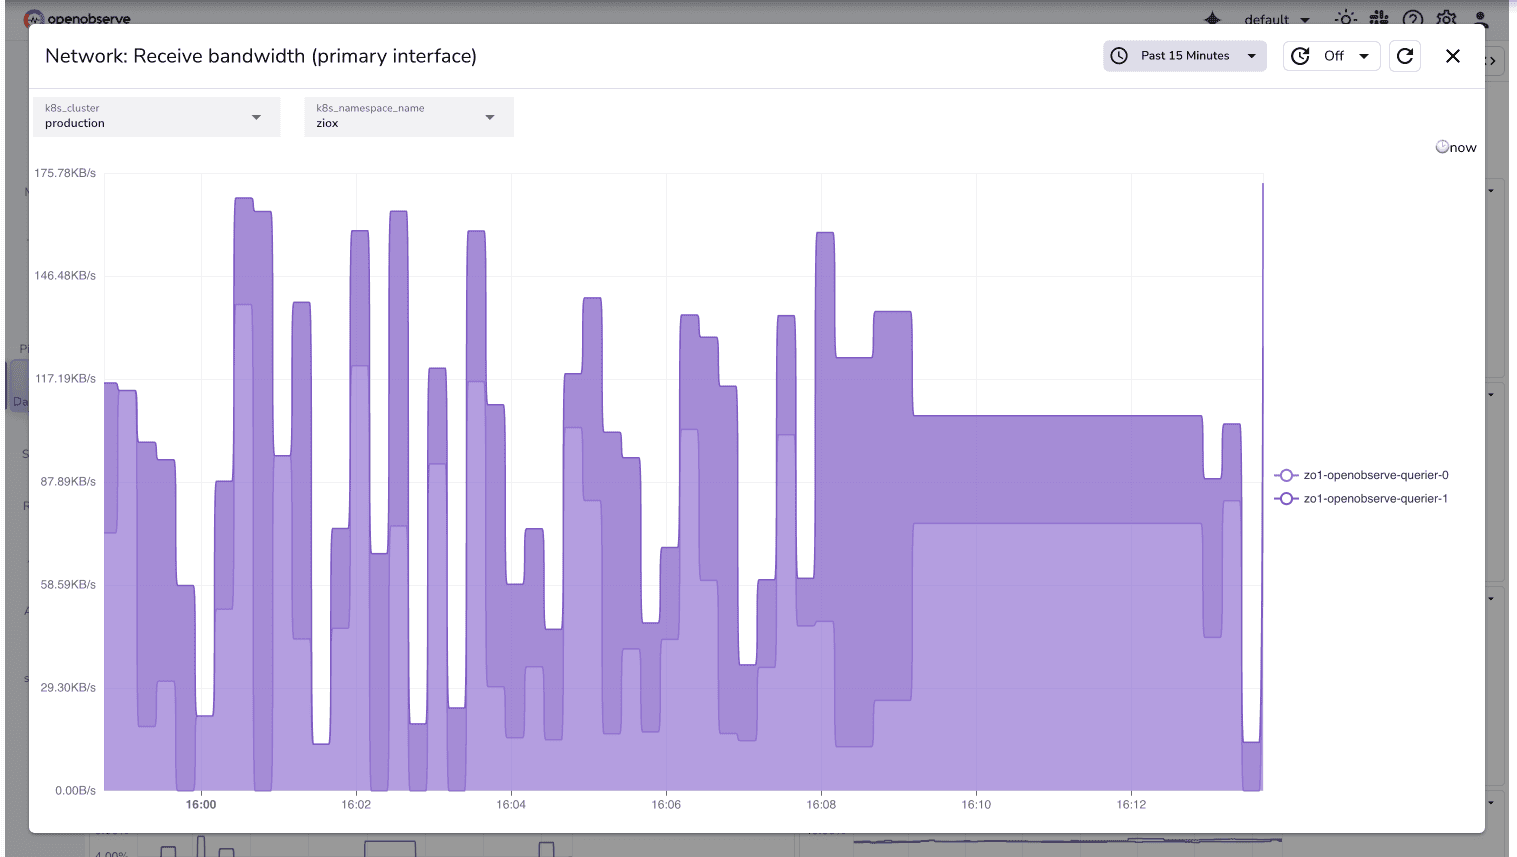
This query helps identify if your querier nodes are experiencing high inbound network load.
irate(k8s_pod_network_io{
  direction="receive",
  k8s_cluster="$k8s_cluster",
  k8s_namespace_name="$k8s_namespace_name",
  k8s_pod_name=~".*querier.*"
}[5m])
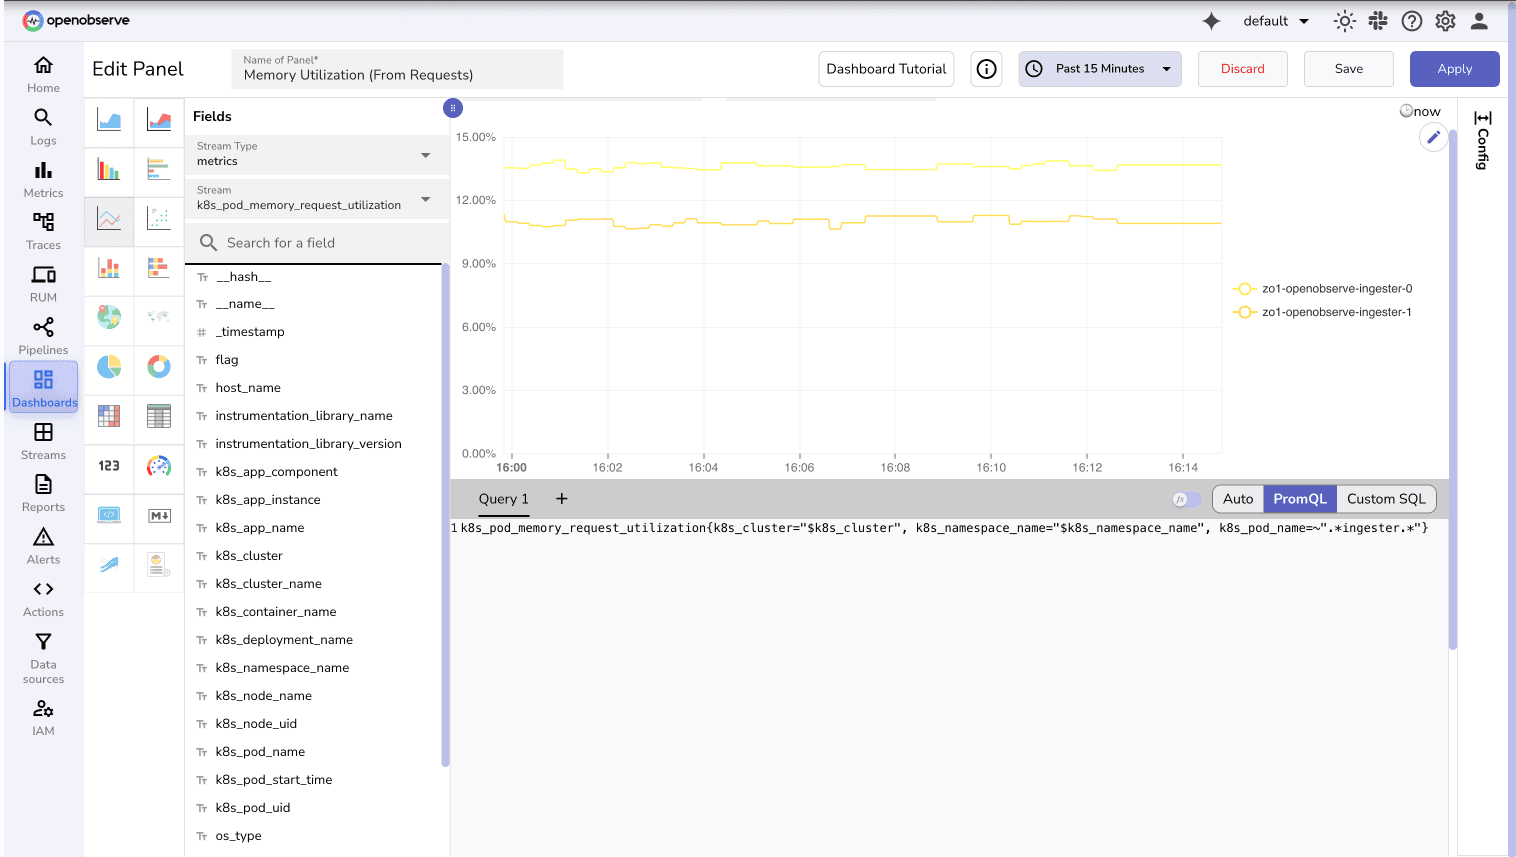
Similar queries can be created for CPU, memory, and disk usage for different OpenObserve components.
Ex: Memory Utilization (From Requests) for Ingester pods
k8s_pod_memory_request_utilization{k8s_cluster="$k8s_cluster", k8s_namespace_name="$k8s_namespace_name", k8s_pod_name=~".*ingester.*"}
Understanding OpenObserve Internal Metrics
After establishing system monitoring, the next step is to collect OpenObserve’s internal metrics which provide detailed insights into ingestion, query performance, WAL usage, compaction, and more.
These are exposed in Prometheus format at the /metrics endpoint on every OpenObserve instance.
These metrics help you track ingestion throughput, query cache performance, WAL behavior, and other internal health indicators.
Key Metrics Overview
Below are a few representative metrics from OpenObserve’s /metrics endpoint:
| Component | Metric Name | Type | Description |
| http | http_incoming_requests | Counter | Counts total incoming HTTP requests by endpoint and status. |
| ingester | ingest_records | Counter | Number of records ingested per stream. |
| ingester | ingest_wal_used_bytes | Gauge | Current Write-Ahead Log size in bytes. |
| querier | query_memory_cache_used_bytes | Gauge | Bytes used in memory cache for queries. |
| compactor | compact_pending_jobs | Gauge | Current pending compaction jobs. |
| storage | storage_write_bytes | Counter | Total bytes written to storage. |
For the complete list of available metrics, refer to the official documentation: OpenObserve Internal Metrics
Step-by-Step: Collecting and Ingesting O2 Internal Metrics
The following steps demonstrate how to collect OpenObserve’s internal metrics and visualize them in your own OpenObserve instance using the OpenTelemetry Collector.
Step 1: Prerequisites
Before you begin, ensure you have:
- OpenObserve instance up and running
- Access to the /metrics endpoint of your O2 nodes
- Basic familiarity with YAML and Prometheus configuration
Step 2: Install the OpenTelemetry Collector
The default OpenTelemetry Collector does not include all receivers for instance, specialized ones like Prometheus or Kafka. Hence, we’ll use the OpenTelemetry Collector Contrib build.
- Visit the OpenTelemetry Collector Contrib Releases page.
- Download the latest release for your machine. You can use the following command in your terminal, replacing
v0.115.1with the latest version number:
curl --proto '=https' --tlsv1.2 -fOL https://github.com/open-telemetry/opentelemetry-collector-releases/releases/download/v0.115.1/otelcol-contrib_0.115.1_darwin_arm64.tar.gz
- Unzip the downloaded file:
tar -xvf otelcol-contrib_0.115.1_darwin_arm64.tar.gz
- Move the binary to a directory in your PATH (e.g., /usr/local/bin):
sudo mv otelcol-contrib /usr/local/bin/
- After installation, check the status of the OpenTelemetry Collector:
otelcol-contrib --version
Step 3: Configure the Collector
Create a configuration file named otel-collector-config.yaml.
This file tells the collector how to scrape OpenObserve’s internal metrics and forward them to your OpenObserve instance.
receivers:
  prometheus:
    config:
      scrape_configs:
        - job_name: 'o2-metrics'
          scrape_interval: 5s
          metrics_path: /metrics
          static_configs:
            - targets: ['host:port']

processors:
  batch:
    send_batch_size: 10000
    timeout: 10s

exporters:
  otlphttp/openobserve:
    endpoint: YOUR_API_ENDPOINT
    headers:
      Authorization: Basic  YOUR_AUTH_TOKEN
      stream-name: default

service:
  pipelines:
    metrics:
      receivers: [prometheus]
      processors: [batch]
      exporters: [otlphttp/openobserve]
The targets list should contain host:portpair.
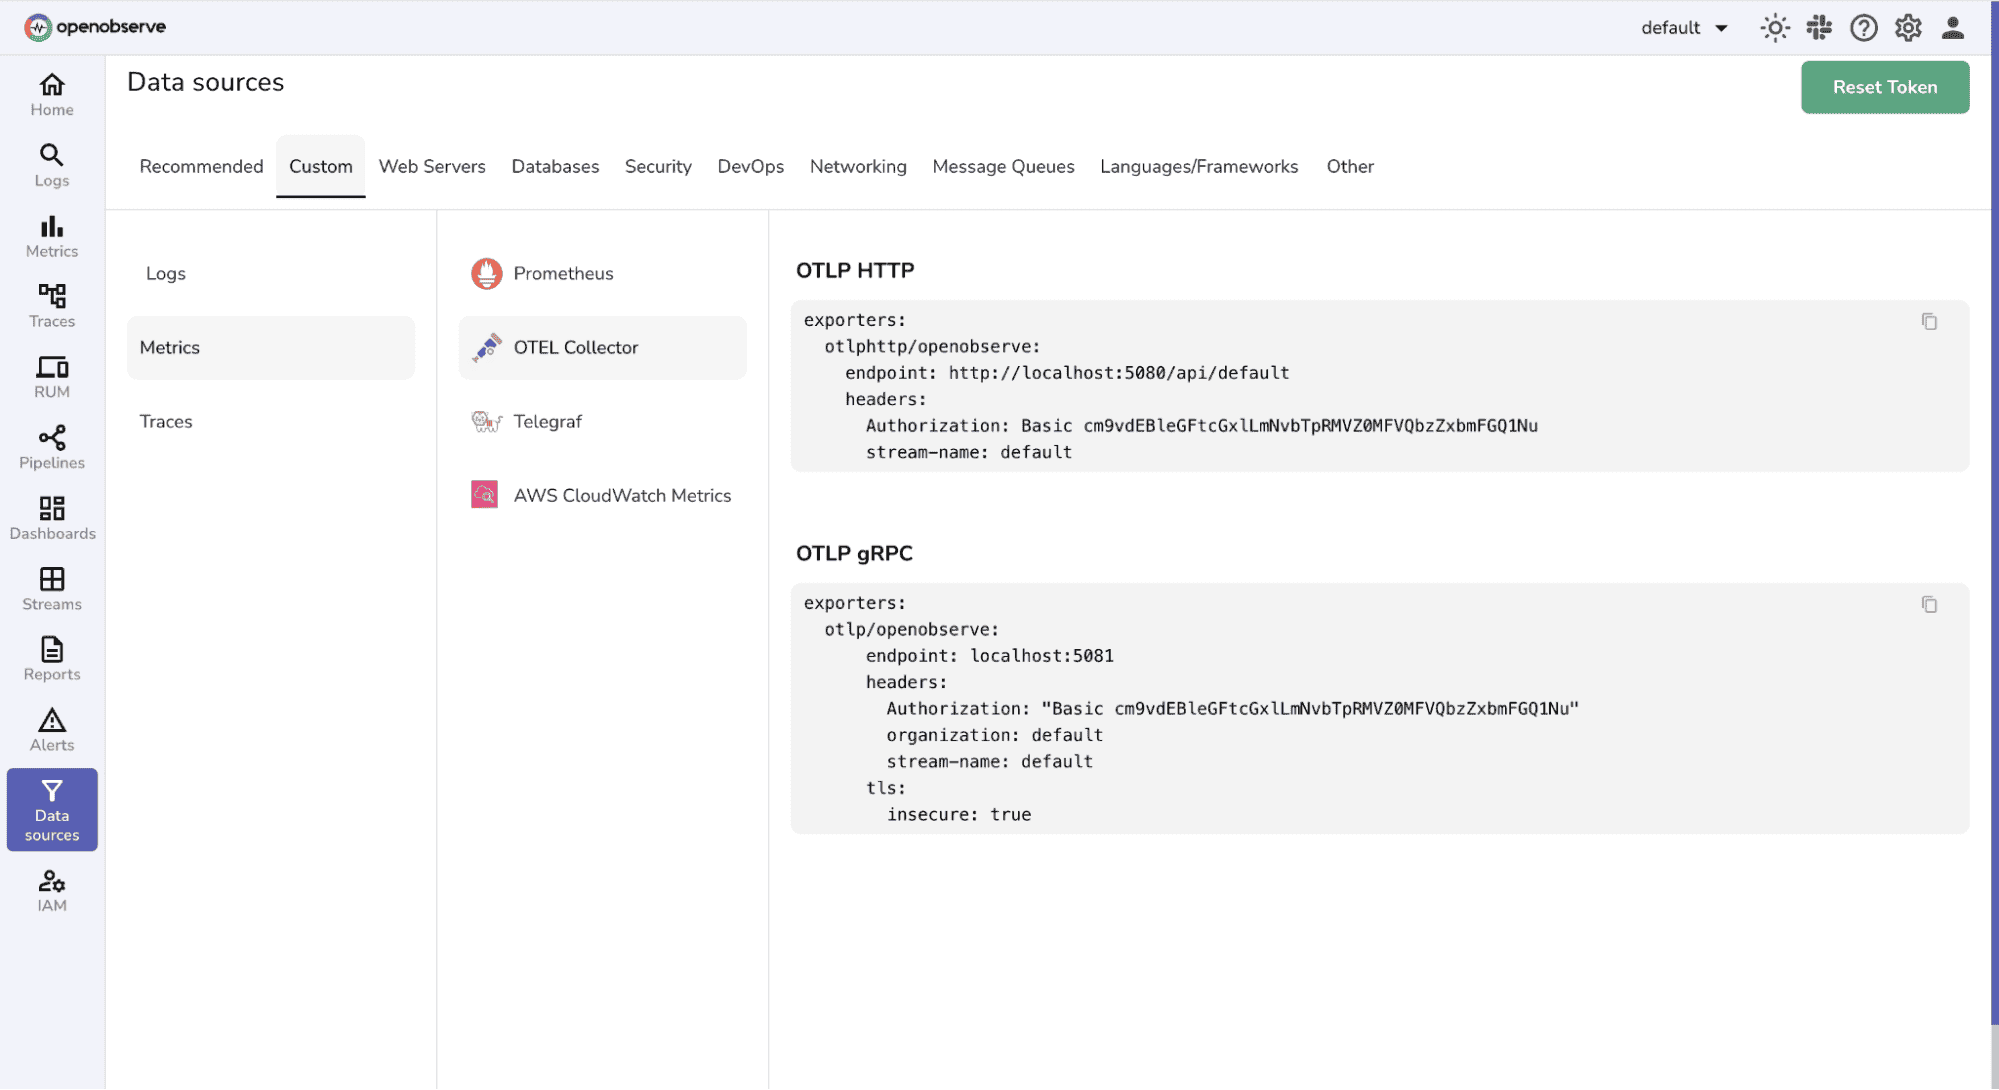
Exporters: Replace YOUR_API_ENDPOINT and YOUR_AUTH_TOKEN with your OpenObserve credentials (find them in your Data Sources -> Custom - > Metrics -> OTEL Collector).
Step 4: Run the OpenTelemetry Collector
otelcol-contrib --config /path/to/your/config.yaml
Once running, it will start scraping metrics from the /metrics endpoint and push them into OpenObserve for visualization.
Step 5: Verify Ingestion
In your OpenObserve UI:
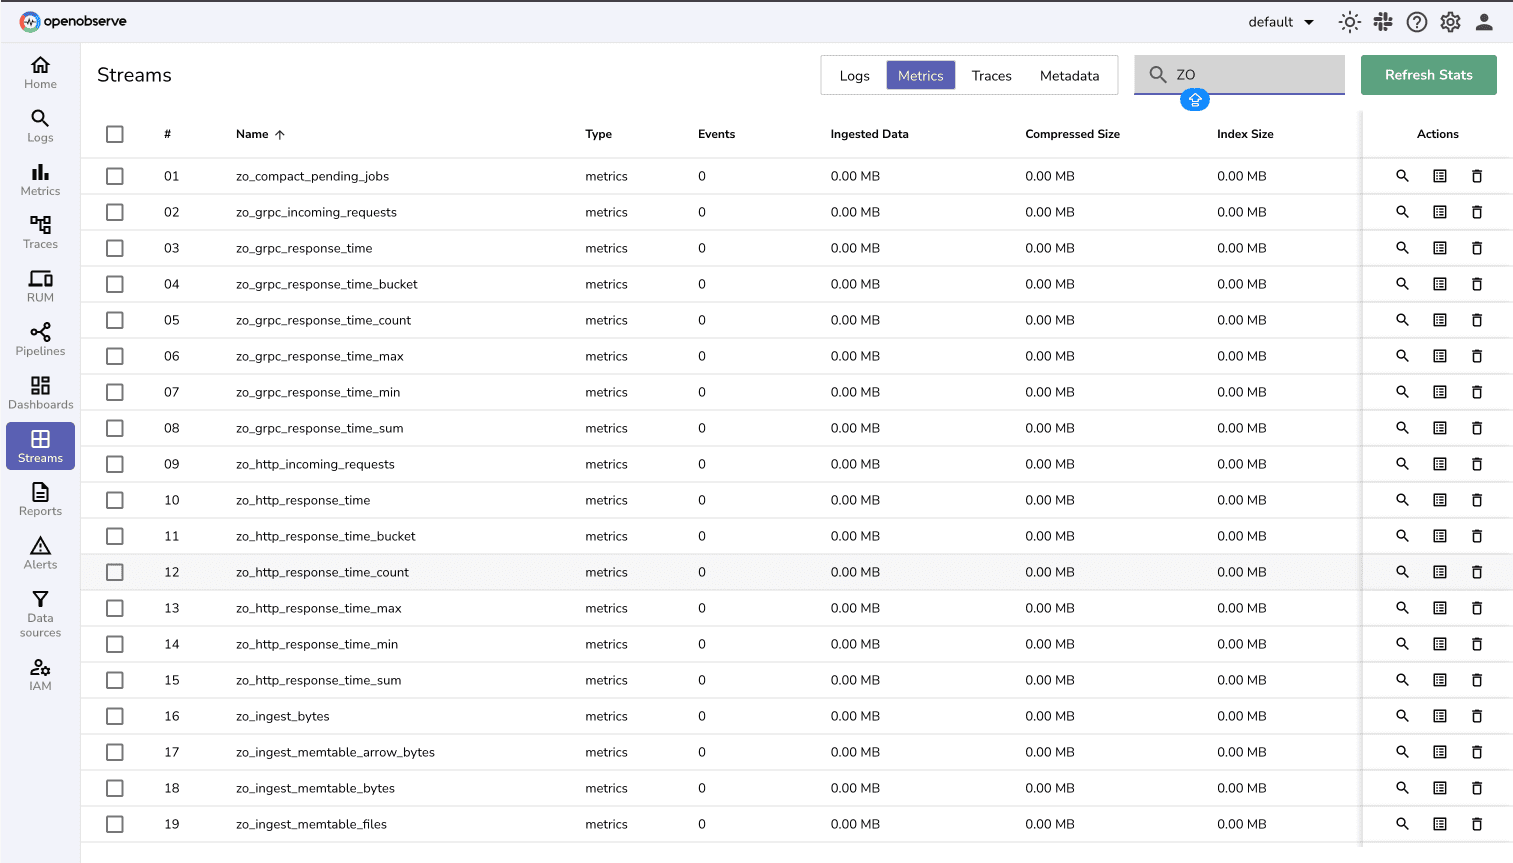
- Navigate to Streams→ Metrics.
- Confirm that the internal metric streams are visible.
- Query for internal metrics (e.g., ingest_records or http_incoming_requests).
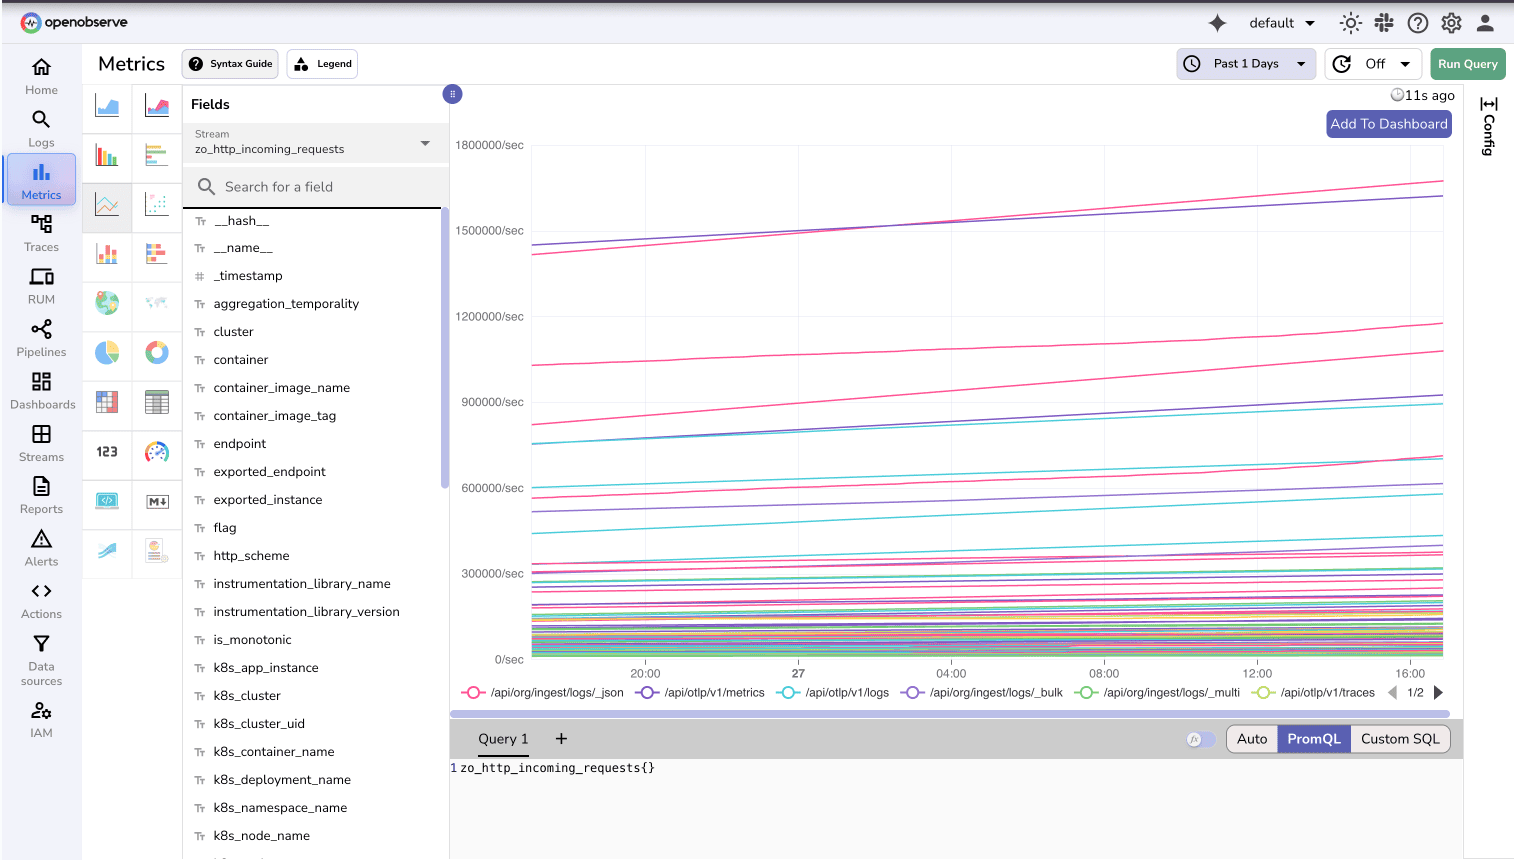
If configured correctly, you should start seeing metrics populate in near real-time.
Troubleshooting Tips
Collector not scraping metrics: Check that the /metrics endpoint is reachable from the host running the collector. Use curl <your-o2-domain/metrics> to verify.
Authentication issues: Ensure the Authorization header in your config file is valid for your O2 instance. You can check it from your OpenObserve UI → Data Sources → Exporter Configuration.
No data in dashboard: Check that both the receiver and exporter pipelines are active in the collector logs. Collector Logs should indicate successful scrapes and exports.
Visualization and Monitoring in OpenObserve
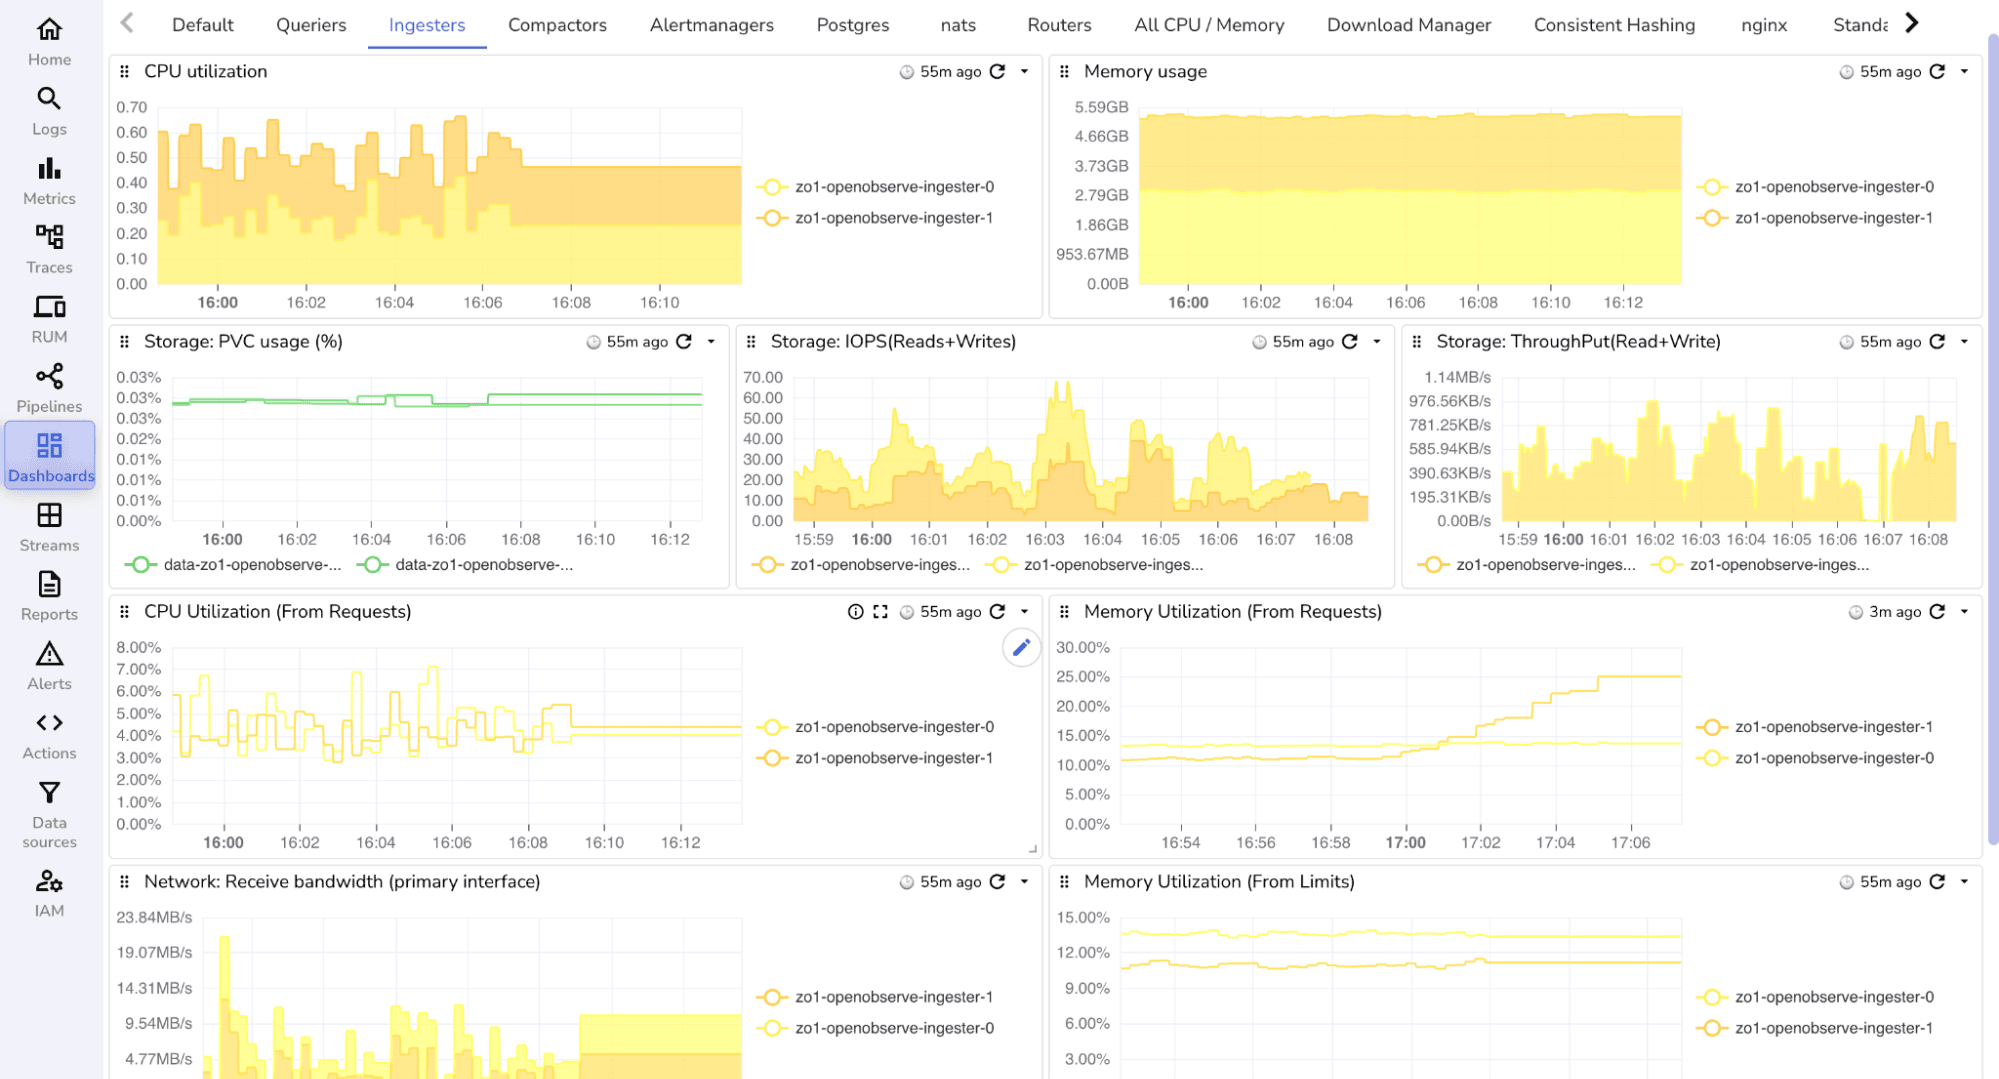
Once your system and internal metrics are being ingested, the next step is to visualize and monitor them effectively within OpenObserve. By combining infrastructure metrics with OpenObserve’s internal telemetry, you can build dashboards that provide end-to-end visibility into your O2 instance performance.
Key Panels for System Metrics
System-level metrics offer critical insights into how your infrastructure behaves under different workloads.
For example, you can track CPU utilization for NATS using the following query:
k8s_pod_cpu_usage{
  k8s_cluster="$k8s_cluster",
  k8s_namespace_name="$k8s_namespace_name",
  k8s_pod_name=~".*nats.*"
}
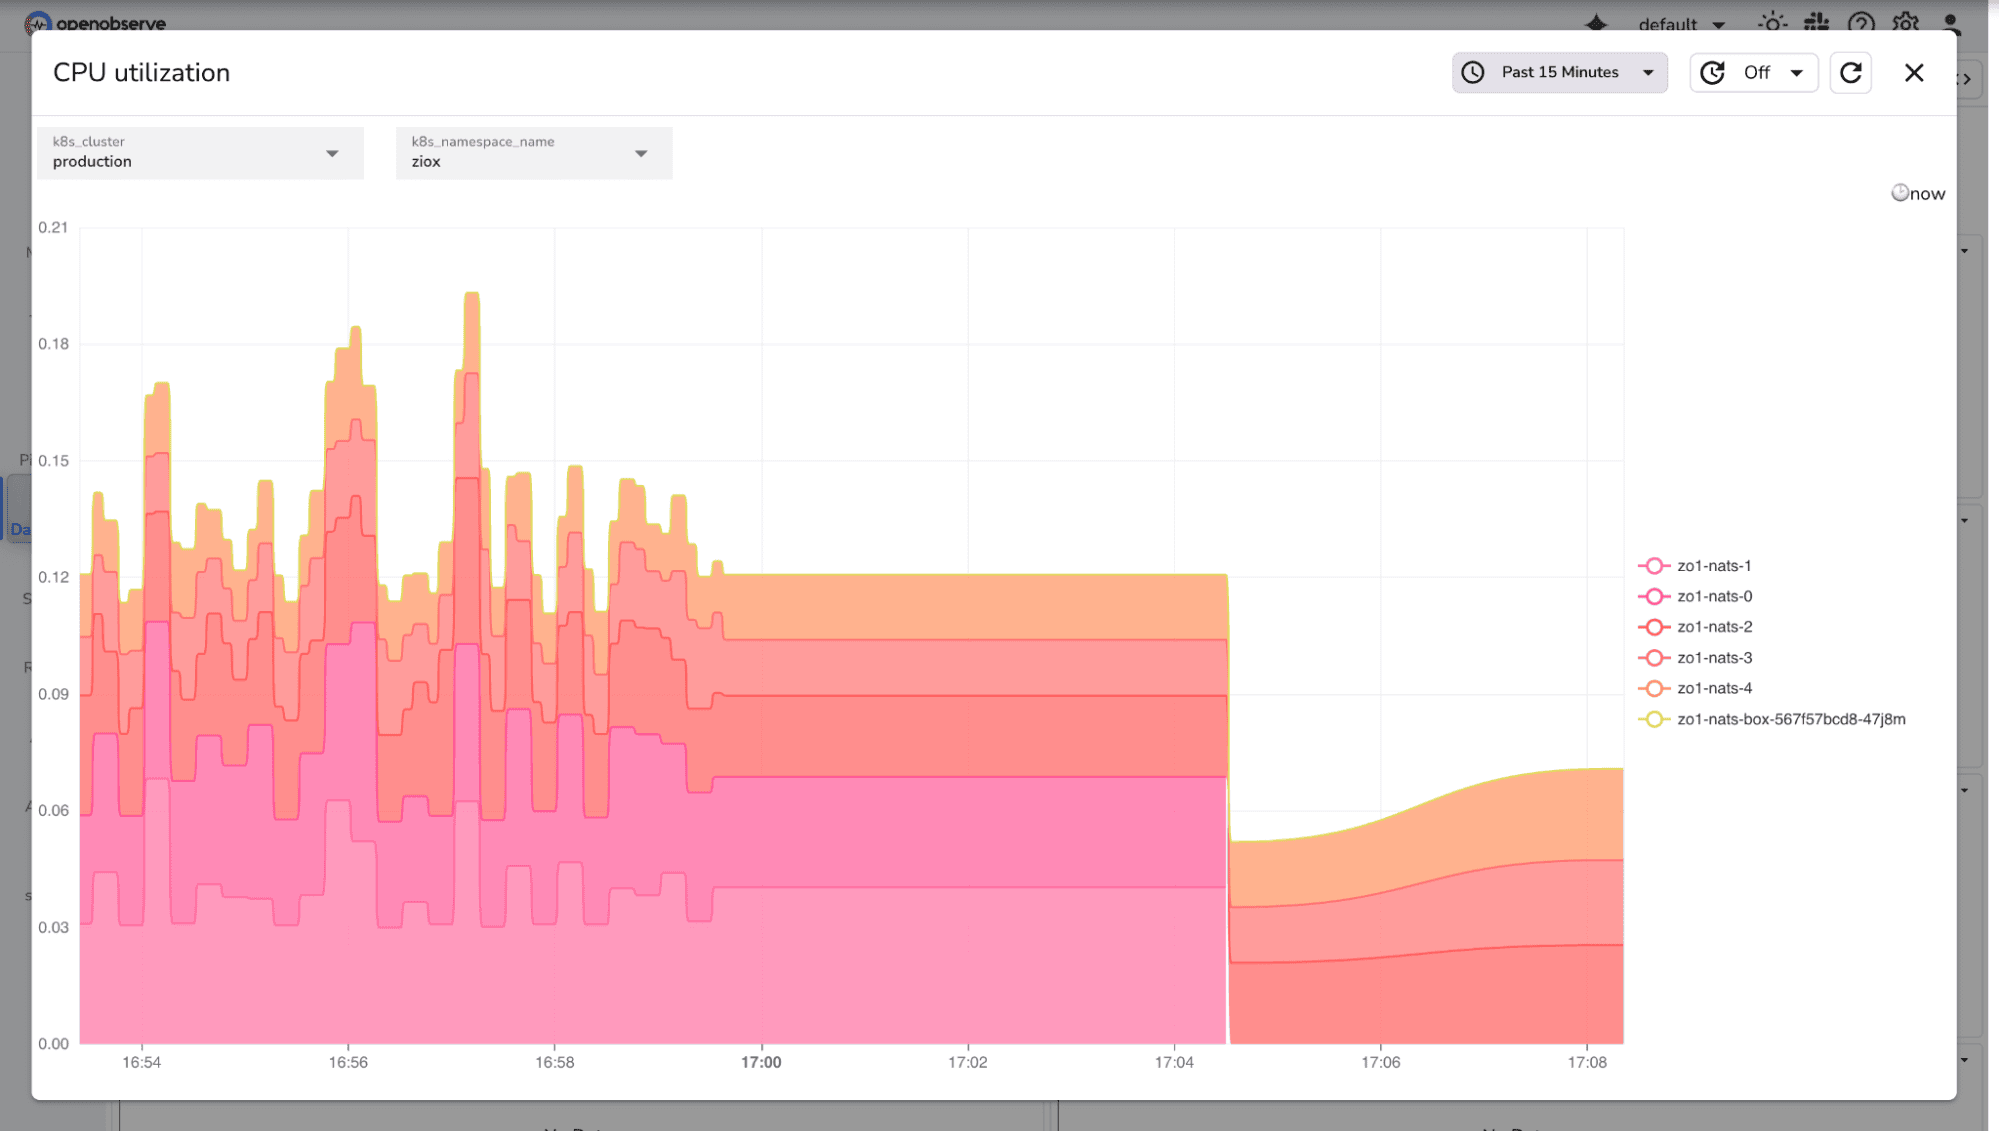
This helps identify if NATS pods which handle internal messaging in OpenObserve are under heavy CPU pressure.
You can extend similar panels to monitor memory usage, disk I/O, and network throughput for ingesters, queriers, and compactors.
Monitoring Node Health in OpenObserve (Enterprise Only)
OpenObserve also provides a dedicated Management view to help monitor node-level health directly from the UI.
In the OpenObserve UI, select the _meta organization and navigate to: Management → Nodes (from the top navigation menu).
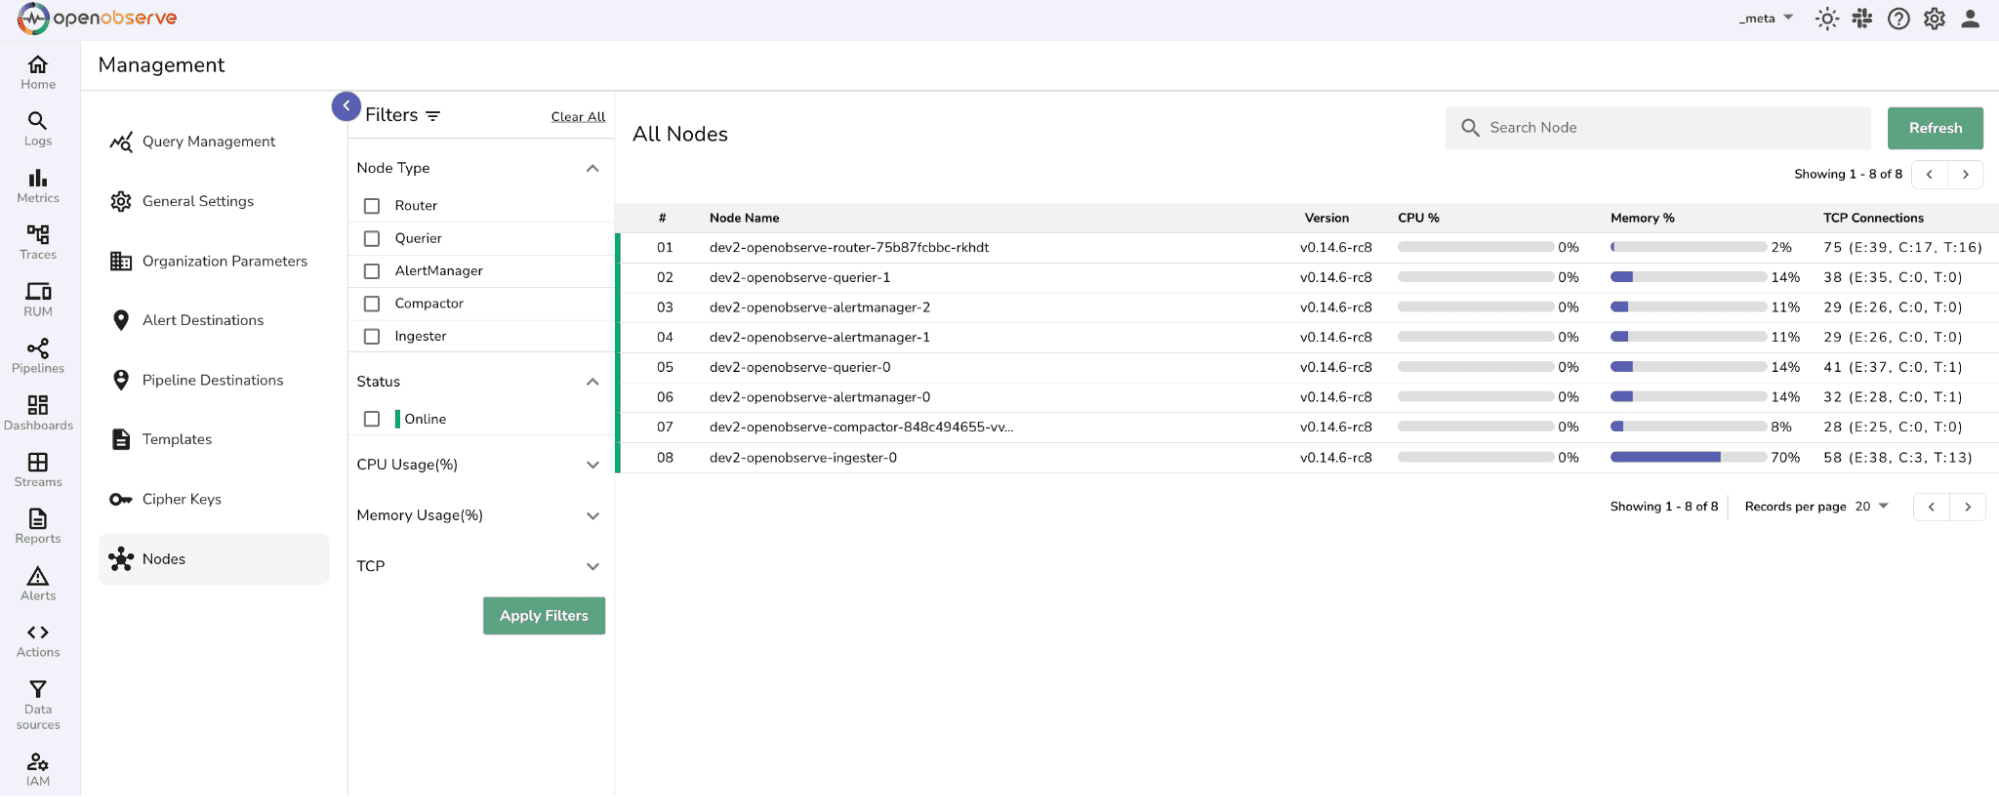
Note: The Nodes feature is available for Enterprise deployments only.
This view helps you assess and troubleshoot the health and performance of each node in your OpenObserve cluster.
Signals to Monitor Node Health
Use the following signals to proactively identify potential issues:
CPU and Memory Usage: Sustained usage above 70% may indicate a need to scale out or investigate workloads on that node. (Optimal thresholds may vary depending on use case.)
Spike in TCP Connections: A sudden rise in
CLOSE_WAITorTIME_WAITconnections can indicate network issues or inefficient connection handling. Investigate application behavior if this persists.Status is Offline: Check your Kubernetes or cloud environment (e.g., AWS, GCP) to troubleshoot or restart affected nodes.
Status Fluctuates: Frequent transitions between online and offline statuses may point to unstable infrastructure or configuration inconsistencies.
To learn more about this feature, refer to the official documentation:Nodes in OpenObserve
Community Dashboards for OpenObserve
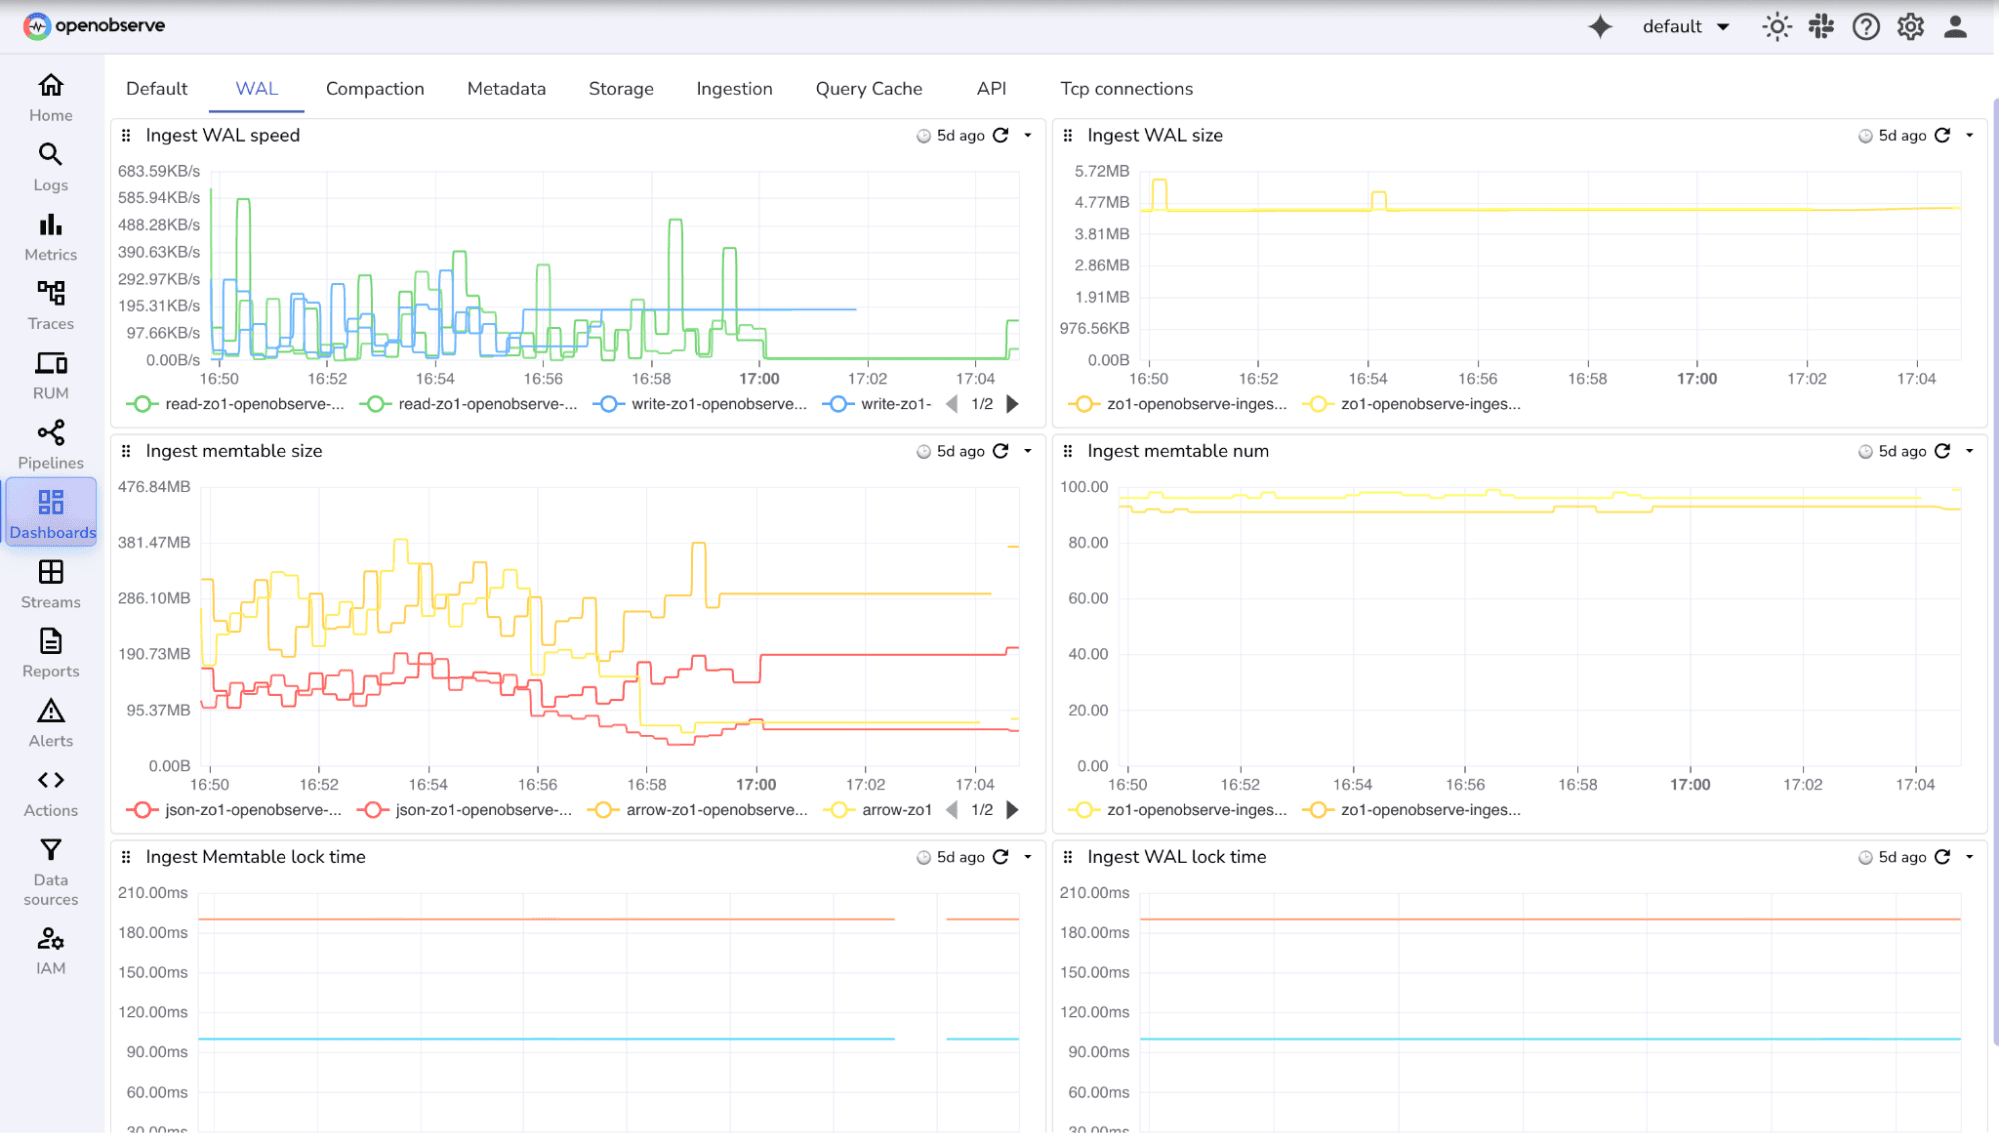
OpenObserve provides a set of community dashboards( ready-to-use dashboards) designed for both infrastructure and internal metrics.
You can browse, download, and import them directly into your OpenObserve instance from our community repository: OpenObserve Community Dashboards
These dashboards include pre-built panels for:
- System-level metrics (CPU, Memory, Disk, Network)
- Ingestion and query performance
- WAL utilization and compaction trends
- Node and cluster health
Conclusion: Next Steps
By combining system health metrics with OpenObserve’s internal metrics, you gain full visibility into performance bottlenecks, ingestion latency, and resource utilization. Monitoring these together ensures proactive capacity planning and stable, predictable behavior at scale.
OpenObserve embodies these principles with its scalable architecture, security features, and support for open standards - making it a practical choice for enterprises.
Ready to put these principles into practice? Sign up for an OpenObserve Cloud account (14-day free trial) or visit our downloads page to self-host OpenObserve.
References:
About the Author
Manas Sharma


Manas is a passionate Dev and Cloud Advocate with a strong focus on cloud-native technologies, including observability, cloud, kubernetes, and opensource. building bridges between tech and community.
Follow OpenObserve on Google
Add OpenObserve as a preferred source to see more of our articles in Google Search and Top Stories.













