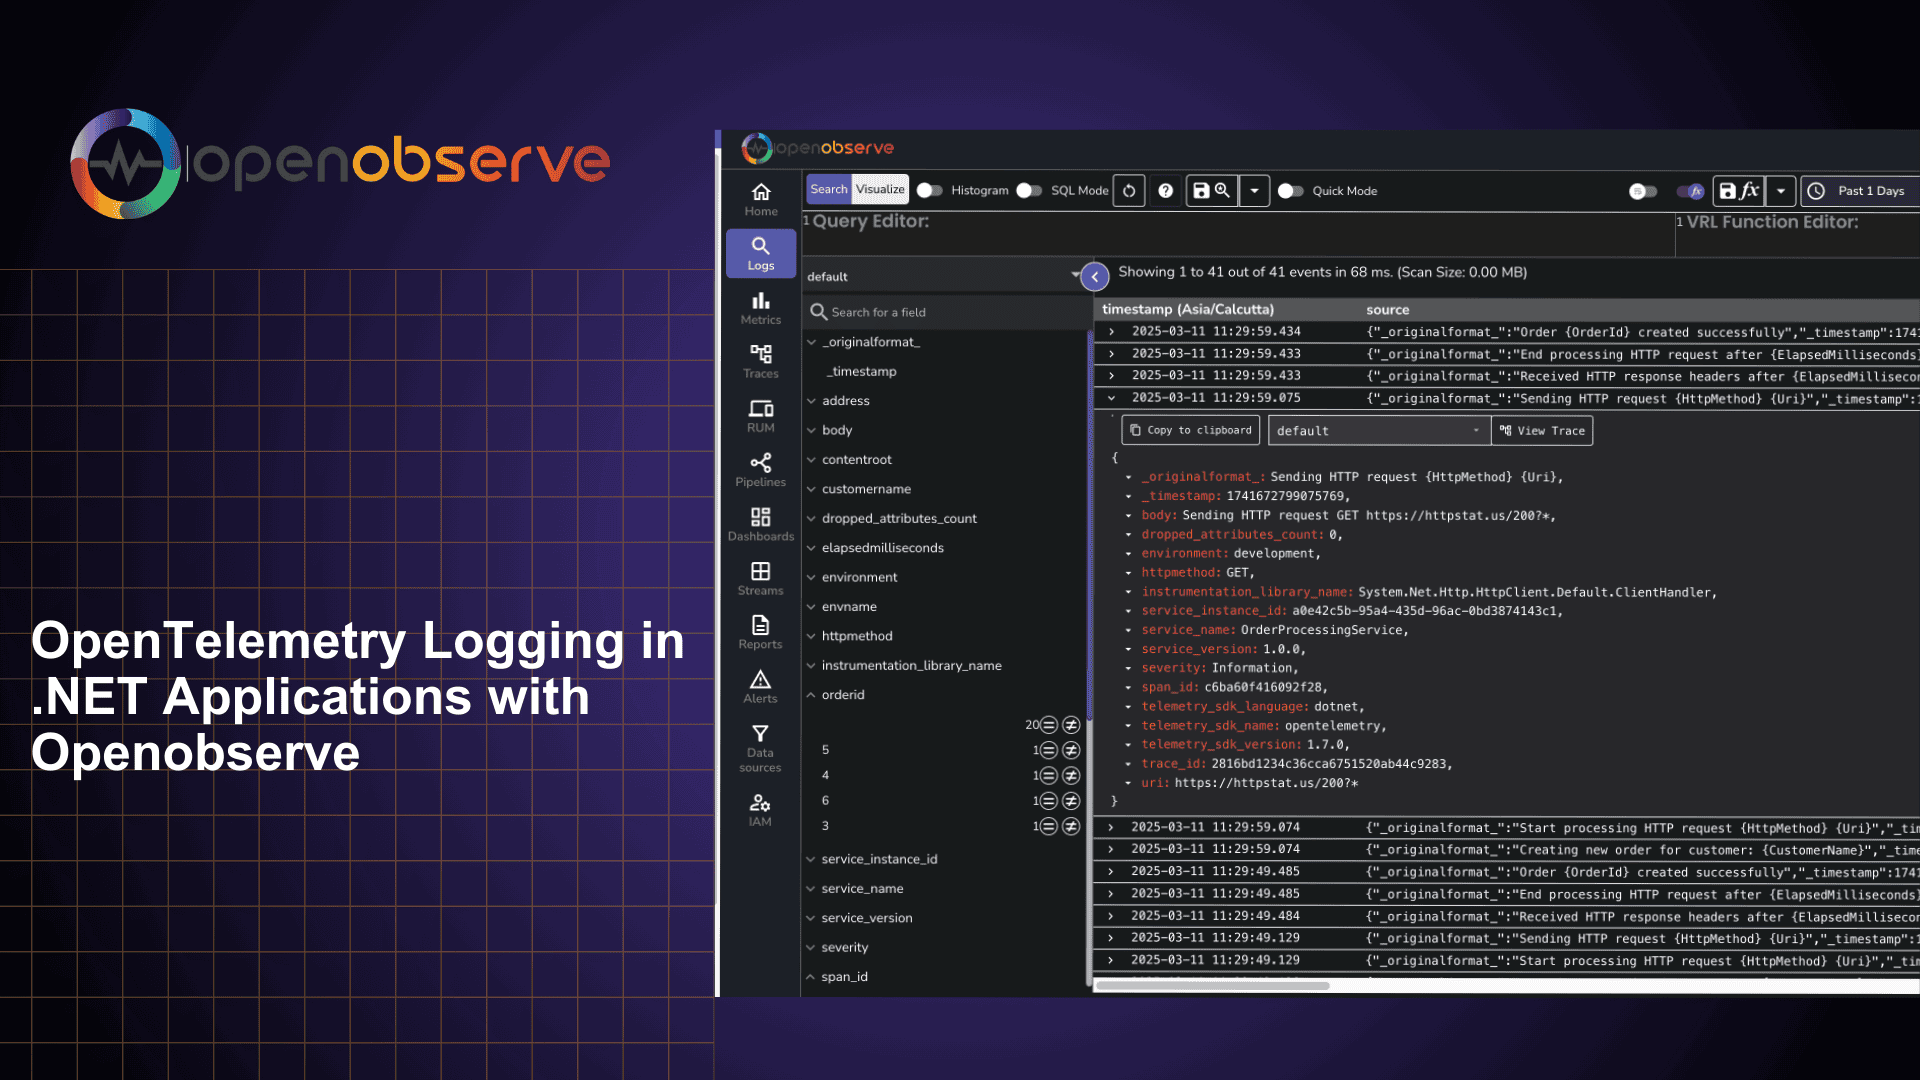
Implementing OpenTelemetry Logging in .NET Applications with OpenObserve




Ready to get started?
Try OpenObserve Cloud today for more efficient and performant observability.
Introduction
Effective logging is crucial for understanding and troubleshooting application behavior. In .NET applications, OpenTelemetry provides a standardized way to collect and export logs alongside traces and metrics.
In this comprehensive guide, you'll learn how to implement OpenTelemetry logging in a .NET 6+ Web API application and visualize logs using OpenObserve.
Why OpenTelemetry for Logging?
OpenTelemetry offers several advantages for logging in .NET applications:
- Unified logging standard across different languages and platforms
- Seamless integration with existing .NET logging infrastructure
- Ability to correlate logs with traces for better debugging
- Vendor-neutral approach with support for multiple backends
Prerequisites
Before we begin, ensure you have:
- .NET SDK 6.0 or newer installed
- An OpenObserve account (You can use OpenObserve Cloud or set up a self-hosted installation)
Getting Started
We'll use our order processing API to demonstrate logging implementation. The application already has tracing configured, and we'll add logging to provide more detailed insights into its operation.
git clone https://github.com/openobserve/dotnet-opentelemetry-tracing-application
cd dotnet-opentelemetry-tracing-application
Implementing OpenTelemetry Logging in .NET
Add the OpenTelemetry logging packages to your project:
dotnet add package OpenTelemetry.Extensions.Logging --version 1.7.0
dotnet add package OpenTelemetry.Exporter.OpenTelemetryProtocol --version 1.7.0
Configuring OpenTelemetry Logging
Configure OpenTelemetry logging in your Program.cs:
builder.Logging.ClearProviders();

var resourceBuilder = ResourceBuilder.CreateDefault()
    .AddService("OrderProcessingService")
    .AddAttributes(new Dictionary<string, object>
    {
        ["environment"] = "development",
        ["service.version"] = "1.0.0"
    });

builder.Logging.AddOpenTelemetry(logging => {
    logging.IncludeFormattedMessage = true;
    logging.SetResourceBuilder(resourceBuilder)
        .AddConsoleExporter()
        .AddOtlpExporter(otlpOptions => {
            otlpOptions.Endpoint = new Uri("your_openobserve_url/v1/logs");
            otlpOptions.Headers = "Authorization=Basic YOUR_AUTH_TOKEN";
            otlpOptions.Protocol = OpenTelemetry.Exporter.OtlpExportProtocol.HttpProtobuf;
        });
});
Note: Replace the placeholder values with your OpenObserve details:
- Add
/v1/logsto your OTLP HTTP endpoint- Use your Base64 encoded credentials in the Authorization header
Adding Logs to Your Controllers
Example of logging in an API controller:
[ApiController]
[Route("[controller]")]
public class OrderController : ControllerBase
{
    private readonly ILogger<OrderController> _logger;

    public OrderController(ILogger<OrderController> logger)
    {
        _logger = logger;
    }

    [HttpPost]
    public async Task<IActionResult> CreateOrder(Order order)
    {
        _logger.LogInformation(
            "Creating order for customer: {CustomerName} with amount: {Amount}",
            order.CustomerName,
            order.Amount
        );

        try
        {
            // Order processing logic...
            return Ok(order);
        }
        catch (Exception ex)
        {
            _logger.LogError(
                ex,
                "Failed to create order for customer {CustomerName}",
                order.CustomerName
            );
            throw;
        }
    }
}
Testing Your Logging Setup
Run your application:
dotnet run
Send some test requests to generate logs:
# Create an order
curl -X POST http://localhost:5069/order \
  -H "Content-Type: application/json" \
  -d '{"customerName":"Test User","amount":150.00}'

# Try to get a non-existent order (generates warning logs)
curl http://localhost:5069/order/999
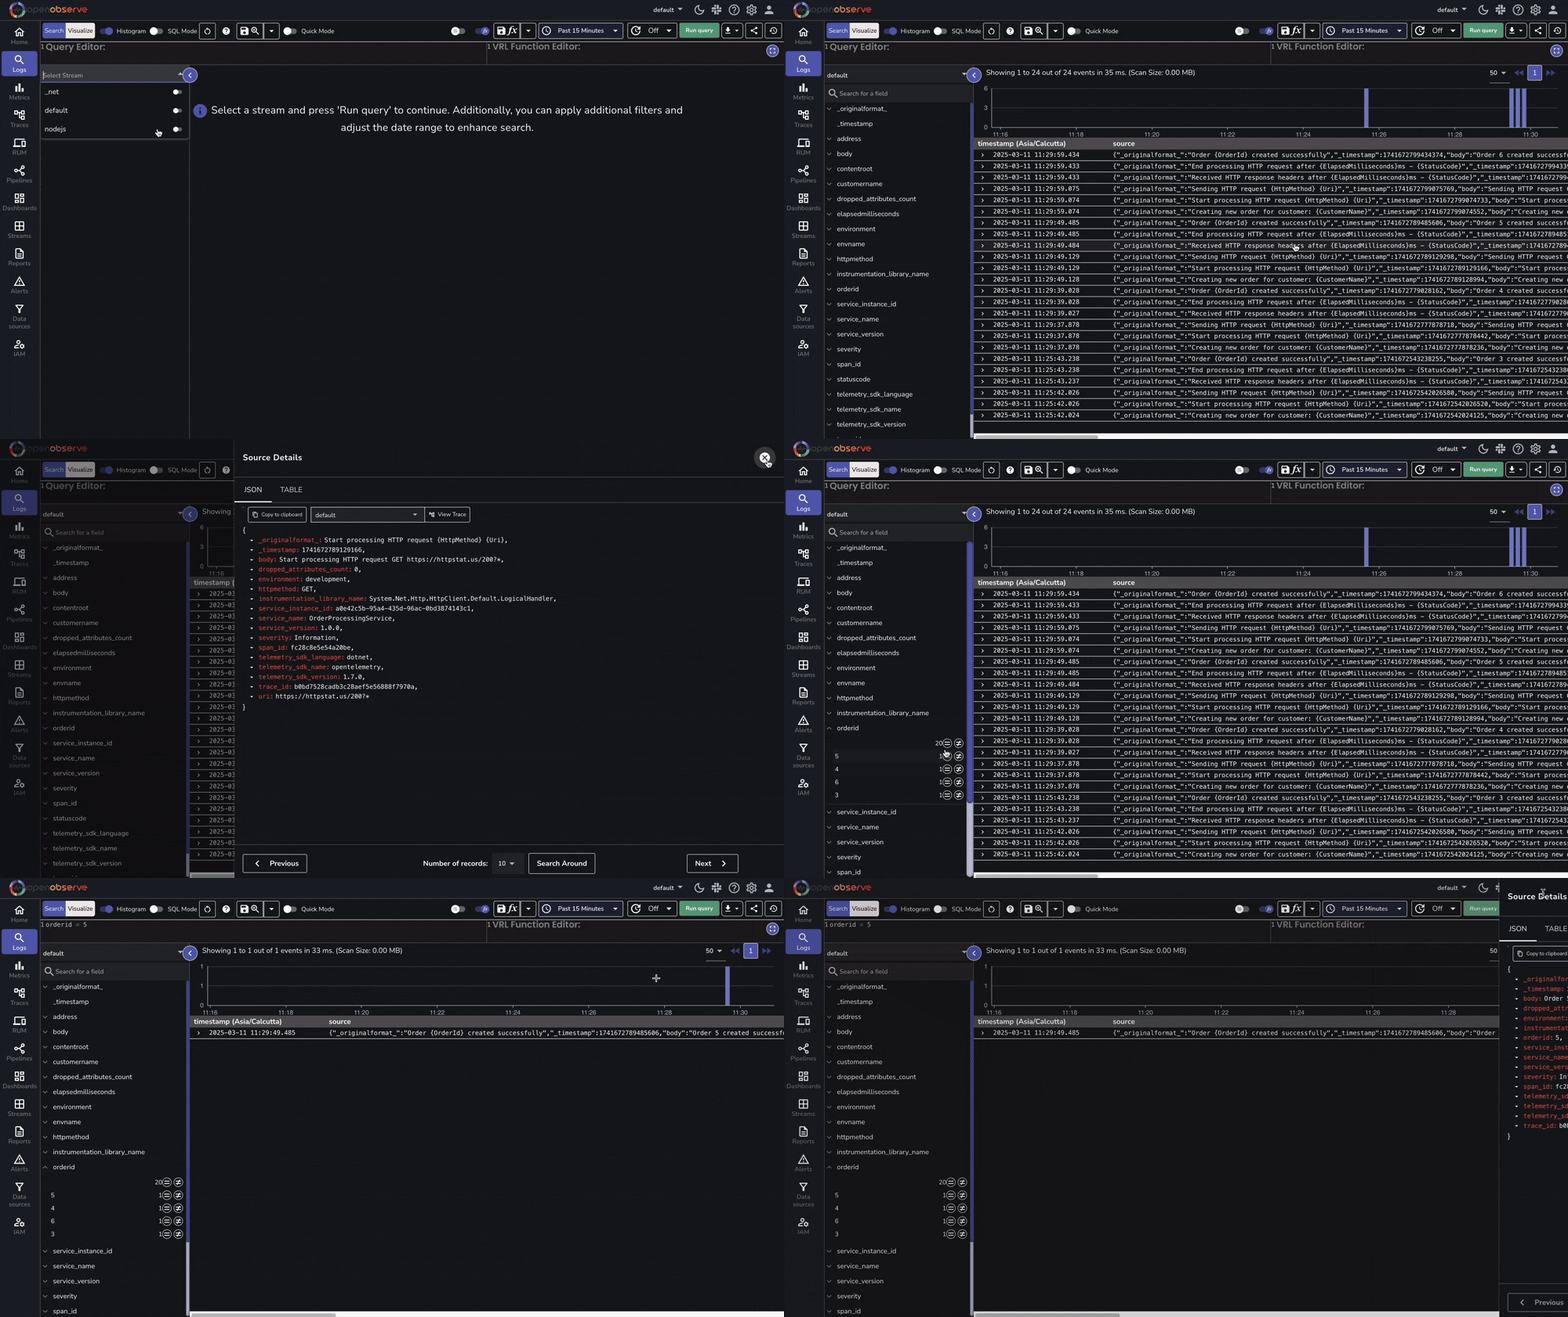
Viewing Logs in OpenObserve
- Log into your OpenObserve instance
- Navigate to the Logs section
- You should see a
defaultlogs stream containing:- Order creation attempts
- Successful order creations
- Warning logs for non-existent orders
Correlating Logs with Traces
OpenTelemetry automatically correlates logs with traces in your application. When you make a request:
[HttpPost]
public async Task<IActionResult> CreateOrder(Order order)
{
    _logger.LogInformation(
        "Creating order for customer: {CustomerName} with amount: {Amount}",
        order.CustomerName,
        order.Amount
    );

    using var activity = TracingInstrumentation.ActivitySource.StartActivity("CreateOrder");

}
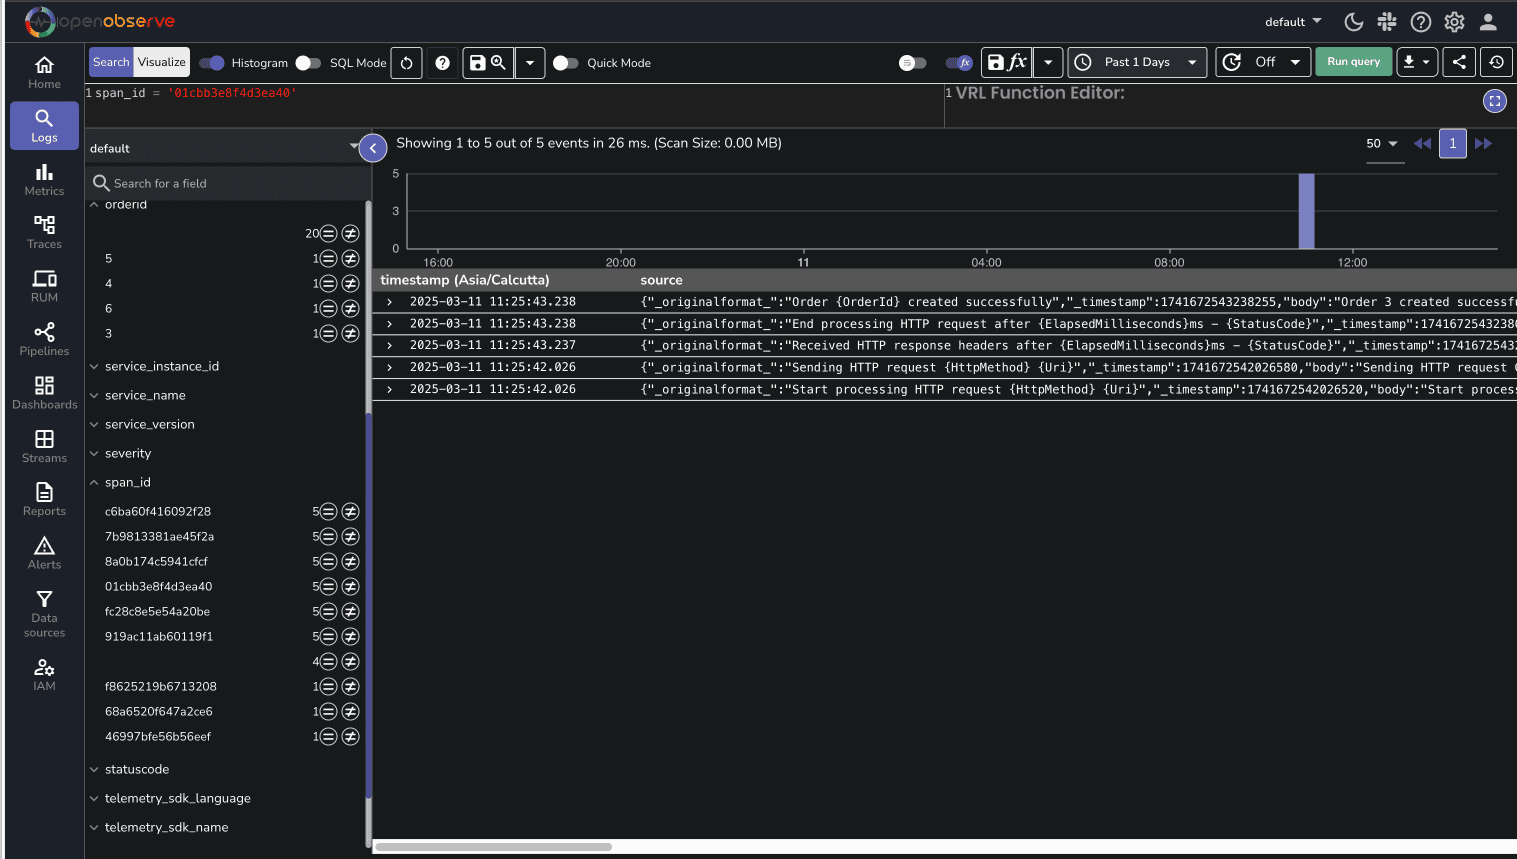
Each log entry includes:
- Trace ID: Links to the corresponding distributed trace
- Span ID: Shows which operation generated the log
- Service name and version
Troubleshooting Common Issues
If you're not seeing logs in OpenObserve:
- Verify the logs endpoint includes
/v1/logs - Ensure your authentication token is correct
- Make test requests to generate some logs
- Check console output for any export errors
Next Steps
Now that you have OpenTelemetry logging set up in your .NET application:
- Watch our detailed video guide on correlating logs with traces for better debugging
- Follow our .NET tracing guide to implement distributed tracing in your .NET applications.
- Set up log-based alerts, explore structured logging patterns, or add custom attributes to your logs. The complete sample code is available in our GitHub repository.
Need help? Join our Slack community for support.
Happy Monitoring! 🚀
About the Author
Manas Sharma


Manas is a passionate Dev and Cloud Advocate with a strong focus on cloud-native technologies, including observability, cloud, kubernetes, and opensource. building bridges between tech and community.
Follow OpenObserve on Google
Add OpenObserve as a preferred source to see more of our articles in Google Search and Top Stories.













