How Log Parsing Works in OpenObserve




Ready to get started?
Try OpenObserve Cloud today for more efficient and performant observability.

Why Log Parsing Matters
Efficient log parsing is critical for understanding system behavior, troubleshooting issues, and powering analytics across your stack. To achieve these outcomes, it’s essential to understand the right tools and techniques. OpenObserve makes this easy with built-in support for VRL (Vector Remap Language) and its powerful data pipelines feature. Together, they enable everything from basic field extraction to advanced log normalization and enrichment.
In this blog, we’ll walk through three core areas to help you get started:
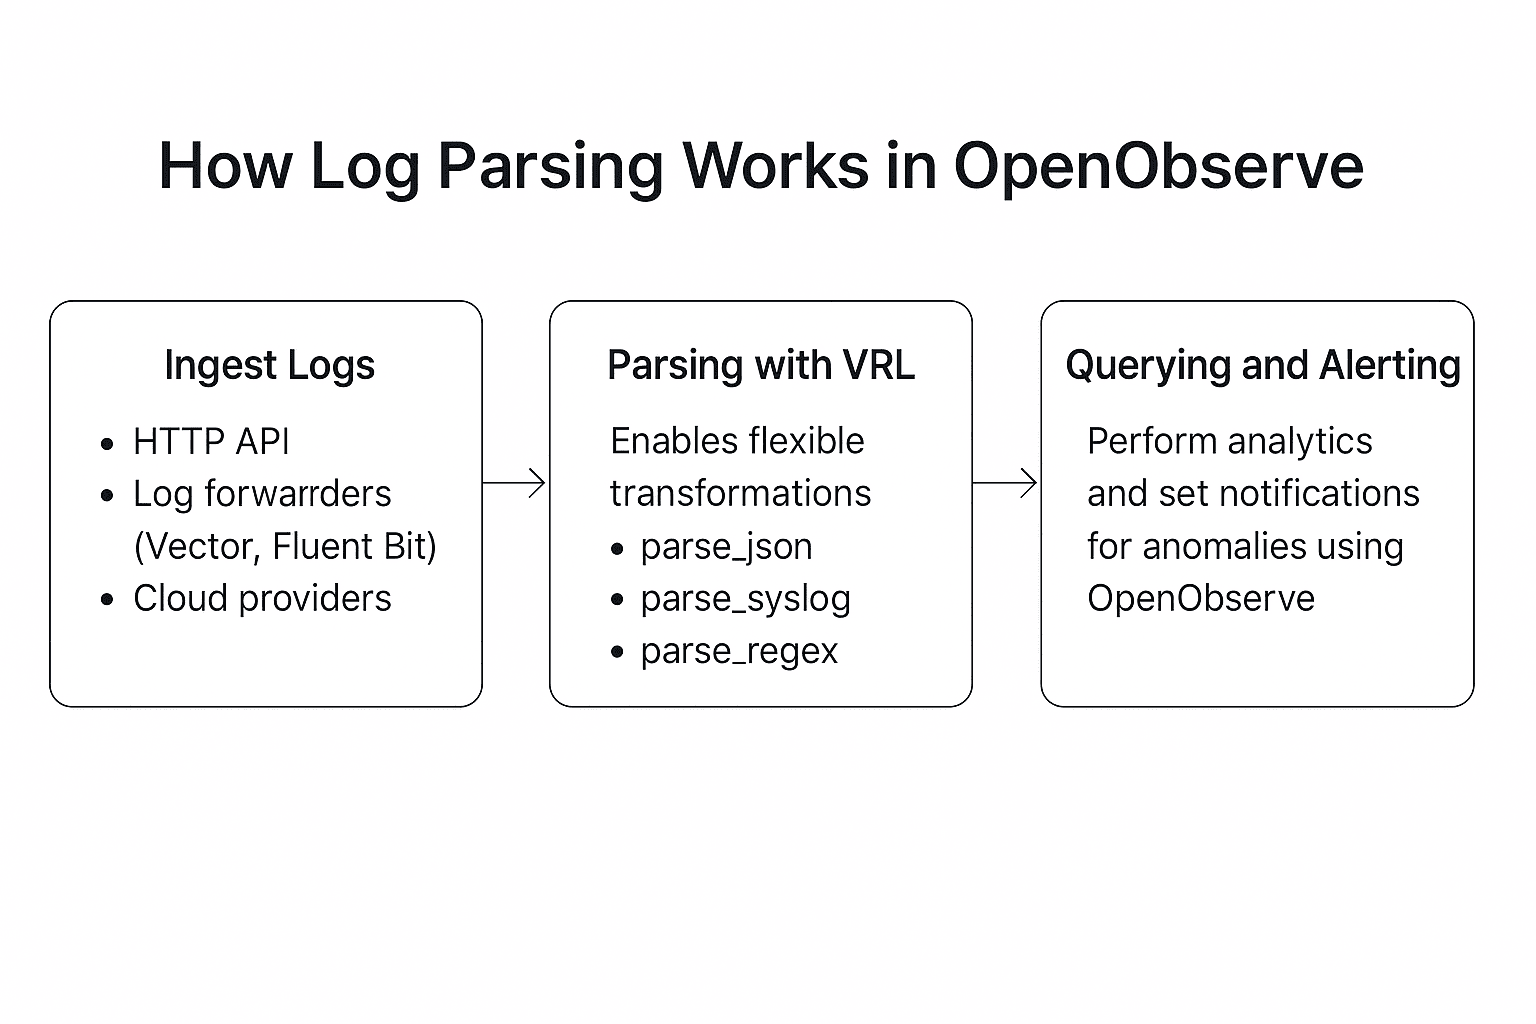
1. Log Ingestion Methods in OpenObserve
How logs are collected from various sources, including HTTP APIs, popular log forwarders like Fluent Bit, and cloud providers, and how OpenObserve supports structured, semi-structured, and unstructured formats.
2. Log Parsing and Transformation with VRL
How OpenObserve uses Vector Remap Language (VRL) for both real-time and query-time transformations. Includes examples using parse_json, parse_syslog, and parse_regex, and demonstrates how to extract and enrich fields during ingestion or on-demand.
3. Efficient Storage, Querying, and Alerting with SQL
How OpenObserve stores parsed logs using Apache Parquet, indexes all fields automatically, and enables high-performance SQL queries for insights, dashboards, and real-time alerts, while significantly lowering storage costs.
Ingest Logs from Anywhere
Before parsing can begin, logs need to flow into OpenObserve, and it’s easier than you think! The platform supports ingestion via:
- HTTP API: Send logs directly via POST requests.
- Popular Log Forwarders: OpenObserve integrates seamlessly with Vector, Fluent Bit, Fluentd, and the OpenTelemetry Collector.
- Cloud Provider Integrations: Pull logs from AWS, Azure, GCP, and more.
Logs may be raw (unstructured text), semi-structured (custom delimited formats), or fully structured (like JSON). OpenObserve is designed to handle all of them.
Example: Fluent Bit Config for IIS Logs
[INPUT]

Name          	tail
	Path              C:/inetpub/logs/LogFiles/W3SVC1/*.log
	Parser        	iis
	Tag           	iis_logs

[OUTPUT]

Name          	http
	Match         	iis_logs
	Host          	openobserve.example.com
	Port          	5080
	URI           	/api/default/_ingest/logs
	Format        	json
	Header        	Authorization Bearer YOUR_API_KEY
To learn more about configuring Fluent Bit for IIS, check out our detailed guide: Mastering Windows IIS Logging.
Log Parsing with VRL in OpenObserve
Once logs arrive, OpenObserve uses VRL to parse and transform them in real time, offering a powerful yet flexible approach. New to VRL? It’s a powerful language designed for data transformation, and you can dive into its parsing functions-a valuable resource for getting started!
How Parsing Functions Work in OpenObserve
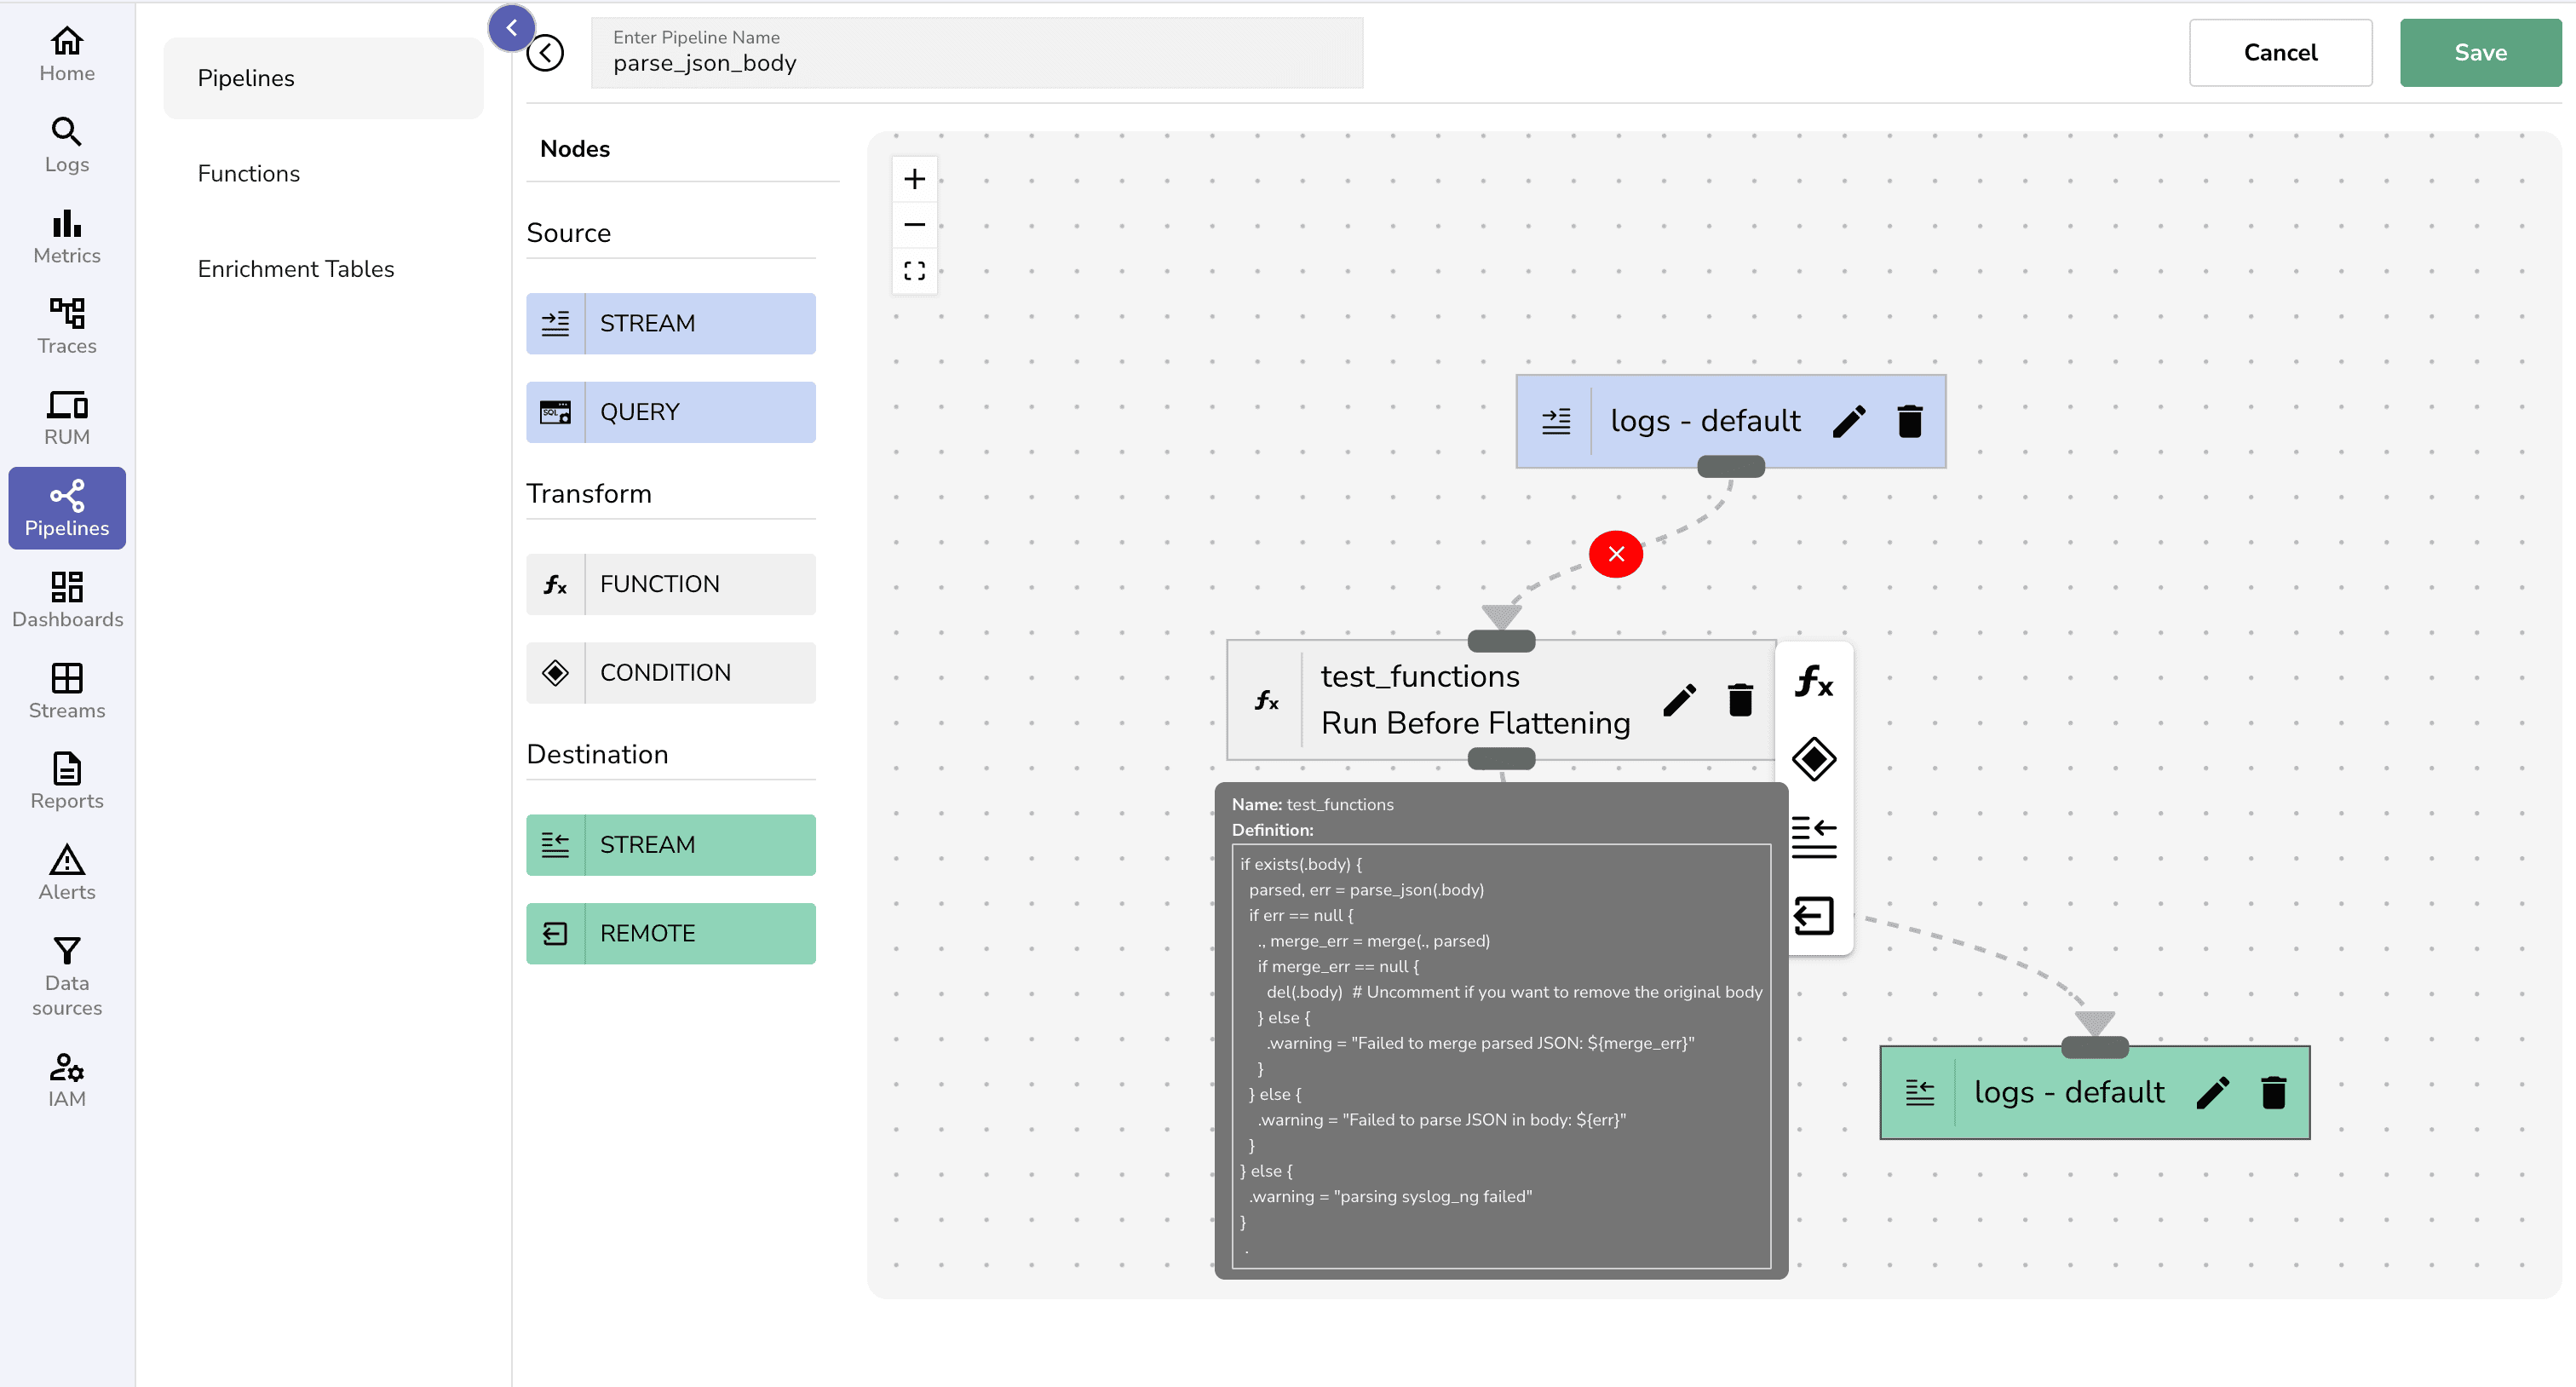
OpenObserve’s functions use VRL to parse your logs effectively. Each function contains VRL code to parse, transform, and enrich data, accessing incoming fields, applying conditions, and creating or modifying fields. For example, you can parse JSON logs, extract key fields, and enrich them with geographical data using enrichment tables, which makes VRL a must-have tool for customization.
Two Ways to Apply VRL Functions in OpenObserve
VRL transformations can be applied in two practical ways, depending on your needs:
- Query Time Transformation in the logs UI
- Real-Time Transformation via pipelines
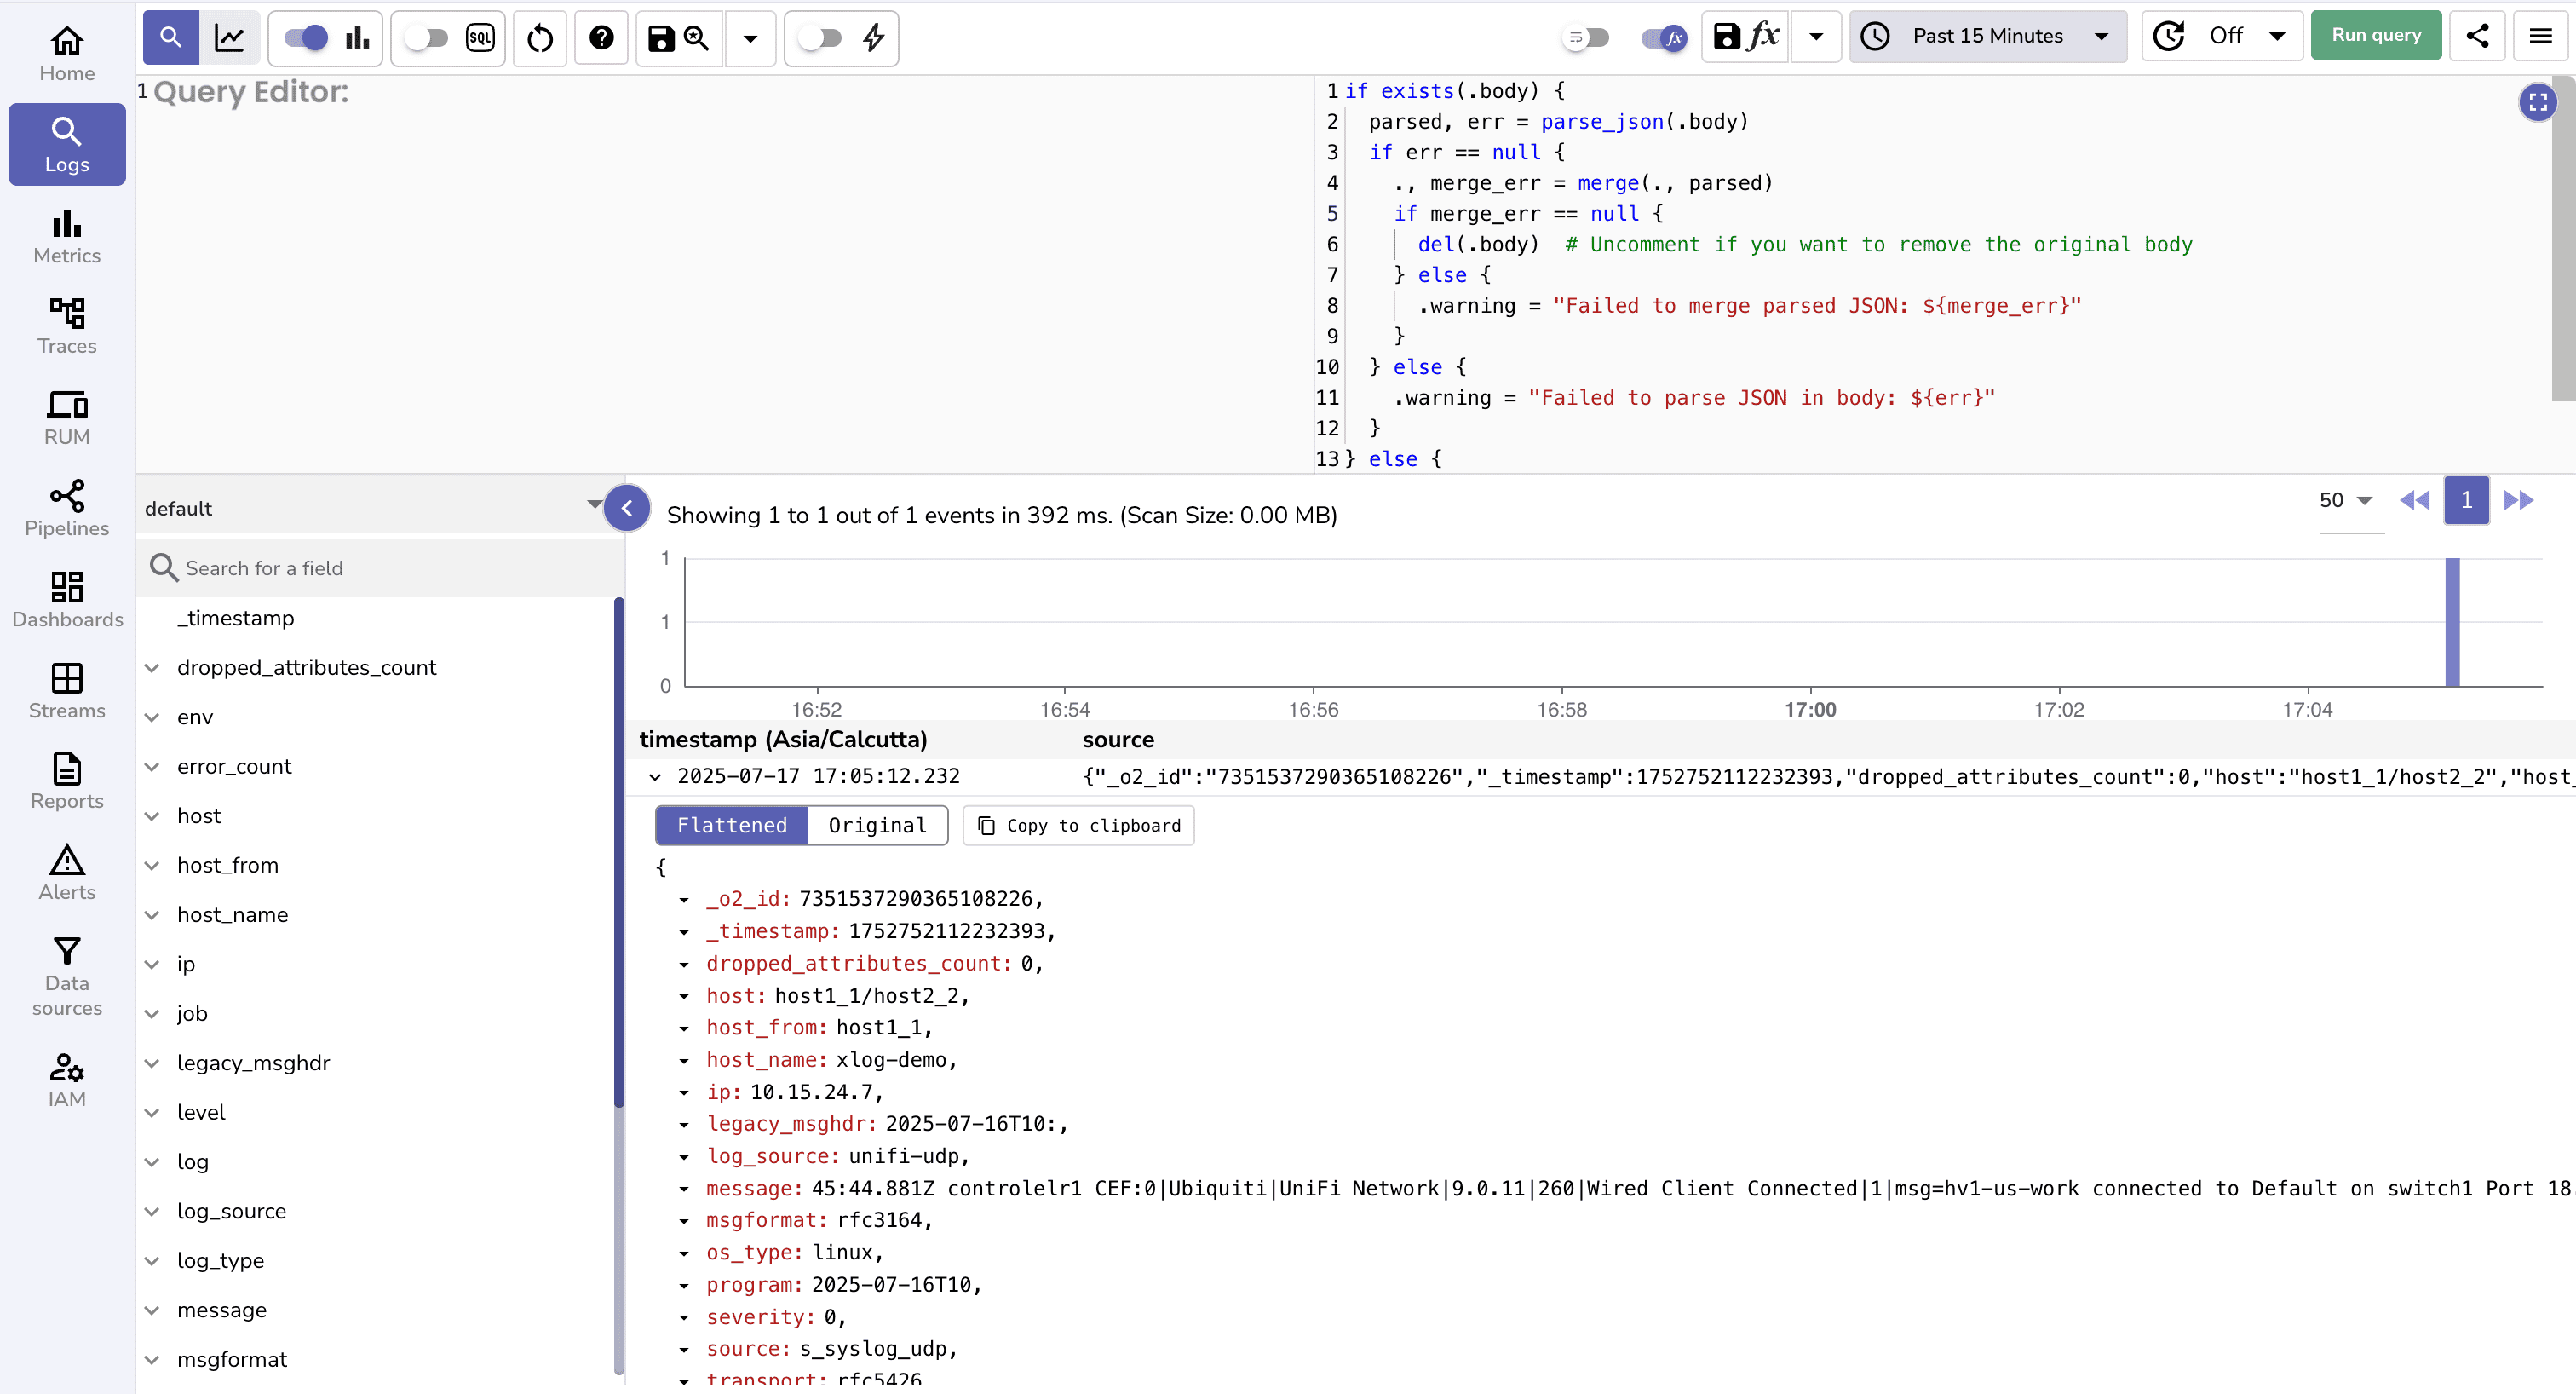
1. In the Logs UI (Query Time Transformation)
You can apply VRL scripts to queried records at query time. This is extremely useful for quick experiments or ad-hoc analysis without altering ingested data. It’s like a live playground for your logs!
Sample Log Record
{
  "body": "{\"log_source\":\"unifi-udp\",\"TRANSPORT\":\"rfc5426\",\"SOURCE\":\"s_syslog_udp\",\"PROGRAM\":\"2025-07-16T10\",\"MSGFORMAT\":\"rfc3164\",\"MESSAGE\":\"45:44.881Z controlelr1 CEF:0|Ubiquiti|UniFi Network|9.0.11|260|Wired Client Connected|1|msg=hv1-us-work connected to Default on switch1 Port 18. Link Speed: GbE. IP: 192.168.70.62 UNIFICategory=Client Activity UNIFIsubCategory=Wired\",\"LEGACY_MSGHDR\":\"2025-07-16T10:\",\"IP\":\"10.15.24.7\",\"HOST_FROM\":\"host1_1\",\"HOST\":\"host1_1/host2_2\"}",
  "dropped_attributes_count": 0,
  "host_name": "xlog-demo",
  "os_type": "linux",
  "severity": 0
}
2. Via Pipelines (Real-Time Transformation) You can use real-time pipelines to transform, redact, or enrich log fields as data ingests, ensuring queries work with processed records. Pipelines are a mechanism for processing and transforming logs before they are stored. To get started quickly, follow our step-by-step guide: How to Set Up Pipelines in OpenObserve.
Pro Tip: Pipelines are ideal for consistent data shaping and can help you avoid repetitive query-time transformations.
VRL Parsing Functions with Examples
For JSON logs
parse_jsonFor JSON logsparse_syslogFor logs that follow standard syslog formats (RFC-compliant)parse_regexFor custom formats or malformed entries
Example: Parsing JSON Logs
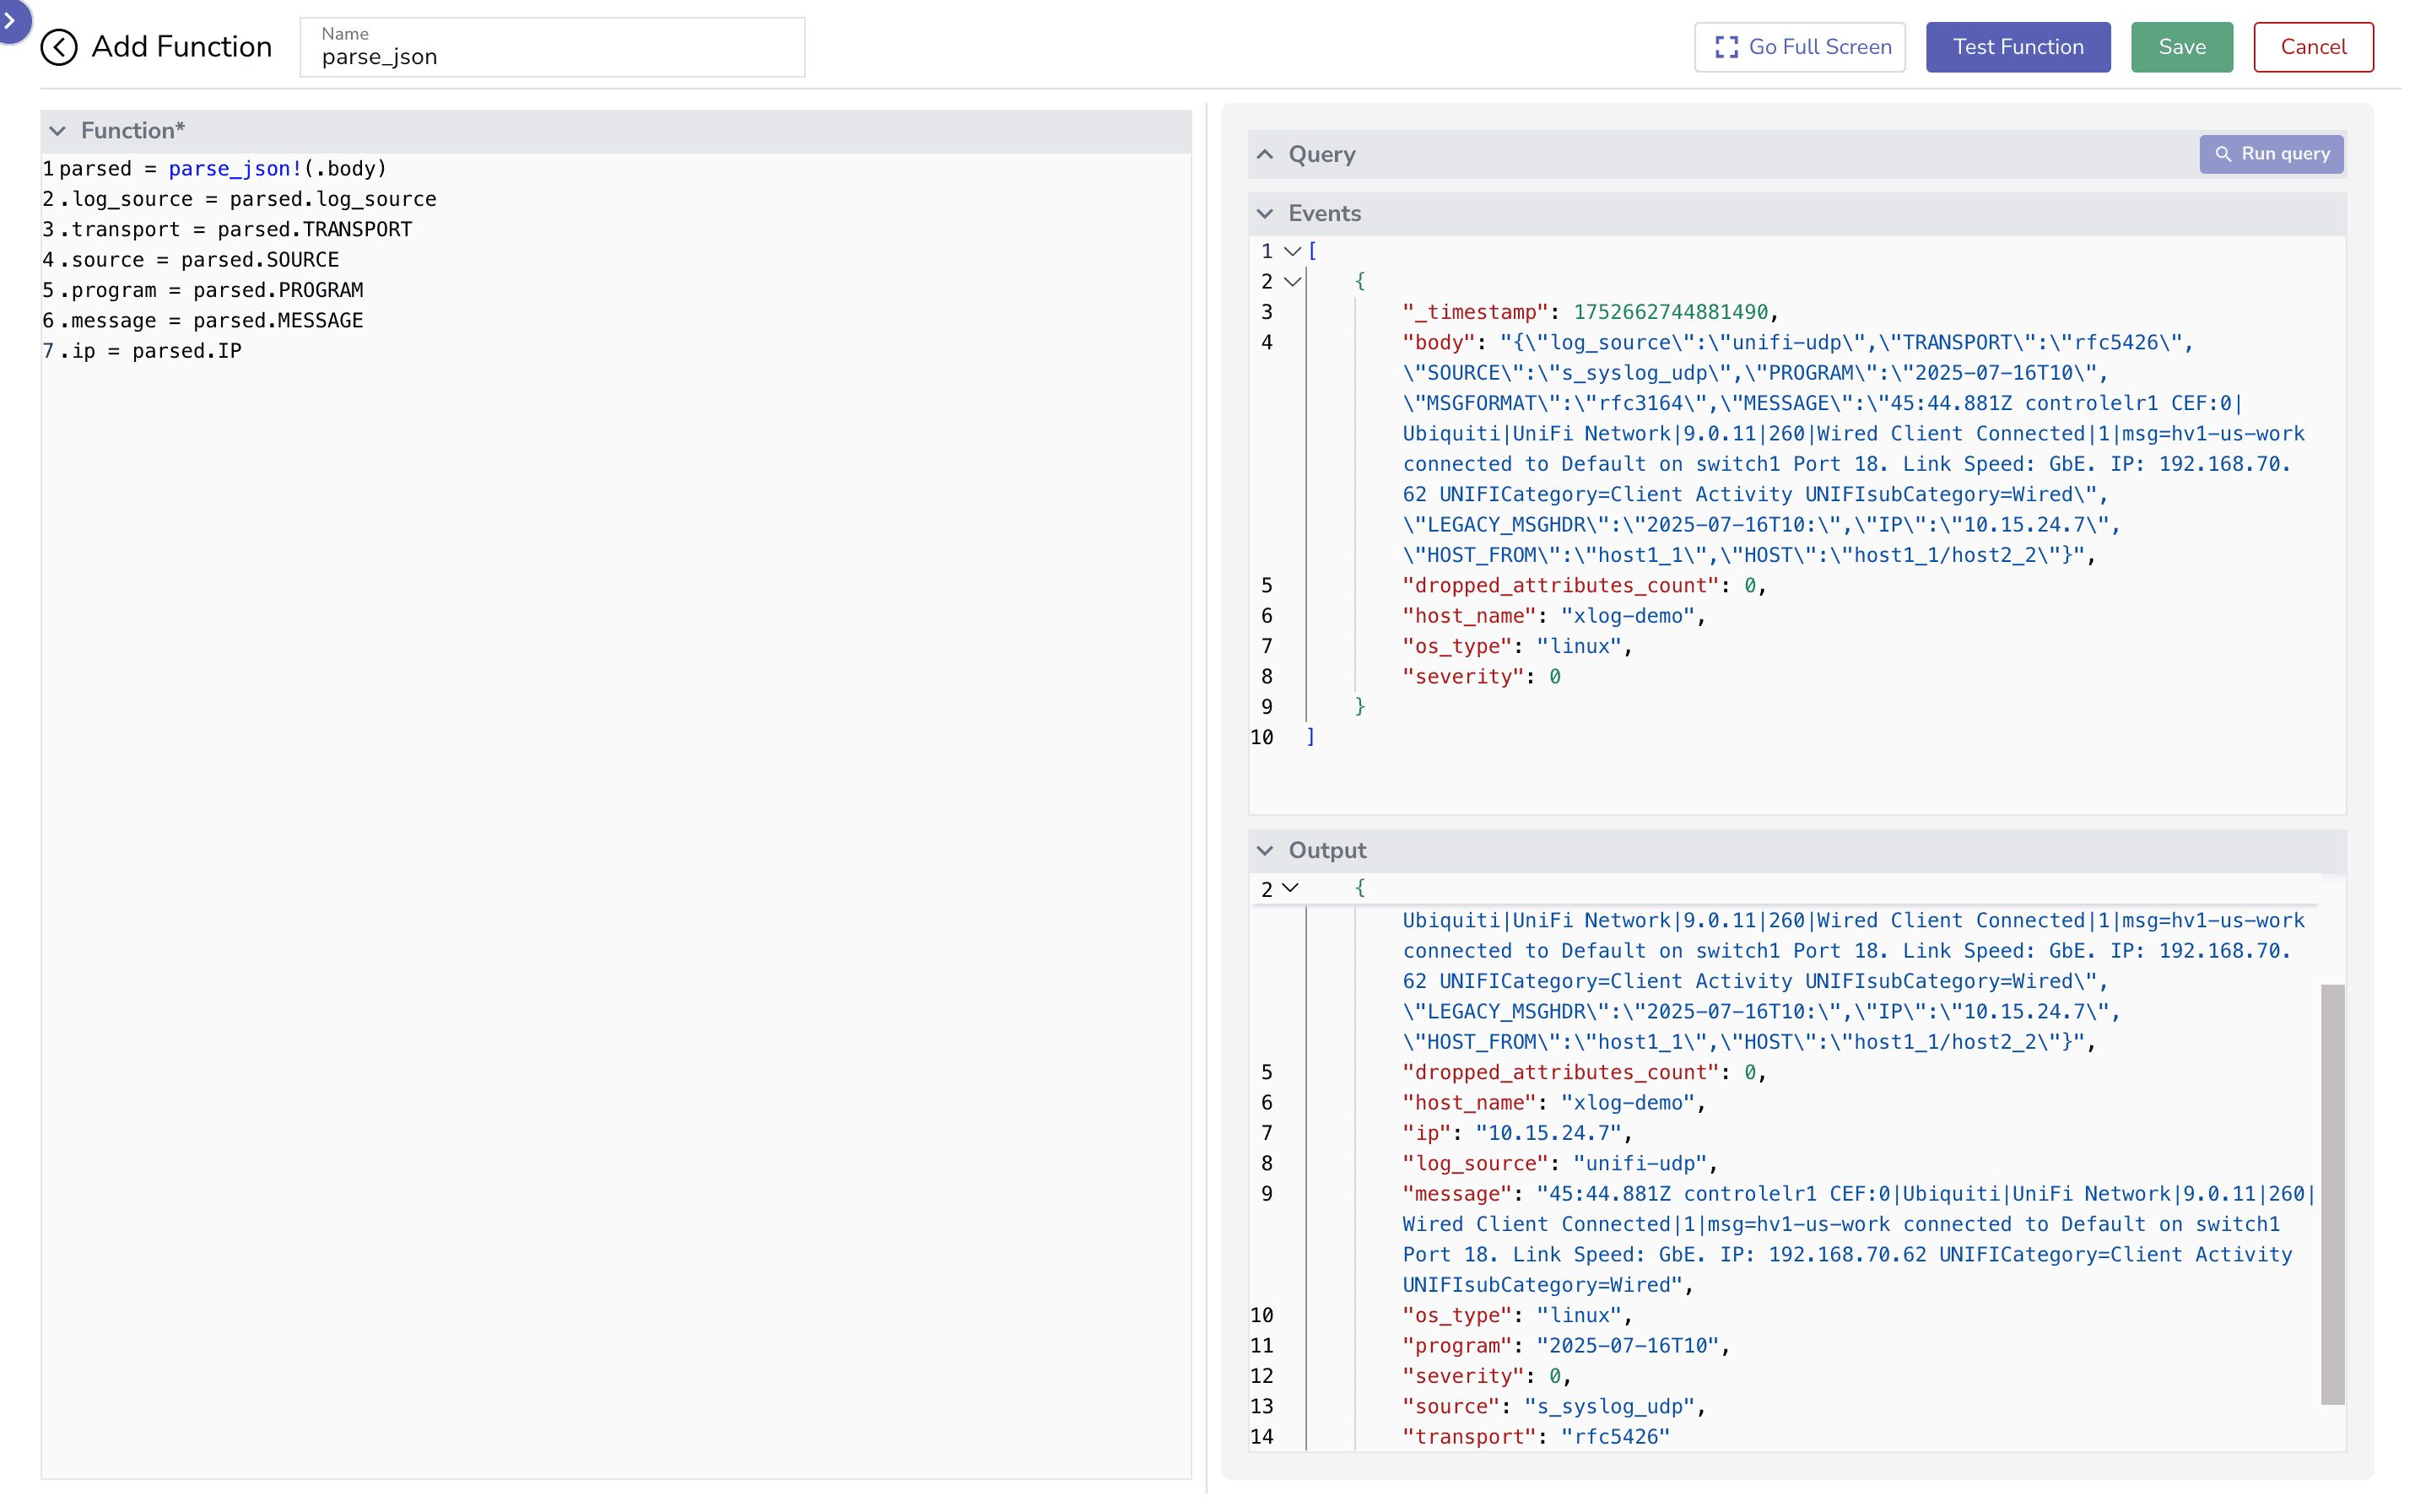
This function rocks for pulling out fields from JSON logs like the body field. It’s all about nested data magic!
parsed = parse_json!(.body)
.log_source = parsed.log_source
.transport = parsed.TRANSPORT
.source = parsed.SOURCE
.program = parsed.PROGRAM
.message = parsed.MESSAGE
.ip = parsed.IP
For a deeper dive into parsing unstructured logs to JSON, check out our blog on JSON Logging and Analysis.
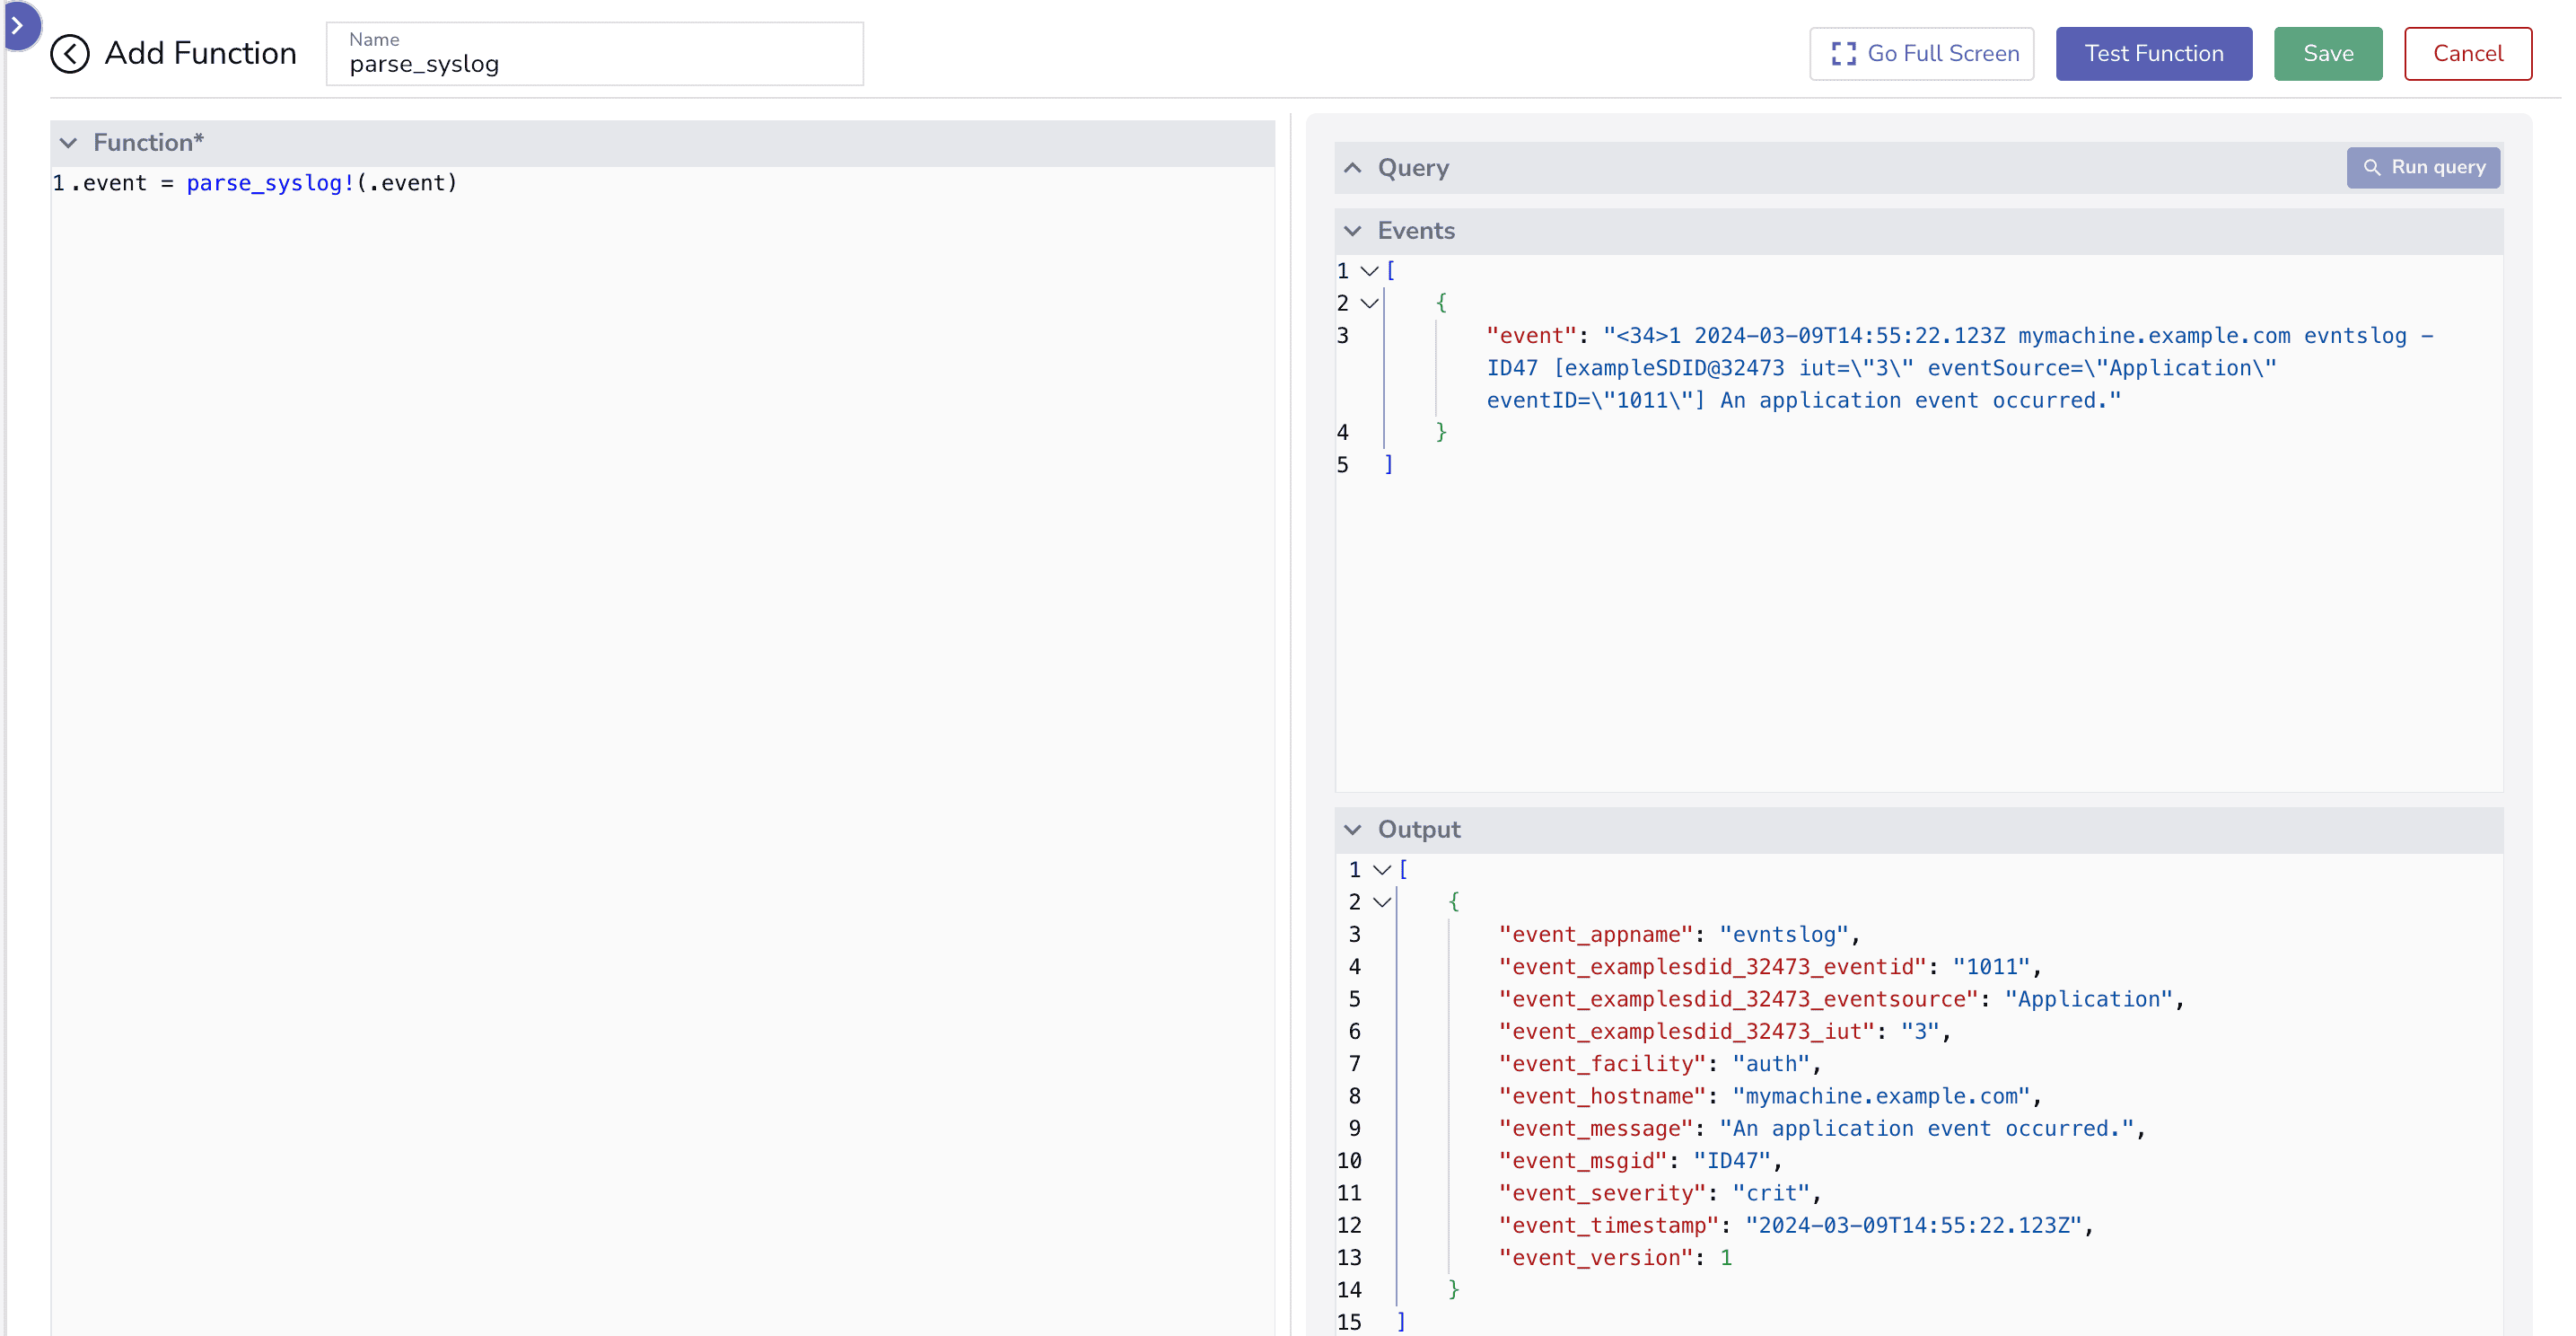
Example: Syslog formats
The parse_syslog function automatically parses the priority, facility, severity, timestamp, hostname, and message from a syslog string, according to the RFC 6587, RFC 5424 and RFC 3164 standards.
Sample Message
{
  "event": "<34>1 2024-03-09T14:55:22.123Z mymachine.example.com evntslog - ID47 [exampleSDID@32473 iut=\"3\" eventSource=\"Application\" eventID=\"1011\"] An application event occurred."
}
To parse this message using the parse_syslog function in OpenObserve, you would simply apply the function to the message:
.event = parse_syslog!(.event)
Parsed Message
{ "event": { "appname": "evntslog", "exampleSDID@32473": { "eventID": "1011", "eventSource": "Application", "iut": "3" }, "facility": "auth", "hostname": "mymachine.example.com", "message": "An application event occurred.", "msgid": "ID47", "severity": "crit", "timestamp": "2024-03-09T14:55:22.123Z", "version": 1 } }
Example: Extract Fields Using Regex
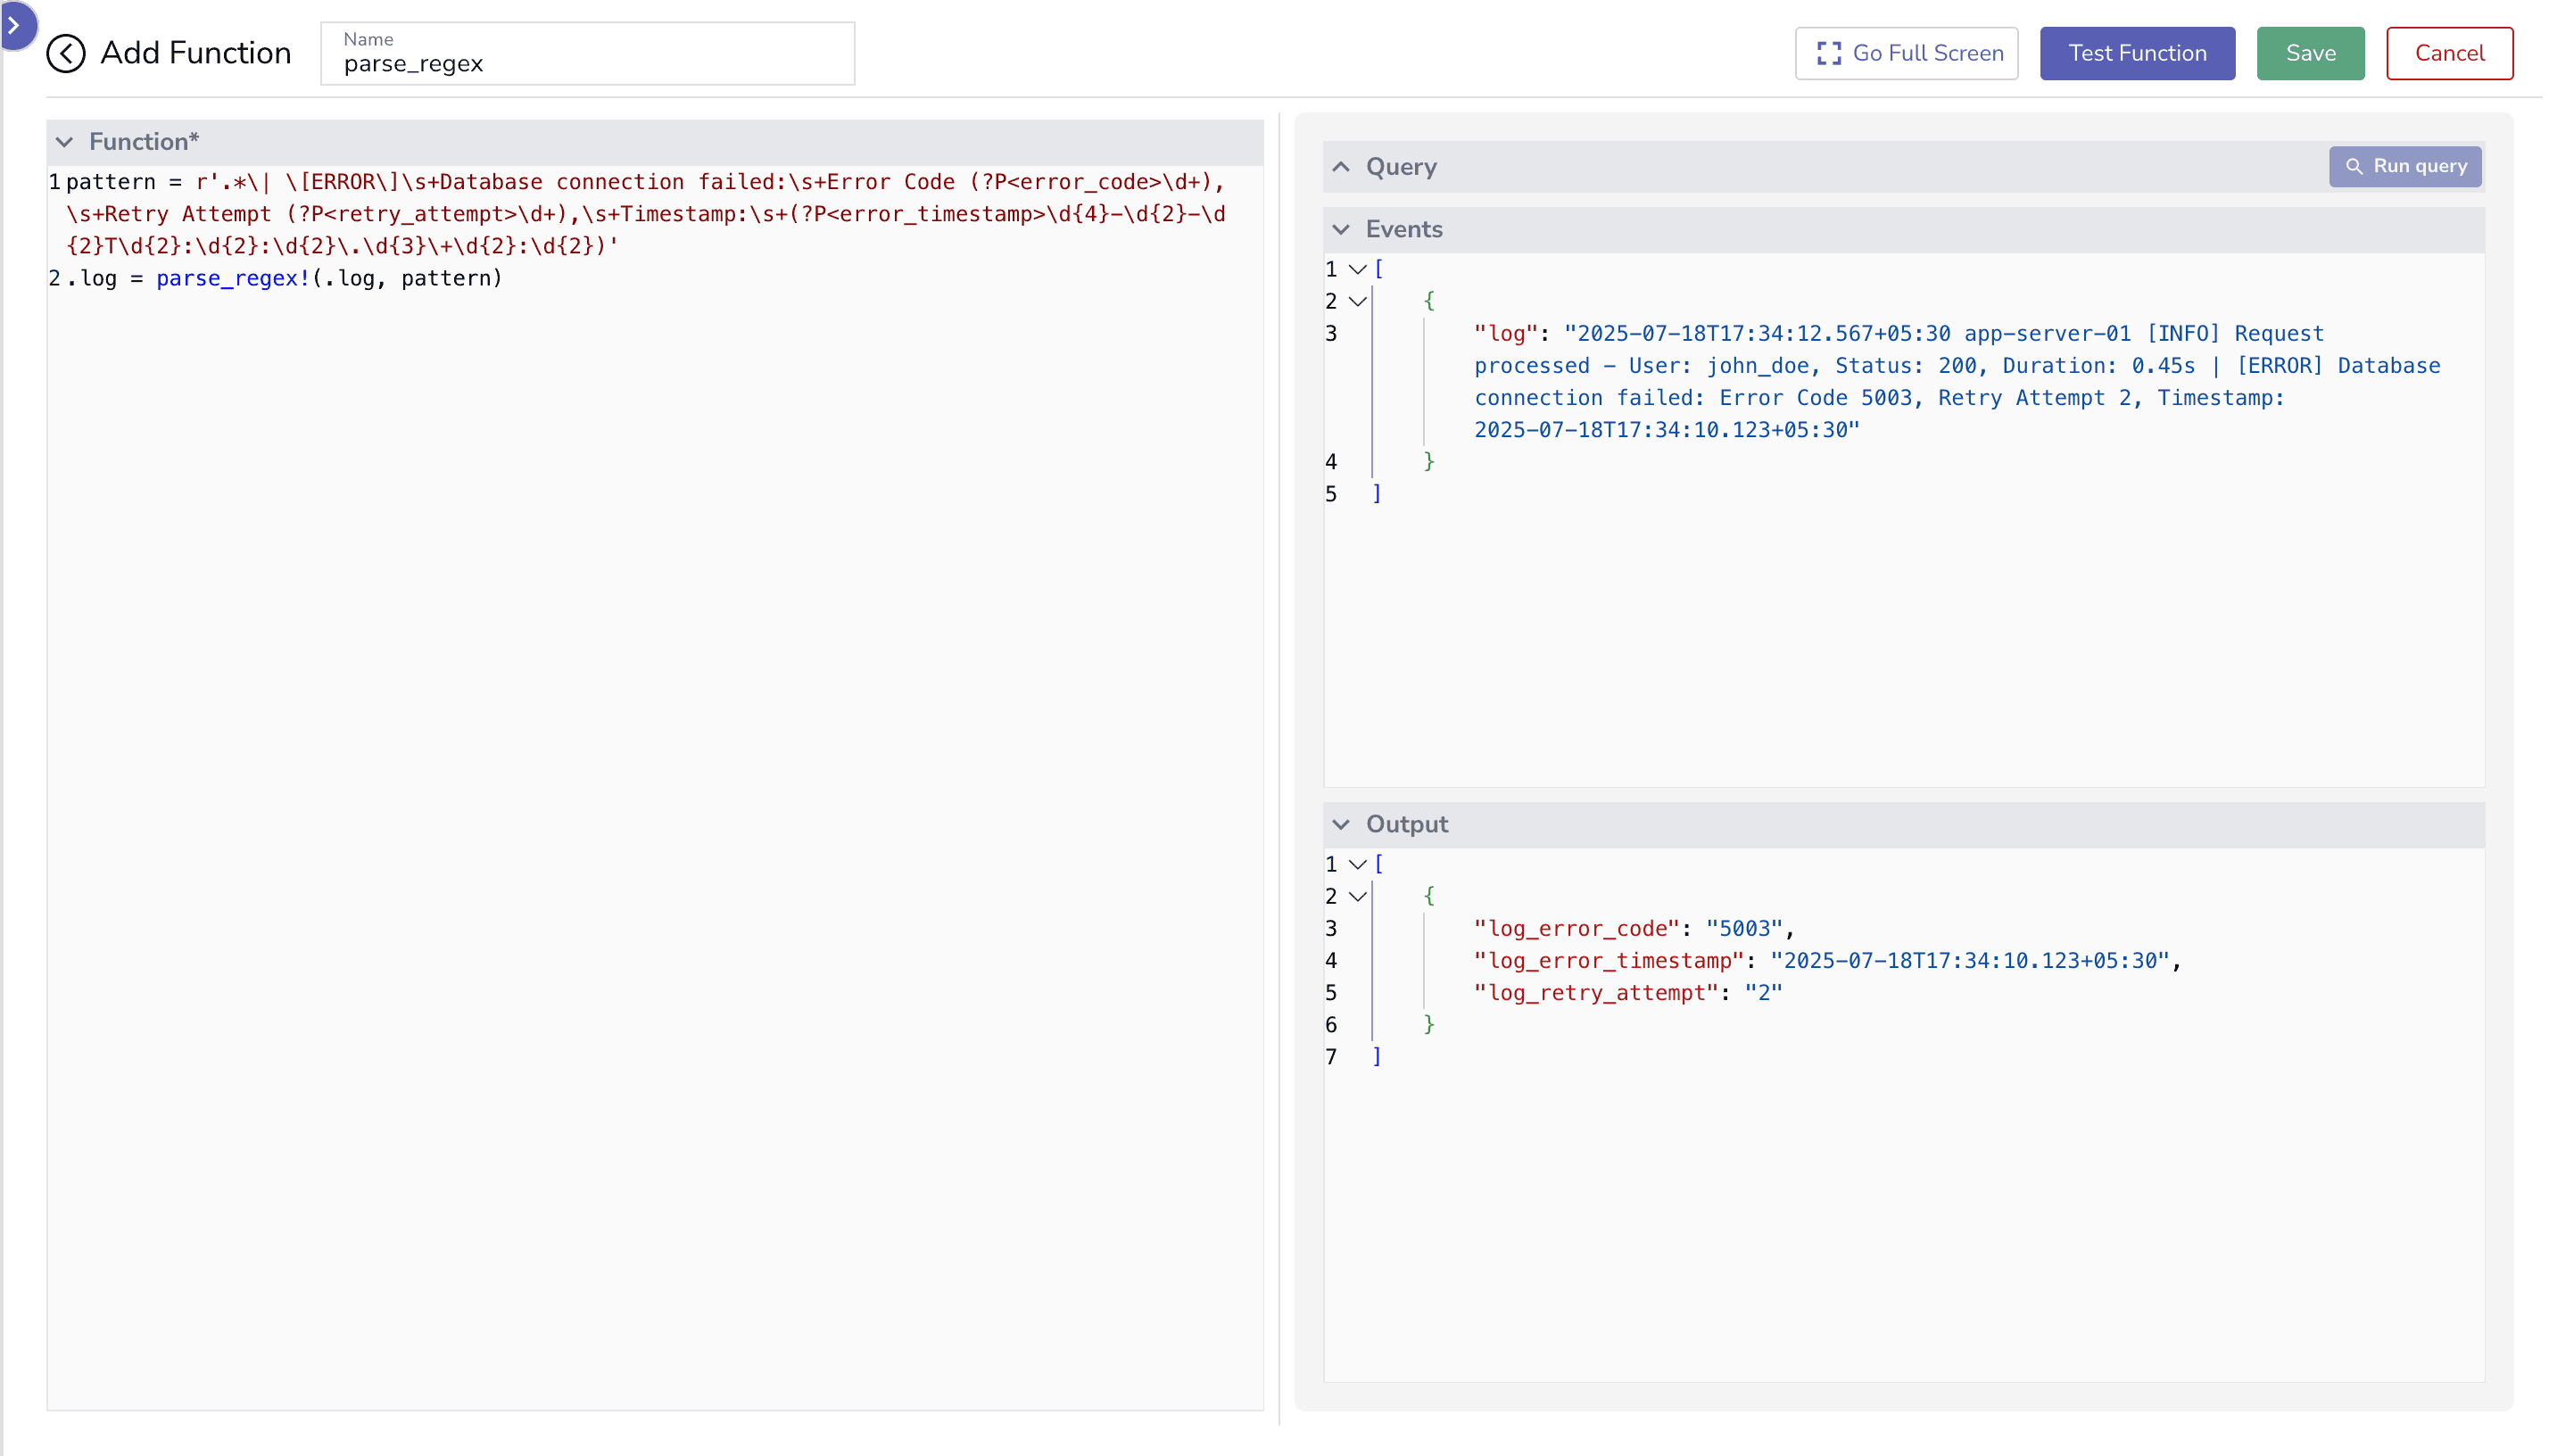
The parse_regex function in VRL is a highly powerful tool for log parsing due to its ability to perform custom field extraction from any log format. Unlike parse_json or parse_syslog, which rely on specific structures, parse_regex uses regular expressions to define patterns, making it ideal for unstructured or non-standard logs.
This flexibility allows you to target specific data points-such as error codes, timestamps, or IPs-across diverse log sources, enabling advanced use cases like alerting, anomaly detection, and custom dashboards.
Sample Message
{
  "log": "2025-07-18T17:34:12.567+05:30 app-server-01 [INFO] Request processed - User: john_doe, Status: 200, Duration: 0.45s | [ERROR] Database connection failed: Error Code 5003, Retry Attempt 2, Timestamp: 2025-07-18T17:34:10.123+05:30"
}
VRL Script
pattern = r'.*\| \[ERROR\]\s+Database connection failed:\s+Error Code (?P<error_code>\d+),\s+Retry Attempt (?P<retry_attempt>\d+),\s+Timestamp:\s+(?P<error_timestamp>\d{4}-\d{2}-\d{2}T\d{2}:\d{2}:\d{2}\.\d{3}\+\d{2}:\d{2})'
.log = parse_regex!(.log, pattern)
You can write such VRL scripts directly in your OpenObserve pipeline configuration to enable precise field extraction and enrichment at ingest time.
Parsed Log Storage
OpenObserve stores parsed logs using Apache Parquet, which is a compressed, columnar format built for high-performance analytics. It also auto-indexes all fields, eliminating the need for predefined schemas. Parquet is an extremely efficient storage and indexing format that saves you money.
The highly compressed architecture not only delivers fast query speeds and real-time dashboarding but also significantly reduces storage overhead, which translates into lower infrastructure and retention costs. You get powerful, real-time observability at a fraction of the cost of conventional platforms, which enables you to:
- Keep storage costs low
- Speed up query performance
- Get real-time dashboard and alerting data
Setting Up Alerts on Parsed Data
In any observability workflow, parsing and transforming logs are just the first steps. The real value emerges when you query these structured fields to extract insights and set up alerts. Parsed data, like error_code or retry_attempt, enables precise monitoring of system health, detection of anomalies, and proactive responses.
Alerts based on these transformed fields ensure timely notifications, such as escalating database failures, enhancing operational efficiency.
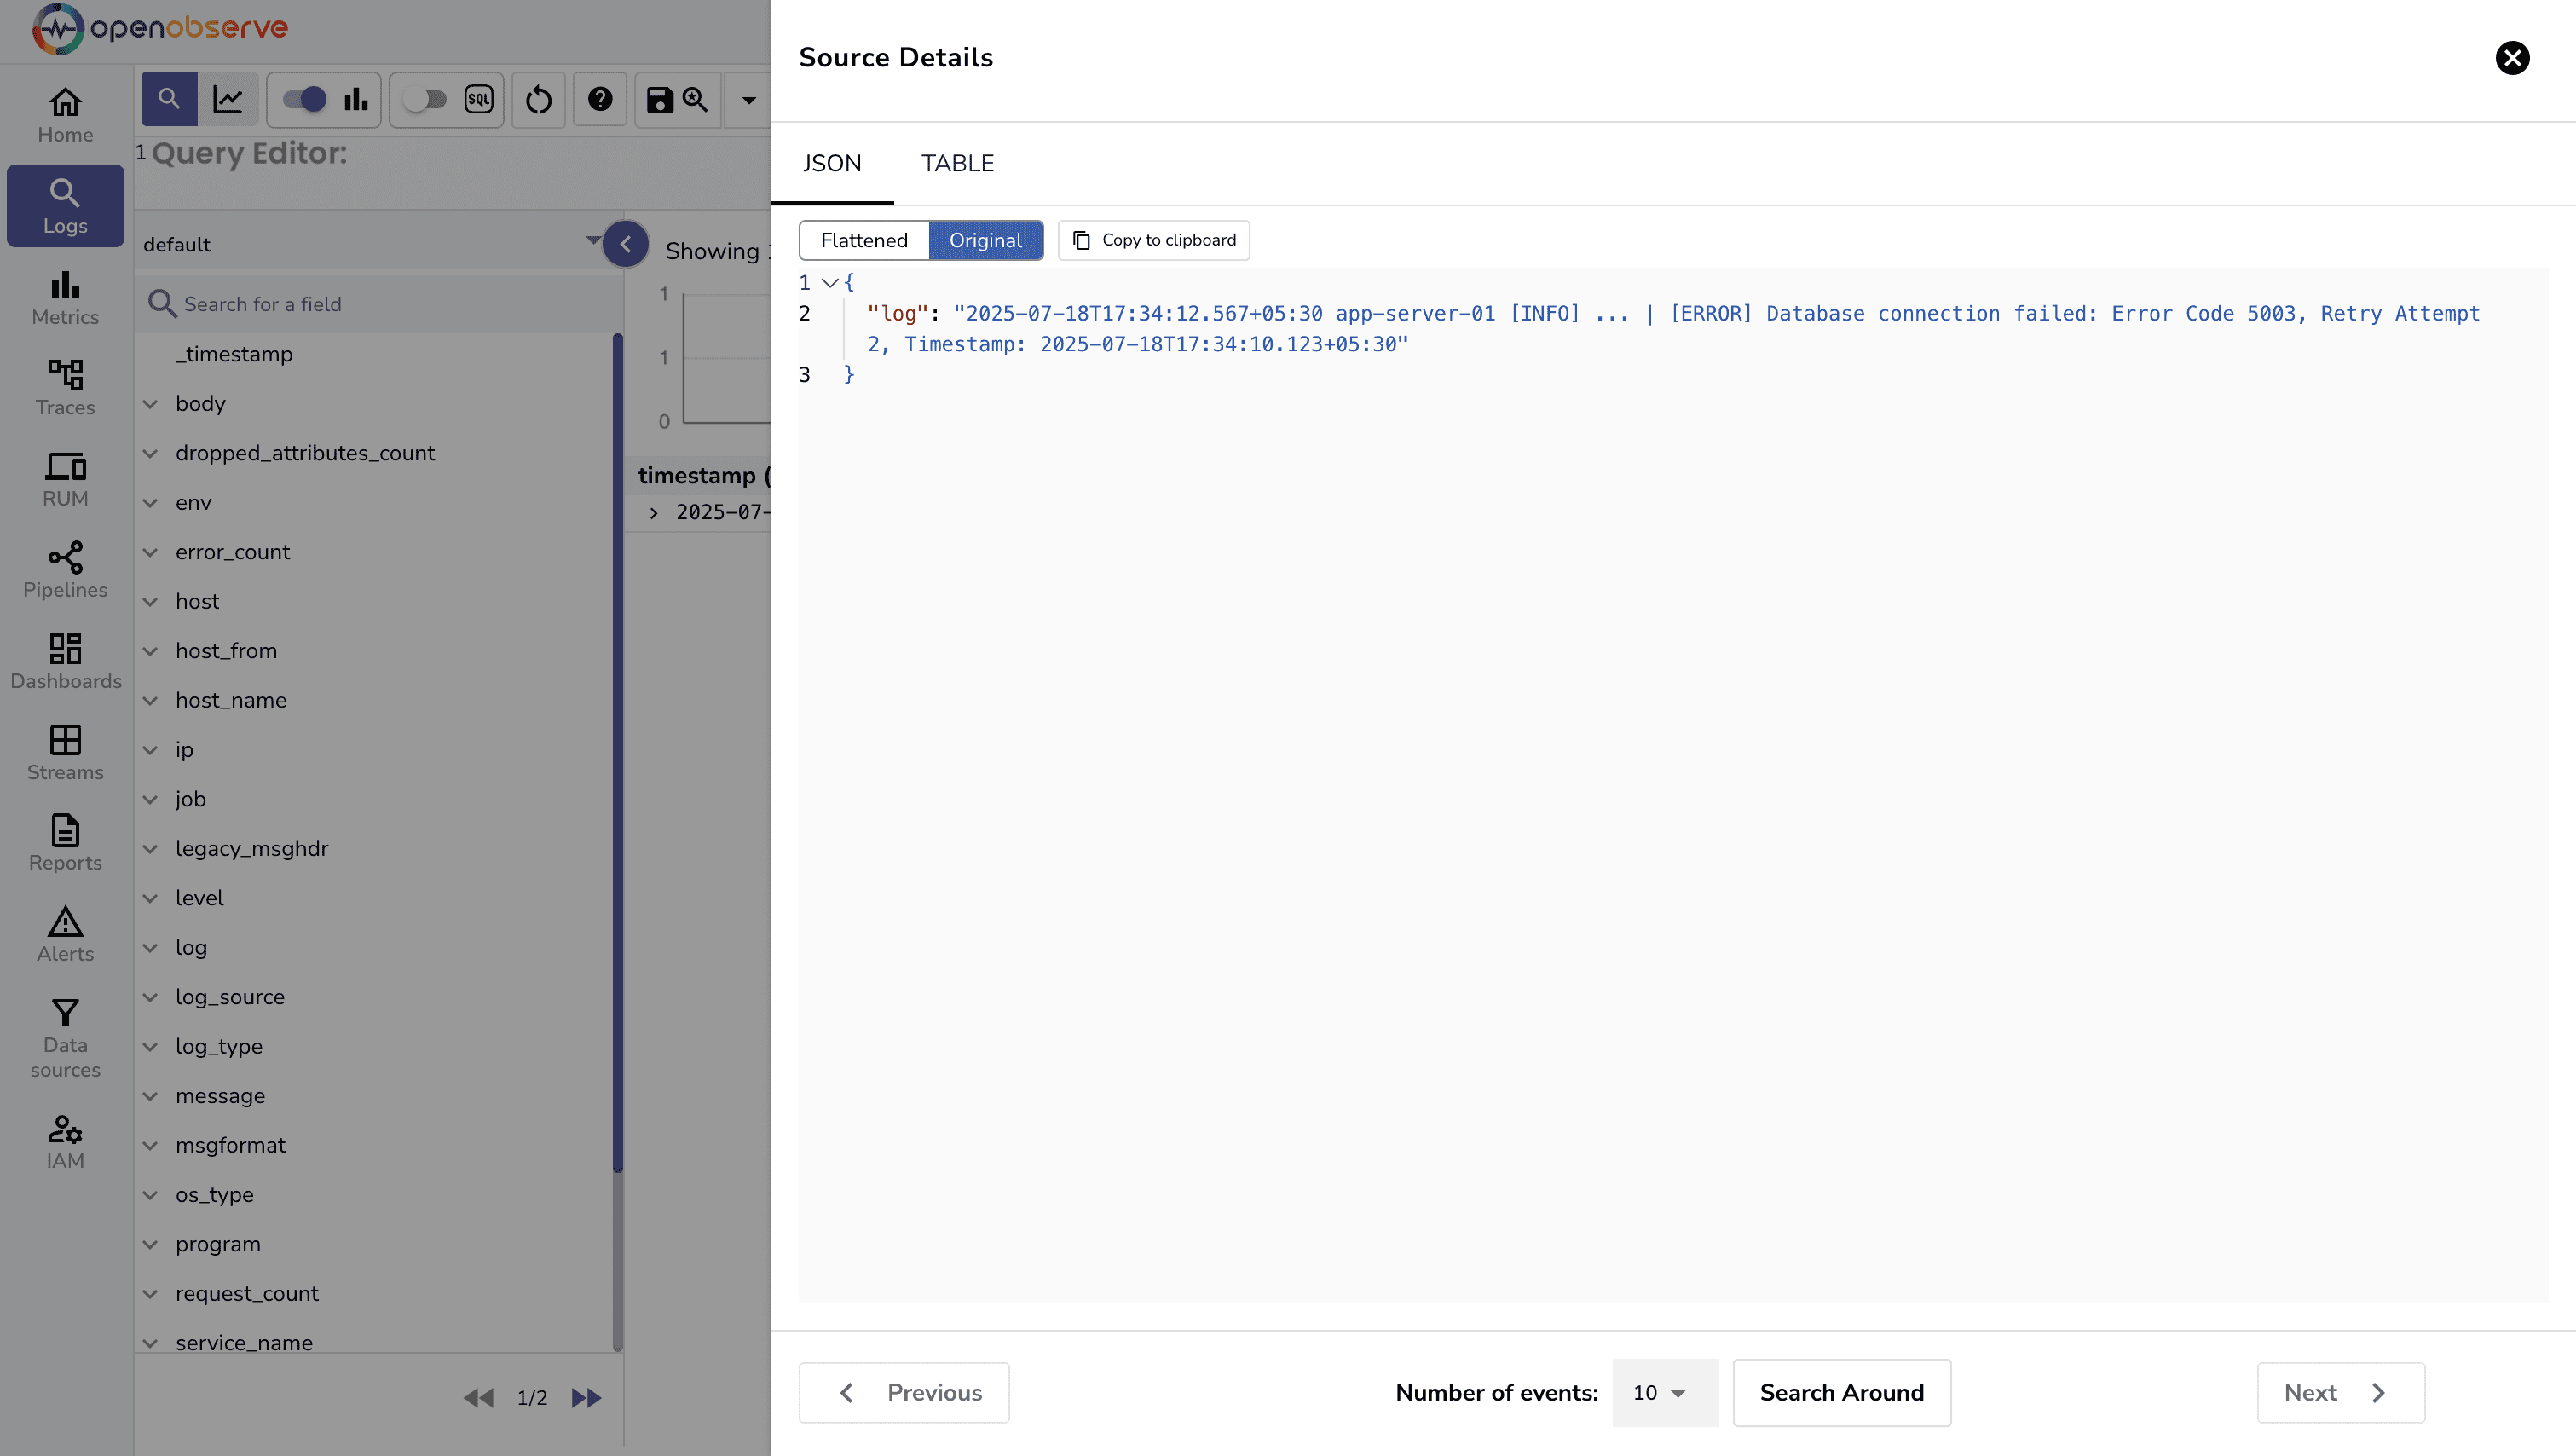
Here’s what a raw JSON sample log looks like in the OpenObserve UI before any parsing magic happens.
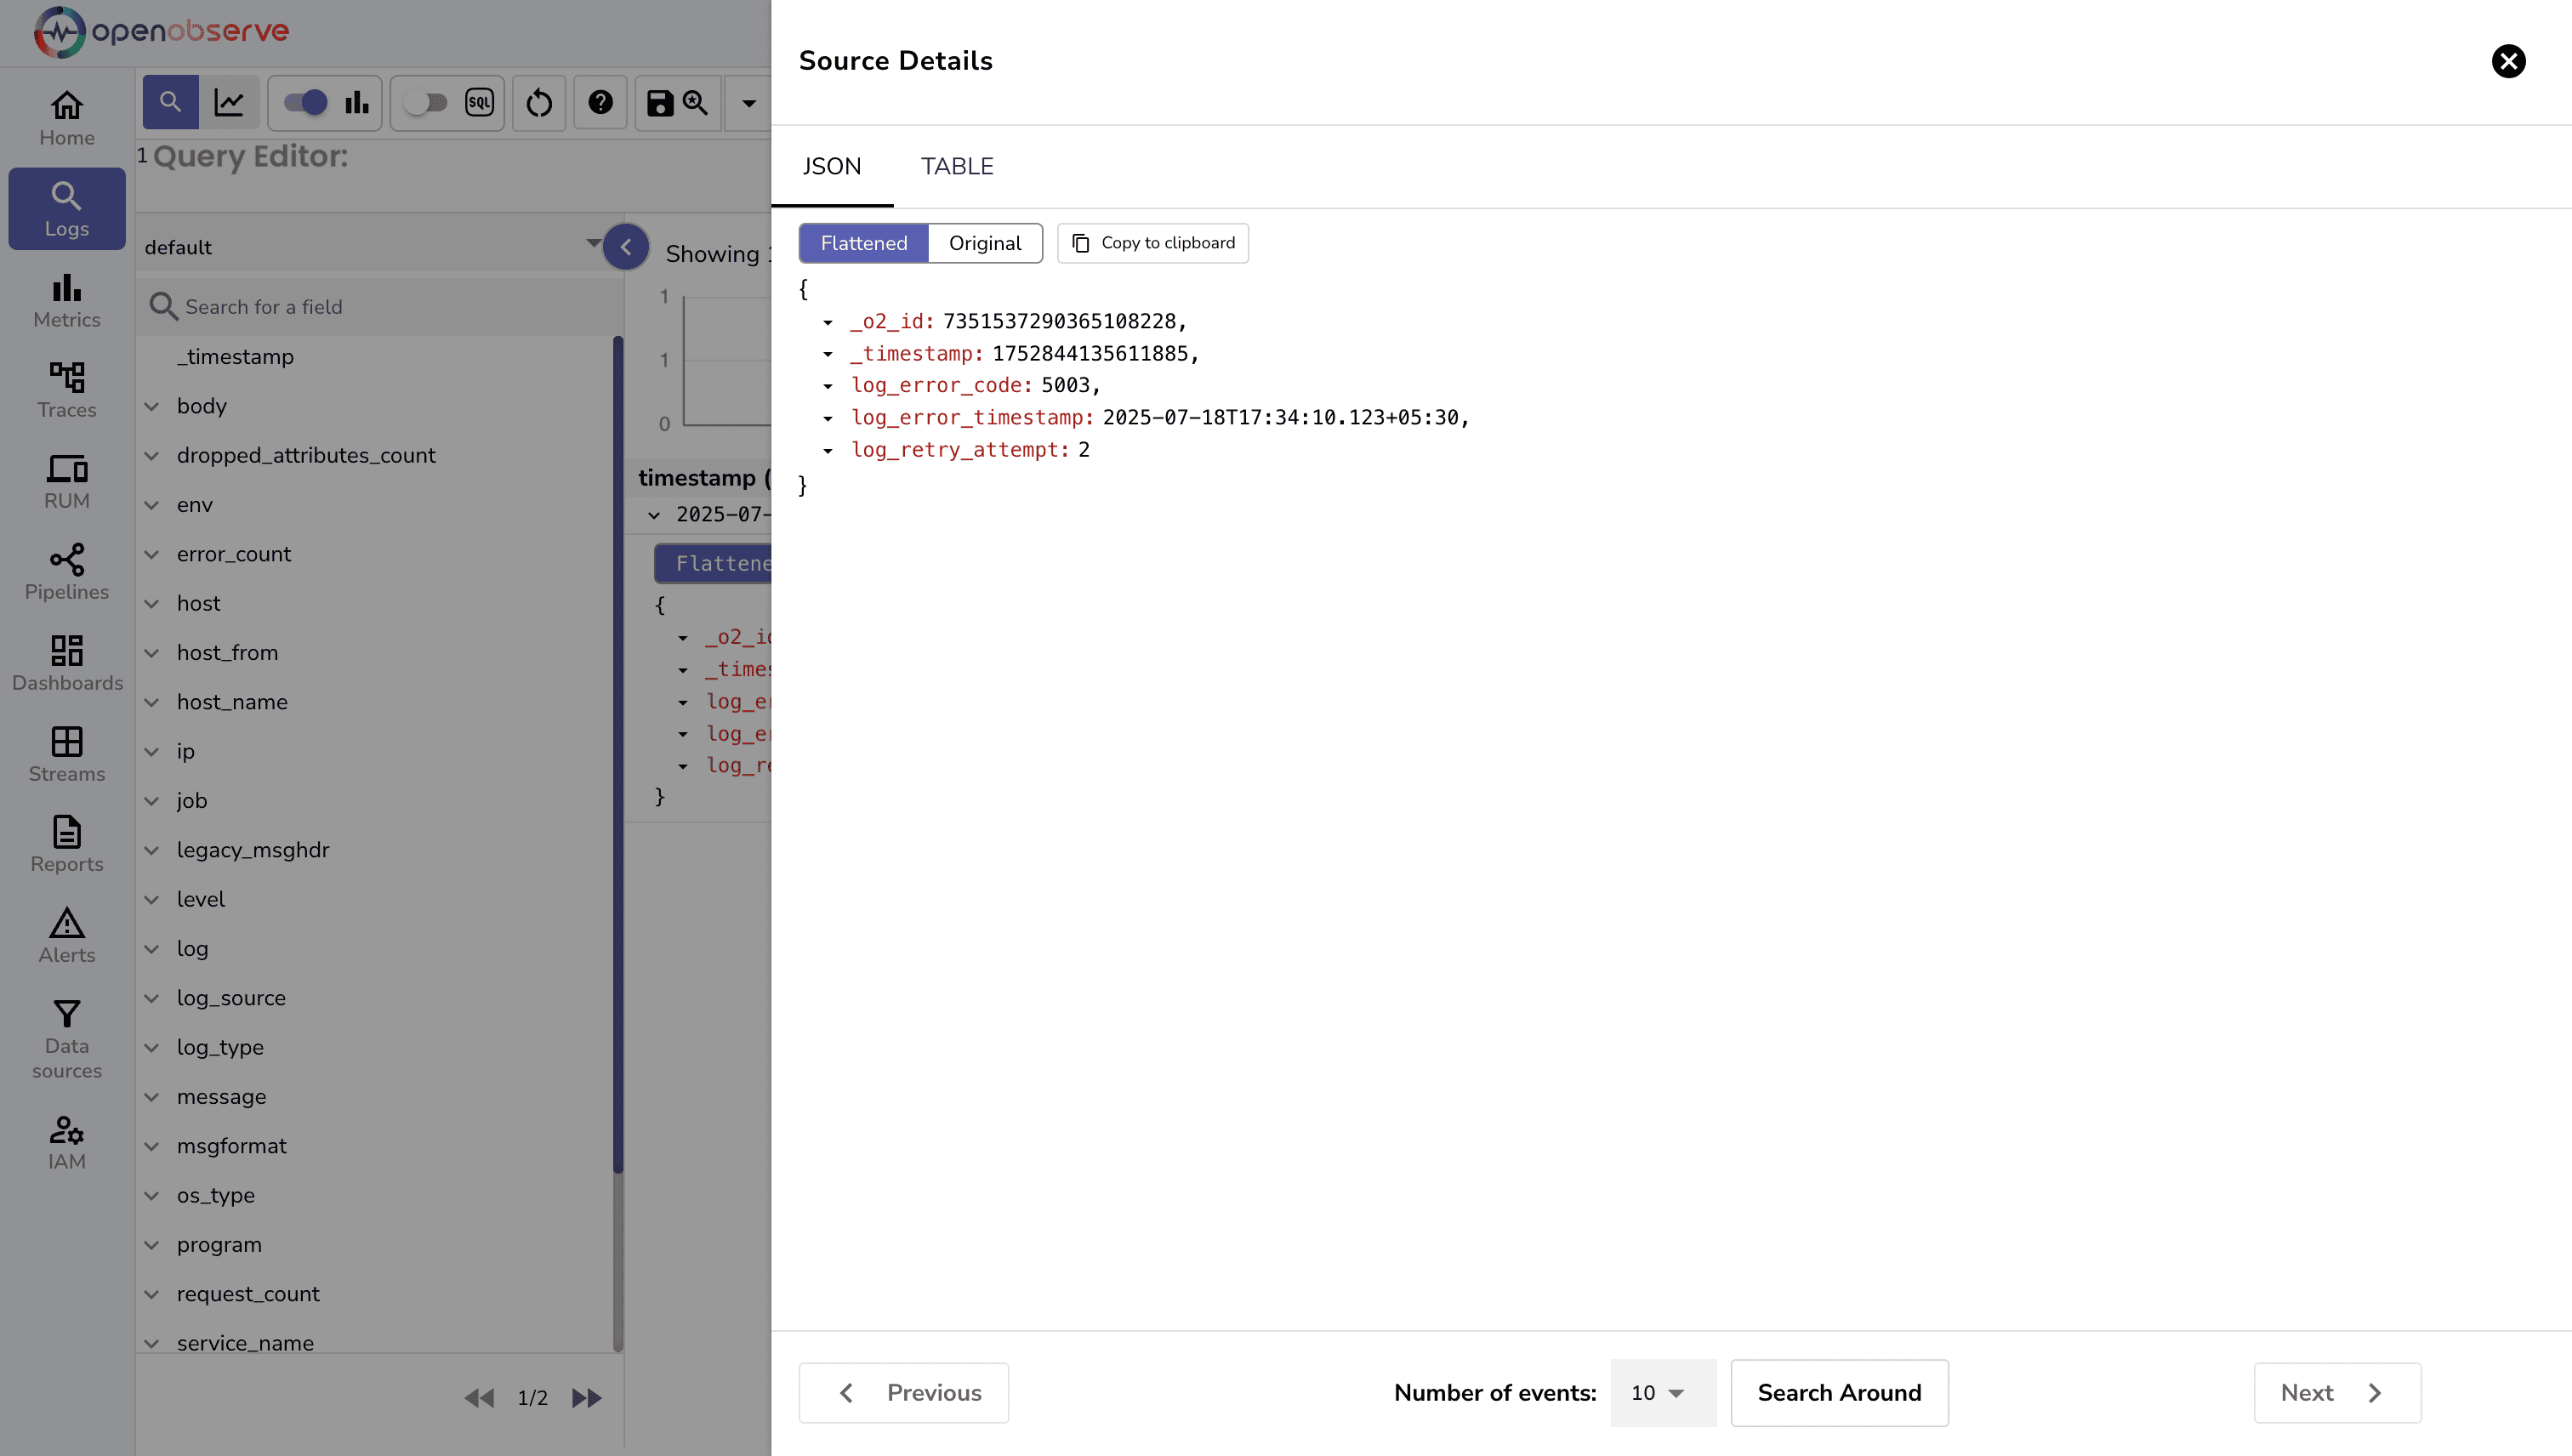
After running through a pipeline, the same log is flattened into clean, structured fields in the OpenObserve UI-ready for querying and analysis.
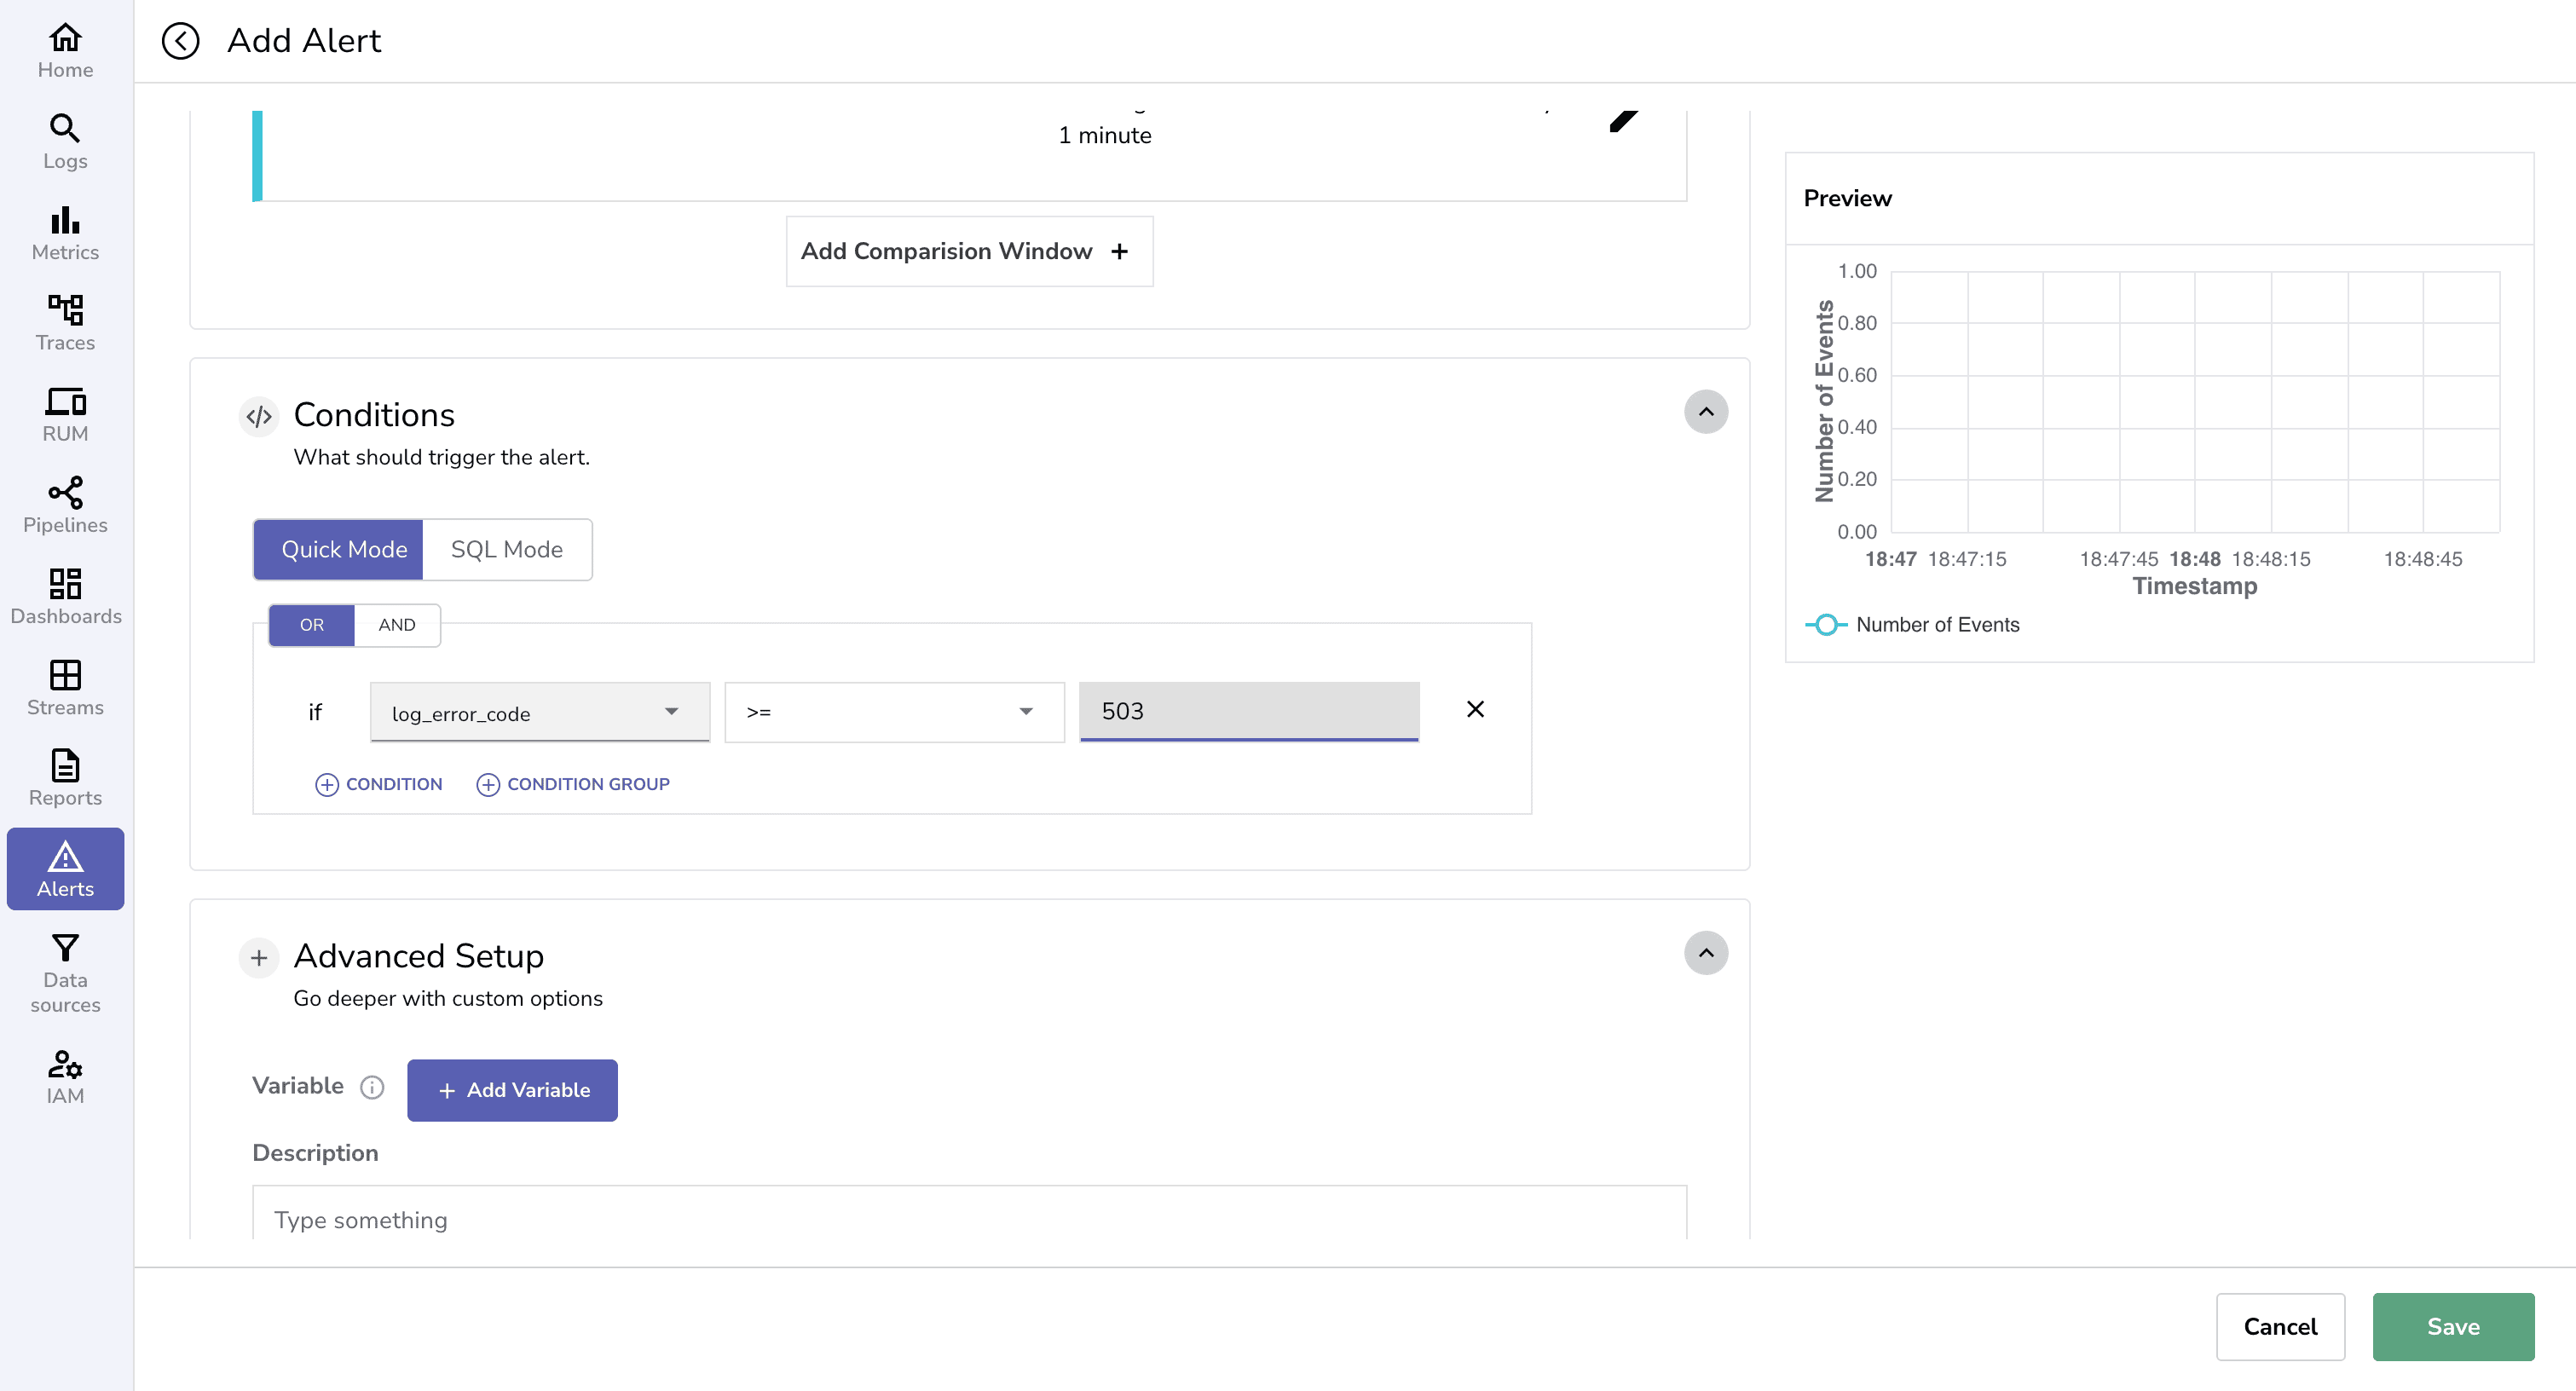
Then you can configure alerts using a new field created by parsing logs with VRL in a pipeline, so you’re notified the moment specific conditions are triggered.
Ready to Get More from Your Logs?
Whether you’re collecting logs from IIS, NGINX, containers, or cloud services, OpenObserve makes it simple to parse, search, and act on your log data.
- Get an OpenObserve Demo
- Learn more about log pipelines
- Read about alerting and dashboards
Related blogs
Get started today and experience the power of OSS log observability that doesn’t break the bank.
About the Author
Manas Sharma


Manas is a passionate Dev and Cloud Advocate with a strong focus on cloud-native technologies, including observability, cloud, kubernetes, and opensource. building bridges between tech and community.
Follow OpenObserve on Google
Add OpenObserve as a preferred source to see more of our articles in Google Search and Top Stories.













