How to Set Up Telegraf with OpenObserve for Easy Metrics Collection




Ready to get started?
Try OpenObserve Cloud today for more efficient and performant observability.
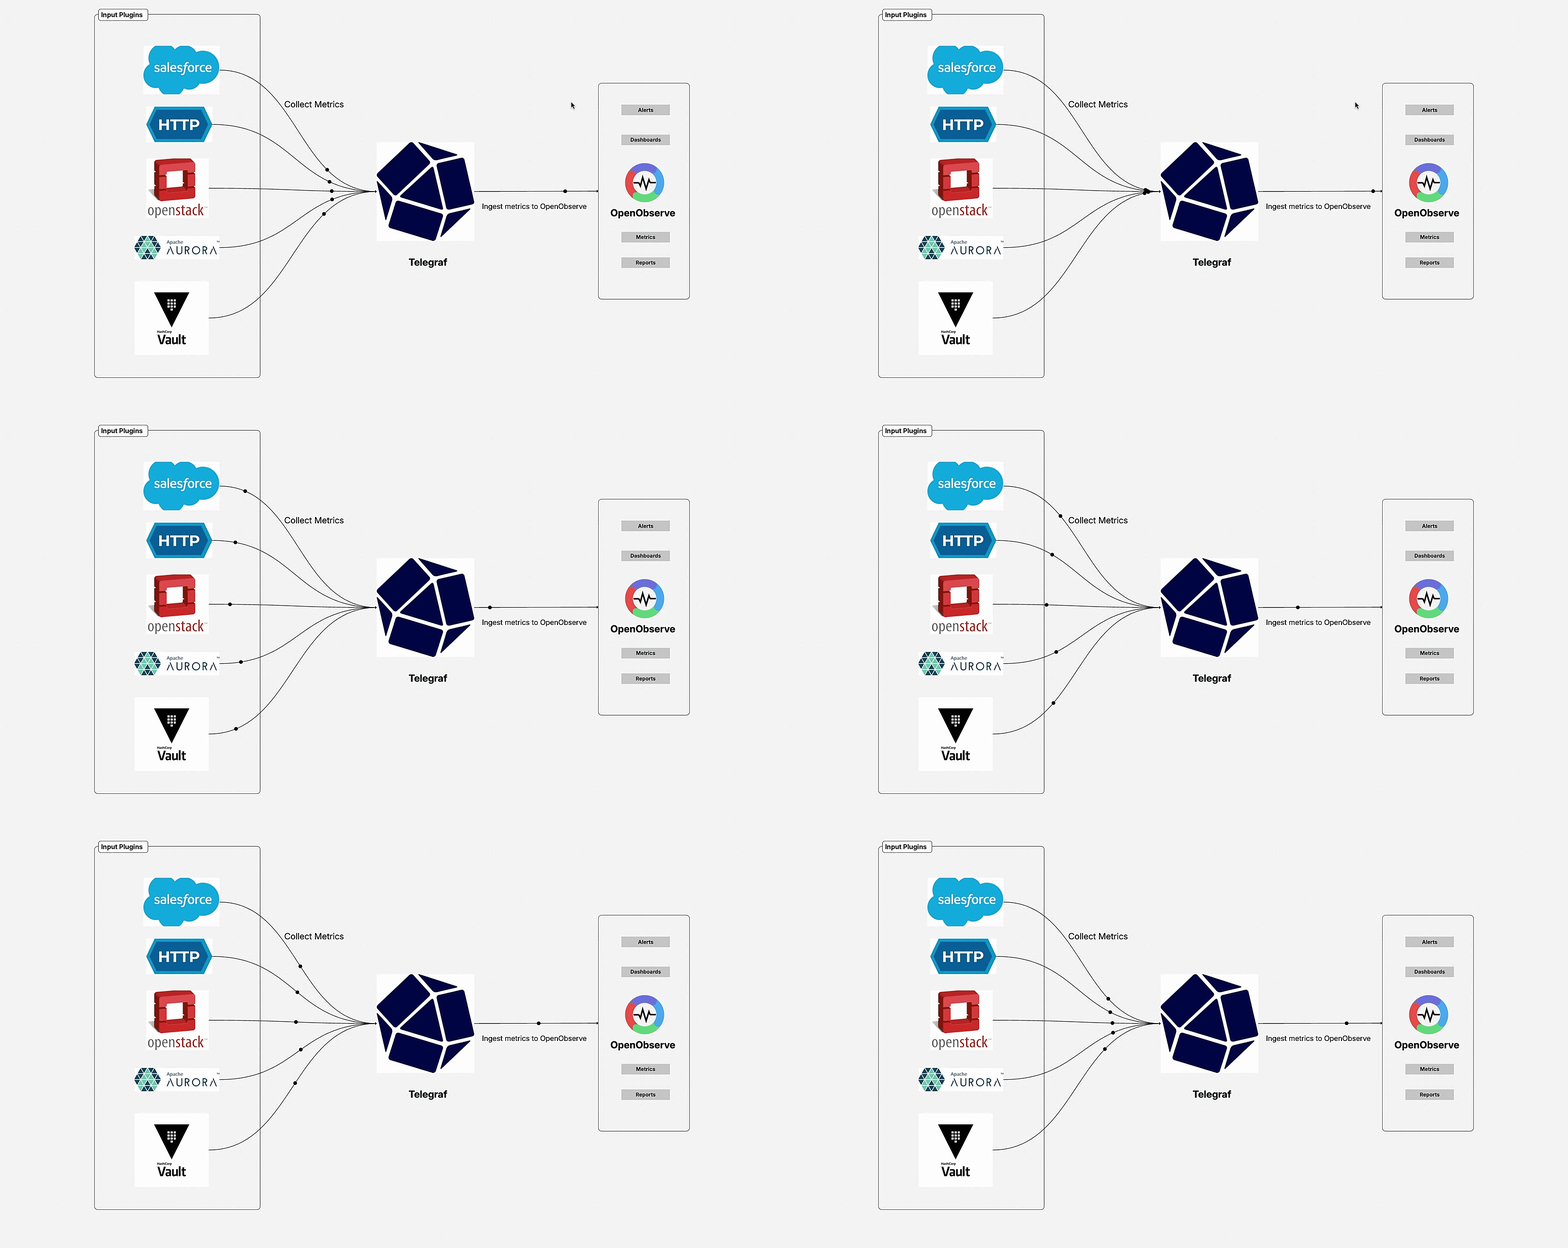
How to Set Up Telegraf with OpenObserve for Easy Metrics Collection
If you're diving into improving your metrics monitoring, tracking everything from HTTP endpoints to system resources and third party services, you're in for a real treat. In this guide, we're diving into the seamless integration of Telegraf, a fantastic open source metrics collection agent, with OpenObserve, a powerhouse observability platform. The focus? Making HTTP based metrics collection straightforward and efficient. Whether you're tracking system performance, cloud resources, or application stats, this integration lets you stream data seamlessly without the hassle.
We'll cover the basics of each tool, why they pair so well, and a hands on setup. By the end, you'll have a working pipeline that's easy to tweak. Let's get started, it's simpler than you think!
Understanding Telegraf and OpenObserve
What is Telegraf?
Telegraf is a modern, open source agent written in Go that collects, processes, and writes metrics from virtually any source. Developed by InfluxData, it's your universal metrics collection tool that can gather data from host systems (CPU, memory, disk), applications (HTTP endpoints, databases), cloud services (AWS CloudWatch, Azure Monitor), and custom sources.
What makes Telegraf special is its plugin driven architecture. With over 300 input plugins and 50+ output plugins, it adapts to any monitoring scenario. The Telegraf HTTP output plugin is particularly powerful for sending metrics to observability platforms like OpenObserve. It runs as a single binary, making deployment across different environments straightforward.
For comprehensive documentation on Telegraf's capabilities, visit the official Telegraf documentation.
What is OpenObserve?
OpenObserve is a powerful, open source observability platform built in Rust that efficiently stores and analyzes logs, metrics, and traces. It's designed as a cost effective alternative to traditional observability solutions, offering high performance through and memory efficiency, advanced compression that reduces storage costs by up to 90%, and support for multiple ingestion protocols including HTTP, gRPC, Kafka, and OTLP.
The platform provides flexible querying with SQL and PromQL support, real time dashboards with customizable visualizations and alerting, and the scalability to handle petabyte scale data.
Why This Combination Works Well
Telegraf and OpenObserve work together really well because they complement each other perfectly. Here's what makes this pairing so effective:
- Ease of Use: Telegraf's HTTP output plugin sends metrics directly to OpenObserve's ingestion API, no extra agents needed.
- Flexibility: Reuse existing Telegraf setups for system or app metrics, then stream them to OpenObserve for dashboards, alerts, and long term retention.
- Benefits: Batching for efficiency, TLS for security, compression to save bandwidth, and authentication support. It's great for scenarios like IoT health monitoring, deployment canaries, or multi tenant billing.
- Developer Friendly: This setup gives you real time insights without the overhead. You can debug issues faster and make smarter scaling decisions. It's straightforward to set up Telegraf with OpenObserve by pointing the Prometheus input and HTTP remote write output to your OpenObserve ingest URL, then open dashboards to visualize HTTP endpoint performance and wire up alerts.
Prerequisites
Before we begin, ensure you have:
- An OpenObserve account (self hosted or cloud; sign up at OpenObserve Cloud). We'll use the cloud version for this guide
- Basic Command Line Knowledge: Familiarity with terminal/command prompt
- HTTP Endpoint: A sample application or service to monitor (we'll create one)
Installation and Setup (Step-by-Step)
On Linux (Ubuntu/Debian):
# Add InfluxData repository
wget -qO- https://repos.influxdata.com/influxdb.key | sudo apt-key add -
echo "deb https://repos.influxdata.com/ubuntu $(lsb_release -cs) stable" | sudo tee /etc/apt/sources.list.d/influxdb.list

# Install Telegraf
sudo apt-get update && sudo apt-get install telegraf
On macOS:
# Using Homebrew
brew install telegraf
On Windows:
Download the Windows installer from the official Telegraf releases page.
Verify Installation
telegraf --version
You should see output similar to:
Telegraf 1.28.0 (git: HEAD 12345678)
Understanding Telegraf Configuration TOML
Telegraf uses TOML (Tom's Obvious, Minimal Language) configuration files. The configuration is divided into several sections:
- Global Tags: Applied to all metrics
- Agent: Telegraf runtime settings
- Input Plugins: Data collection sources
- Output Plugins: Data destinations
- Processors: Data transformation and filtering
Basic Configuration Structure
# Global tags can be specified here in key="value" format.
[global_tags]
  # dc = "us-east-1" # will tag all metrics with dc=us-east-1
  # rack = "1a"
  # environment = "production"

# Configuration for telegraf agent
[agent]
  interval = "10s"
  round_interval = true
  metric_batch_size = 1000
  metric_buffer_limit = 10000
  collection_jitter = "0s"
  flush_interval = "10s"
  flush_jitter = "0s"
  precision = ""
  hostname = ""
  omit_hostname = false
Practical Demo Setup
For this guide, we'll create a demo sample HTTP application that emits metrics in Prometheus format. This will help you understand how Telegraf collects metrics from HTTP endpoints and sends them to OpenObserve for visualization and analysis.
Step 1: Create a Sample HTTP Service
Let's create a simple HTTP service to monitor. Create a file called sample_service.py:
#!/usr/bin/env python3
import http.server
import socketserver
import time
import random
import json
from datetime import datetime

class MetricsHandler(http.server.BaseHTTPRequestHandler):
    def do_GET(self):
        if self.path == '/metrics':
            self.send_response(200)
            self.send_header('Content-type', 'text/plain')
            self.end_headers()

            # Generate sample metrics
            cpu_usage = random.uniform(10, 90)
            memory_usage = random.uniform(20, 80)
            response_time = random.uniform(50, 500)

            metrics = f"""# HELP http_requests_total Total number of HTTP requests
# TYPE http_requests_total counter
http_requests_total{{method="GET",status="200"}} {random.randint(100, 1000)}

# HELP cpu_usage_percent CPU usage percentage
# TYPE cpu_usage_percent gauge
cpu_usage_percent{{host="localhost"}} {cpu_usage}

# HELP memory_usage_percent Memory usage percentage
# TYPE memory_usage_percent gauge
memory_usage_percent{{host="localhost"}} {memory_usage}

# HELP http_request_duration_seconds HTTP request duration
# TYPE http_request_duration_seconds histogram
http_request_duration_seconds_bucket{{le="0.1"}} {random.randint(50, 200)}
http_request_duration_seconds_bucket{{le="0.5"}} {random.randint(200, 500)}
http_request_duration_seconds_bucket{{le="1.0"}} {random.randint(500, 800)}
http_request_duration_seconds_bucket{{le="+Inf"}} {random.randint(800, 1000)}
http_request_duration_seconds_sum {random.uniform(100, 1000)}
http_request_duration_seconds_count {random.randint(800, 1000)}
"""
            self.wfile.write(metrics.encode())
        else:
            self.send_response(404)
            self.end_headers()

if __name__ == "__main__":
    PORT = 8080
    with socketserver.TCPServer(("", PORT), MetricsHandler) as httpd:
        print(f"Server running on port {PORT}")
        httpd.serve_forever()
Run the service:
python3 sample_service.py
Step 2: Configure Telegraf for HTTP Metrics Collection
Create a comprehensive Telegraf configuration file called telegraf.conf:
# Global tags
[global_tags]
  environment = "development"
  service = "http-metrics"

# Agent configuration
[agent]
  interval = "10s"
  round_interval = true
  metric_batch_size = 1000
  metric_buffer_limit = 10000
  collection_jitter = "0s"
  flush_interval = "10s"
  flush_jitter = "0s"
  precision = ""
  hostname = ""
  omit_hostname = false

# Input plugins
[[inputs.prometheus]]
  urls = ["http://localhost:8080/metrics"]
  metric_version = 2
  response_timeout = "5s"
  follow_redirects = true

[[inputs.cpu]]
  percpu = true
  totalcpu = true
  collect_cpu_time = false
  report_active = false

[[inputs.mem]]
  # No additional configuration needed

[[inputs.disk]]
  ignore_fs = ["tmpfs", "devtmpfs", "devfs", "iso9660", "overlay", "aufs", "squashfs"]

[[inputs.diskio]]
  # No additional configuration needed

[[inputs.net]]
  # No additional configuration needed

[[inputs.http_response]]
  urls = ["http://localhost:8080/metrics"]
  response_timeout = "5s"
  method = "GET"
  follow_redirects = true
  [inputs.http_response.tags]
    endpoint = "metrics"

# Output plugin for OpenObserve
[[outputs.http]]
  url = "https://api.openobserve.ai/api/YOUR_ORG_NAME/prometheus/api/v1/write"
  method = "POST"
  data_format = "prometheusremotewrite"
  content_encoding = "snappy"

  [outputs.http.headers]
    Content-Type = "application/x-protobuf"
    Content-Encoding = "snappy"
    X-Prometheus-Remote-Write-Version = "0.1.0"
    Authorization = "Basic YOUR_BASE64_ENCODED_CREDENTIALS"
Step 3: Configure OpenObserve Credentials
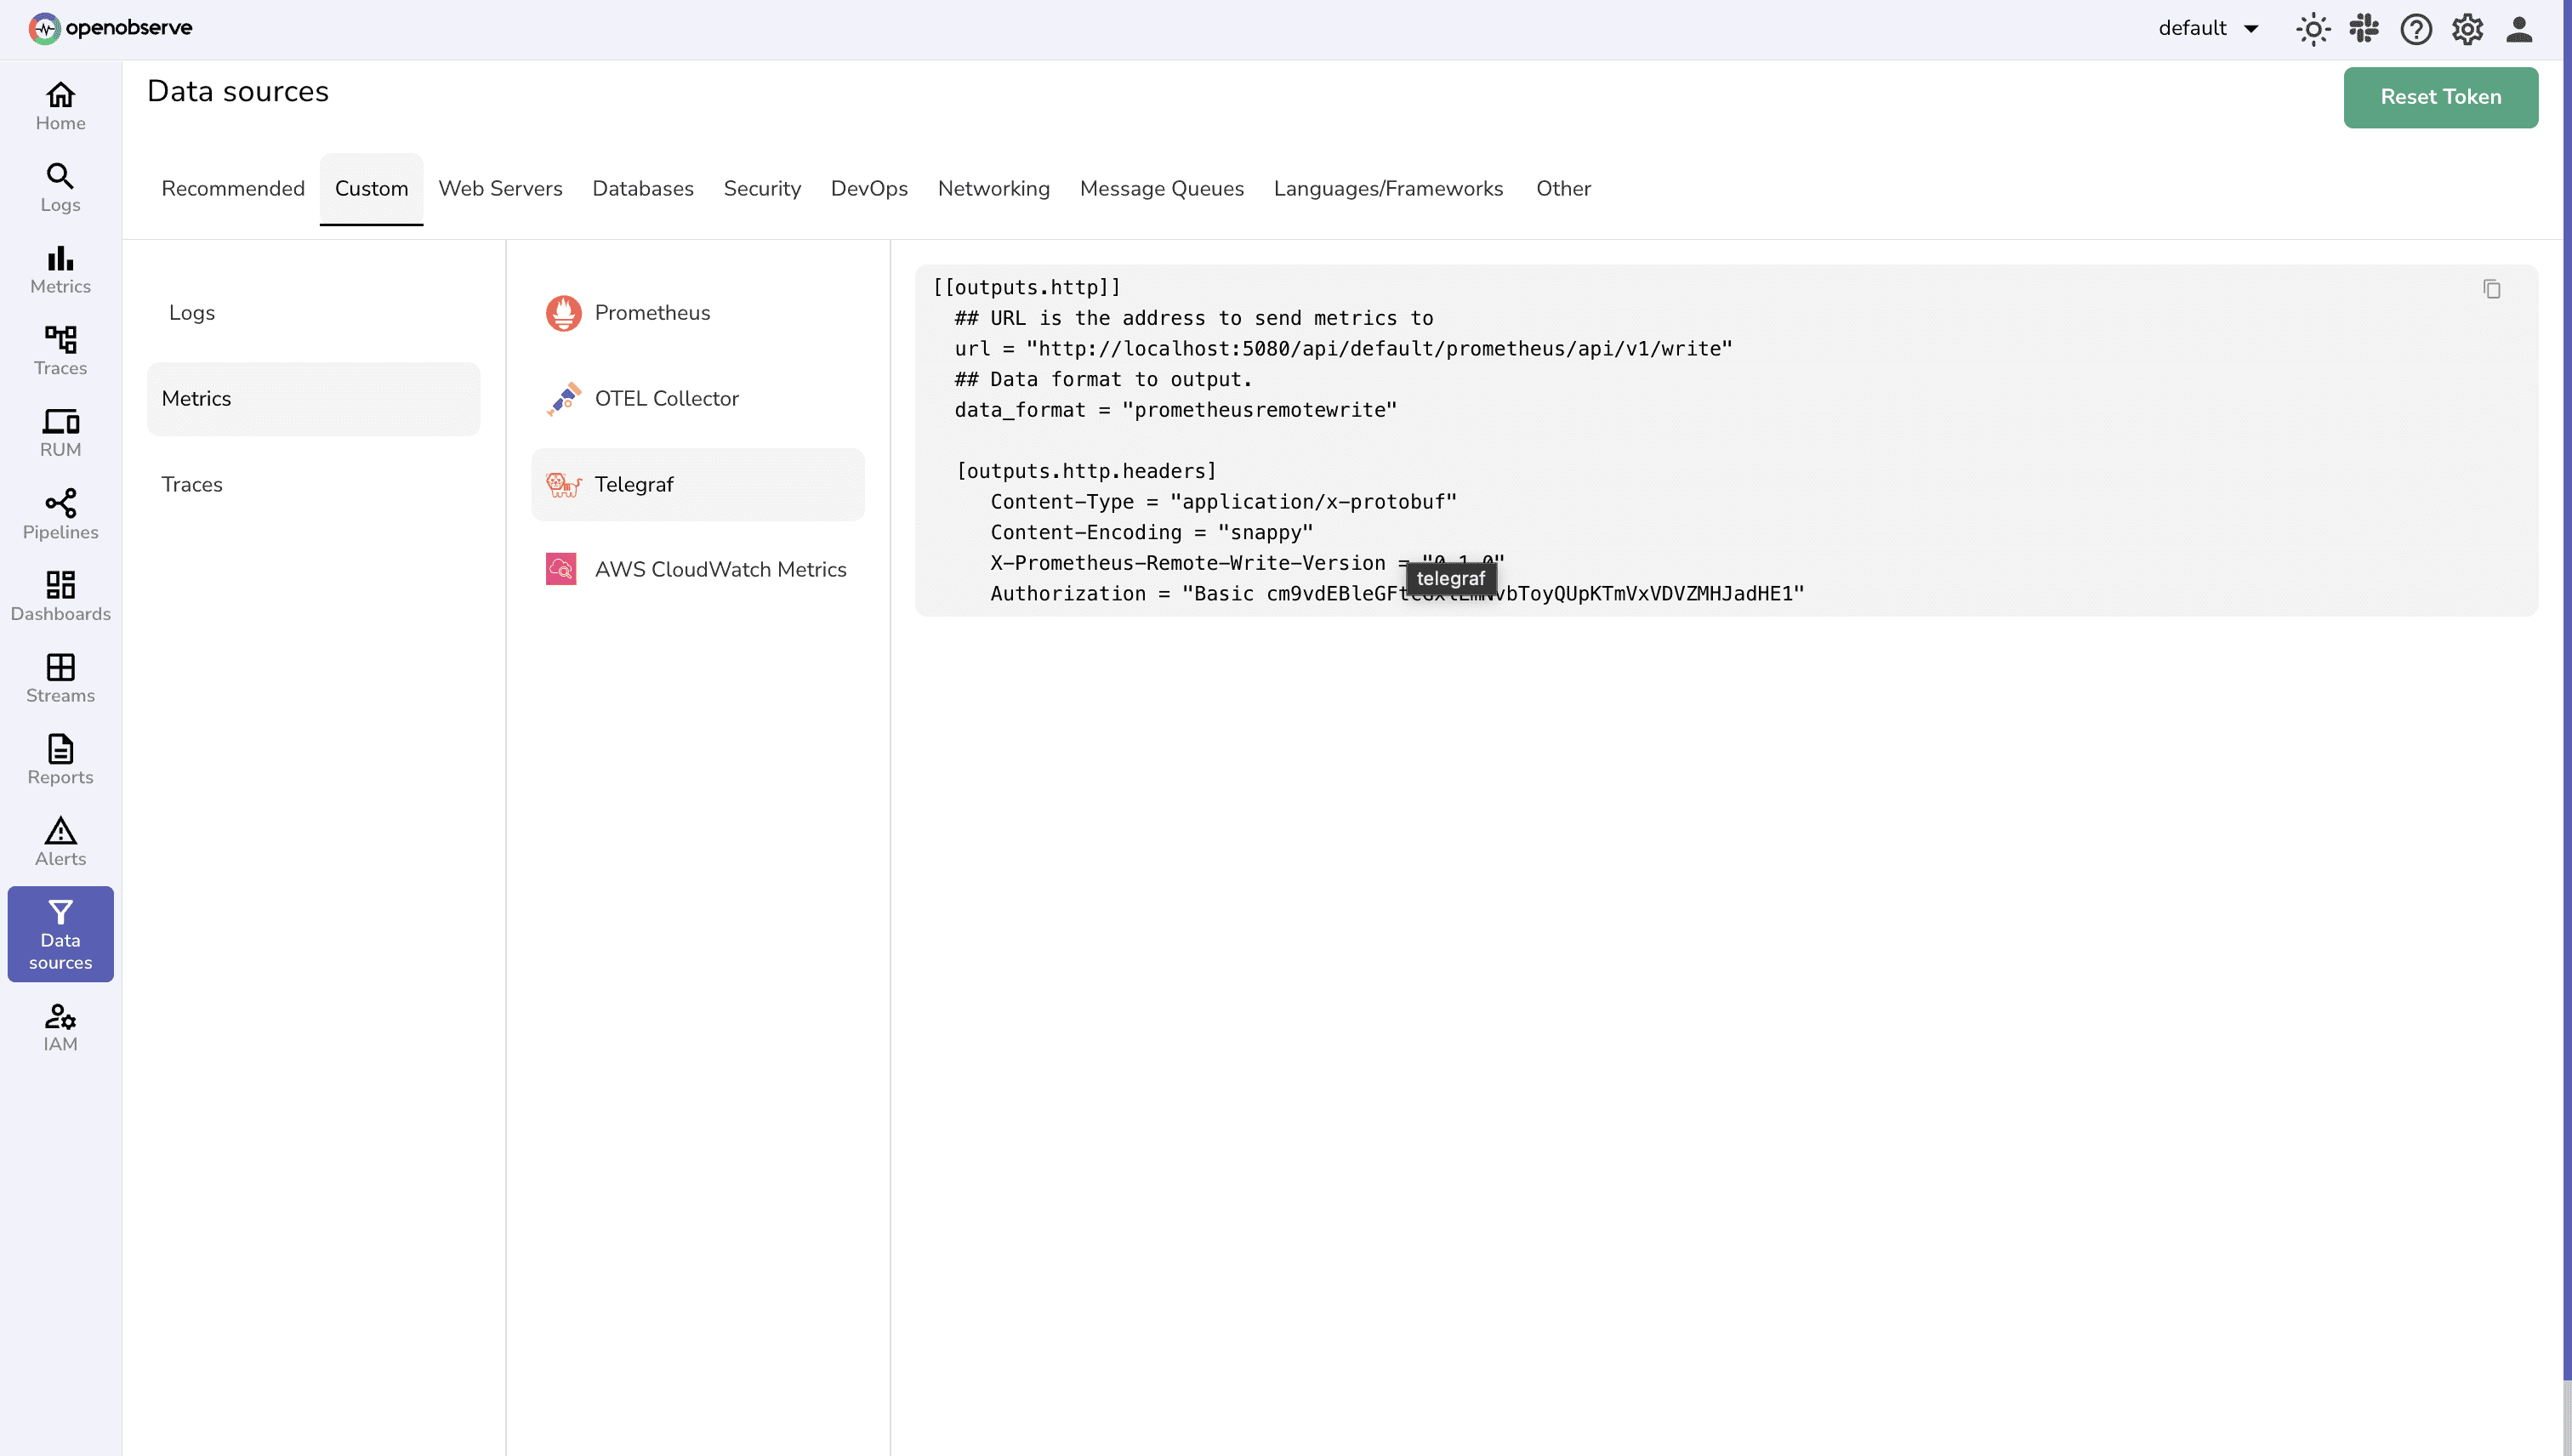
You can get the exact configuration for your OpenObserve instance from the UI by navigating to Data Sources > Custom Tab > Metrics > Telegraf. This will provide you with the complete configuration including your organization URL and authentication credentials.
Step 4: Start Telegraf
# Test the configuration first
telegraf --config telegraf.conf --test

# Start Telegraf in the background
telegraf --config telegraf.conf --daemon
Step 5: Verify Data Flow
- Check Telegraf Logs:
tail -f /var/log/telegraf/telegraf.log
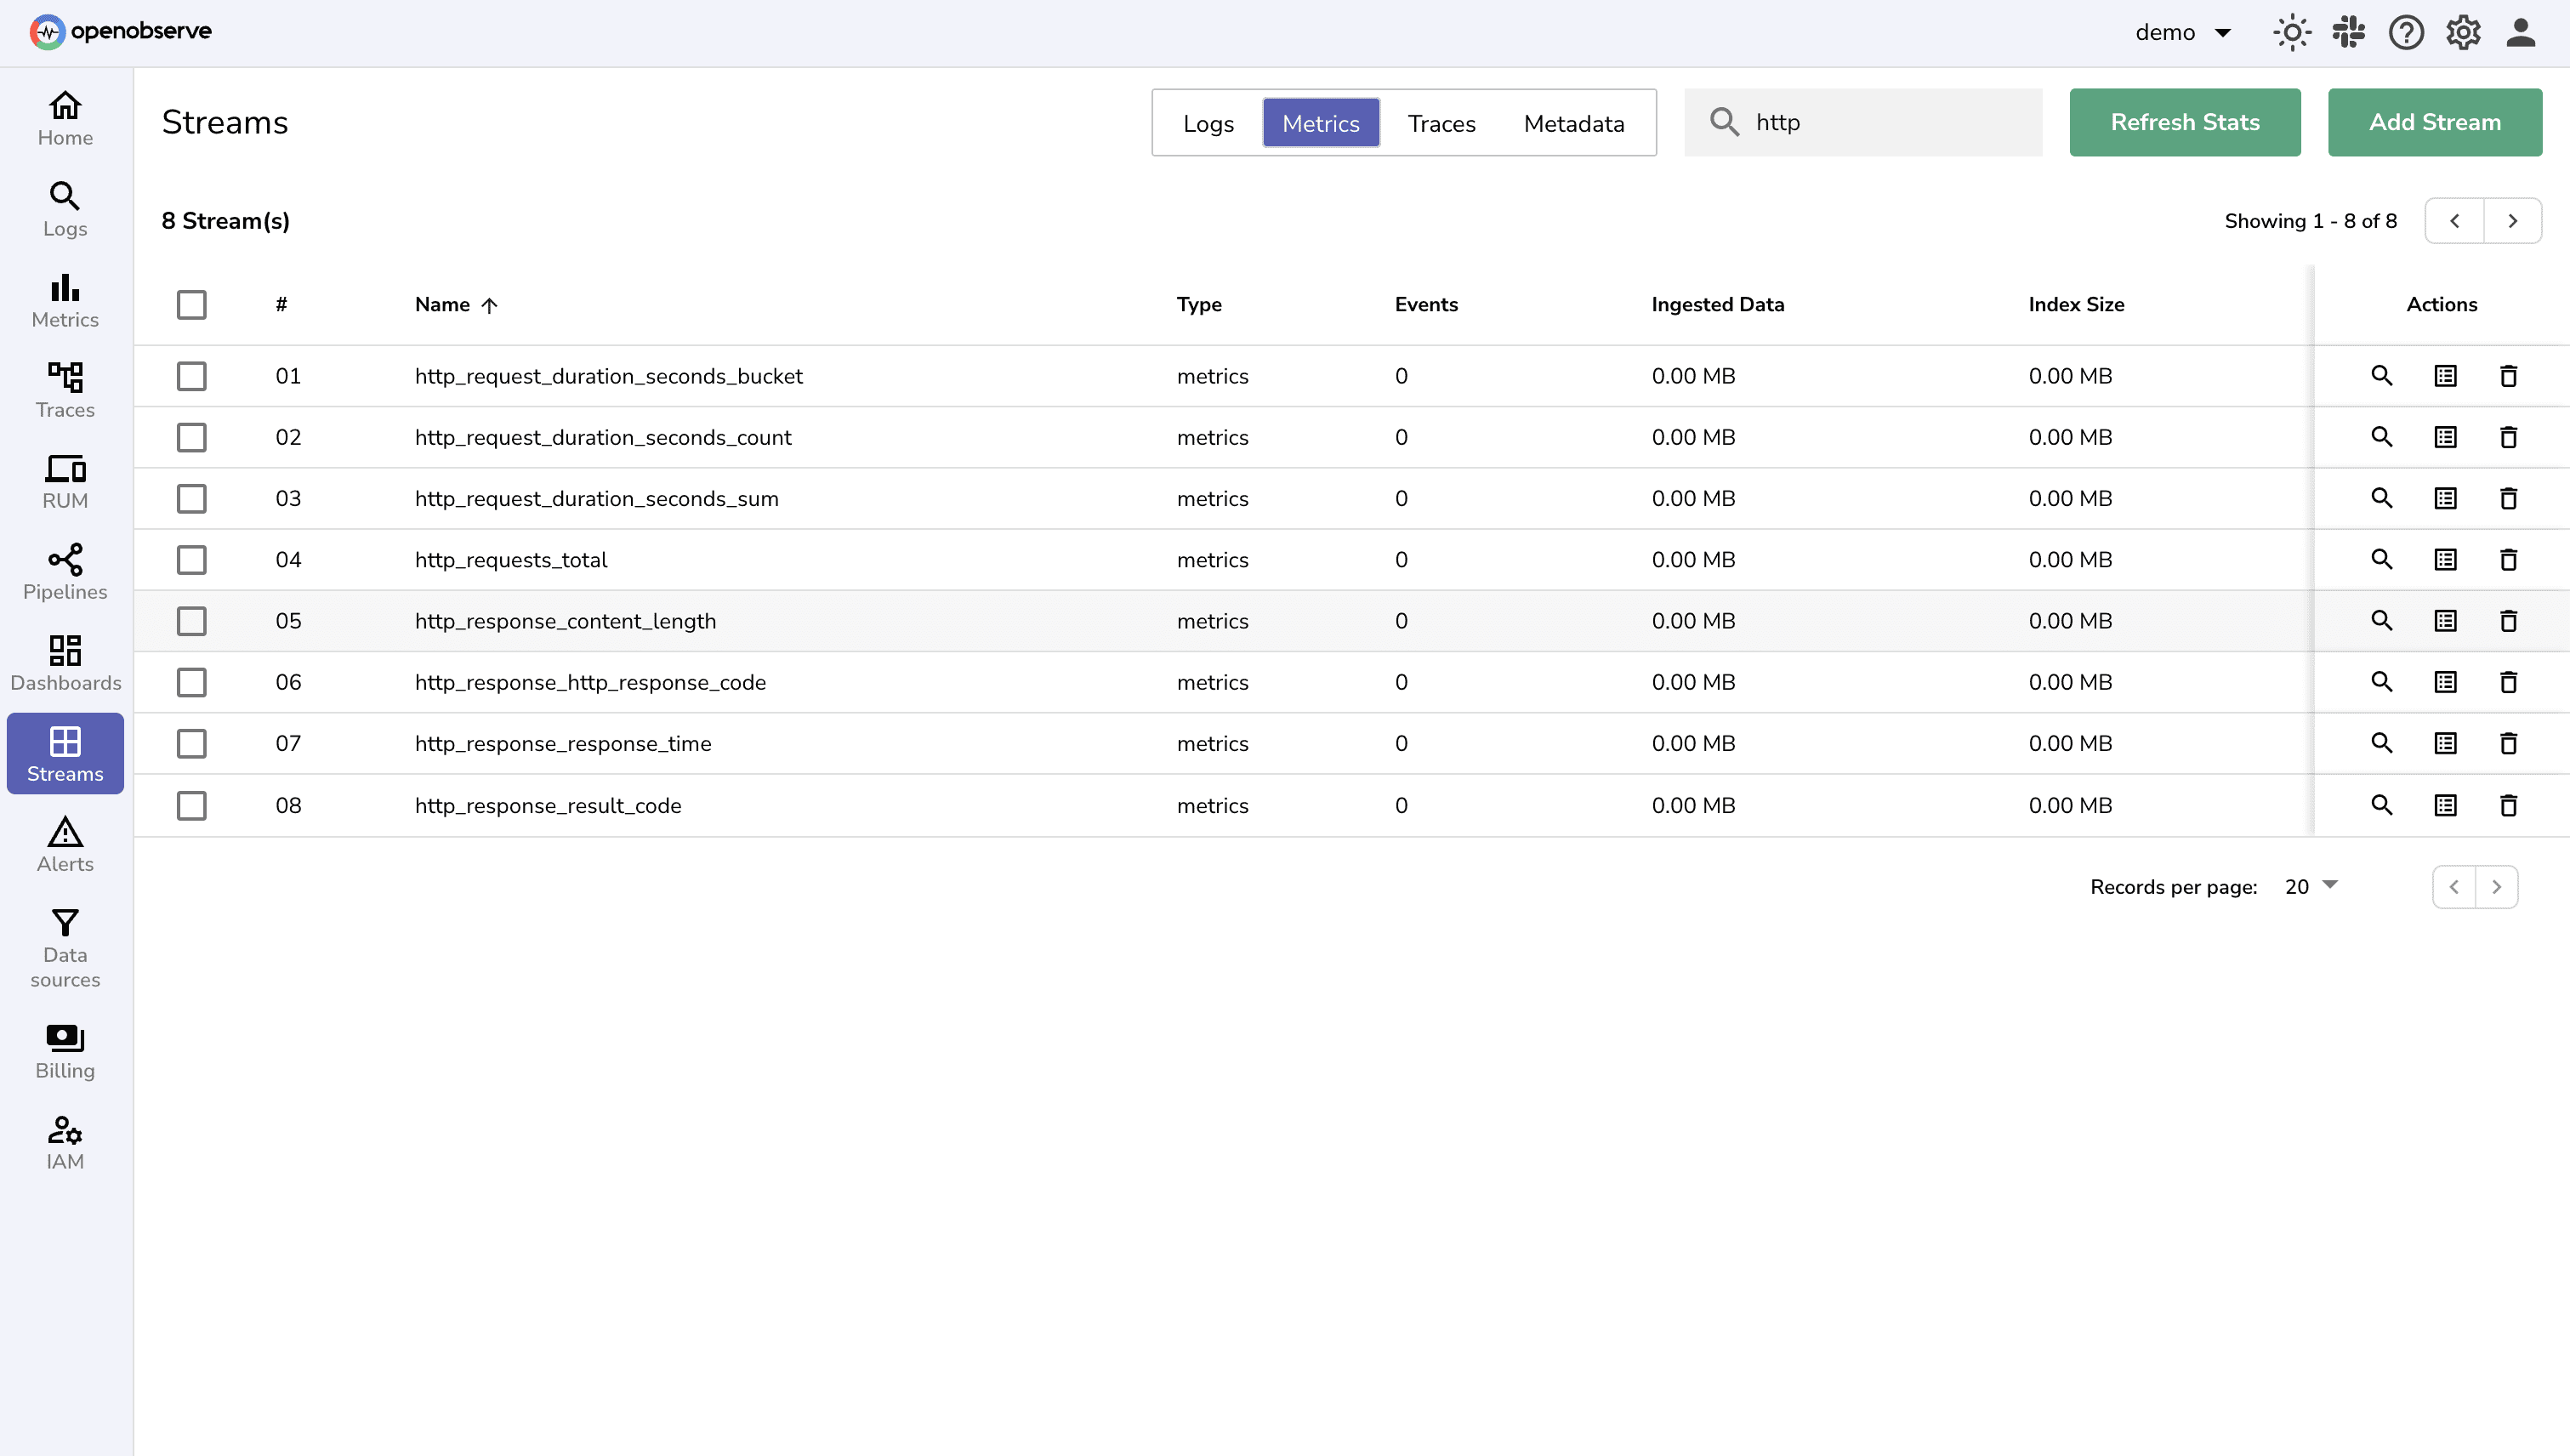
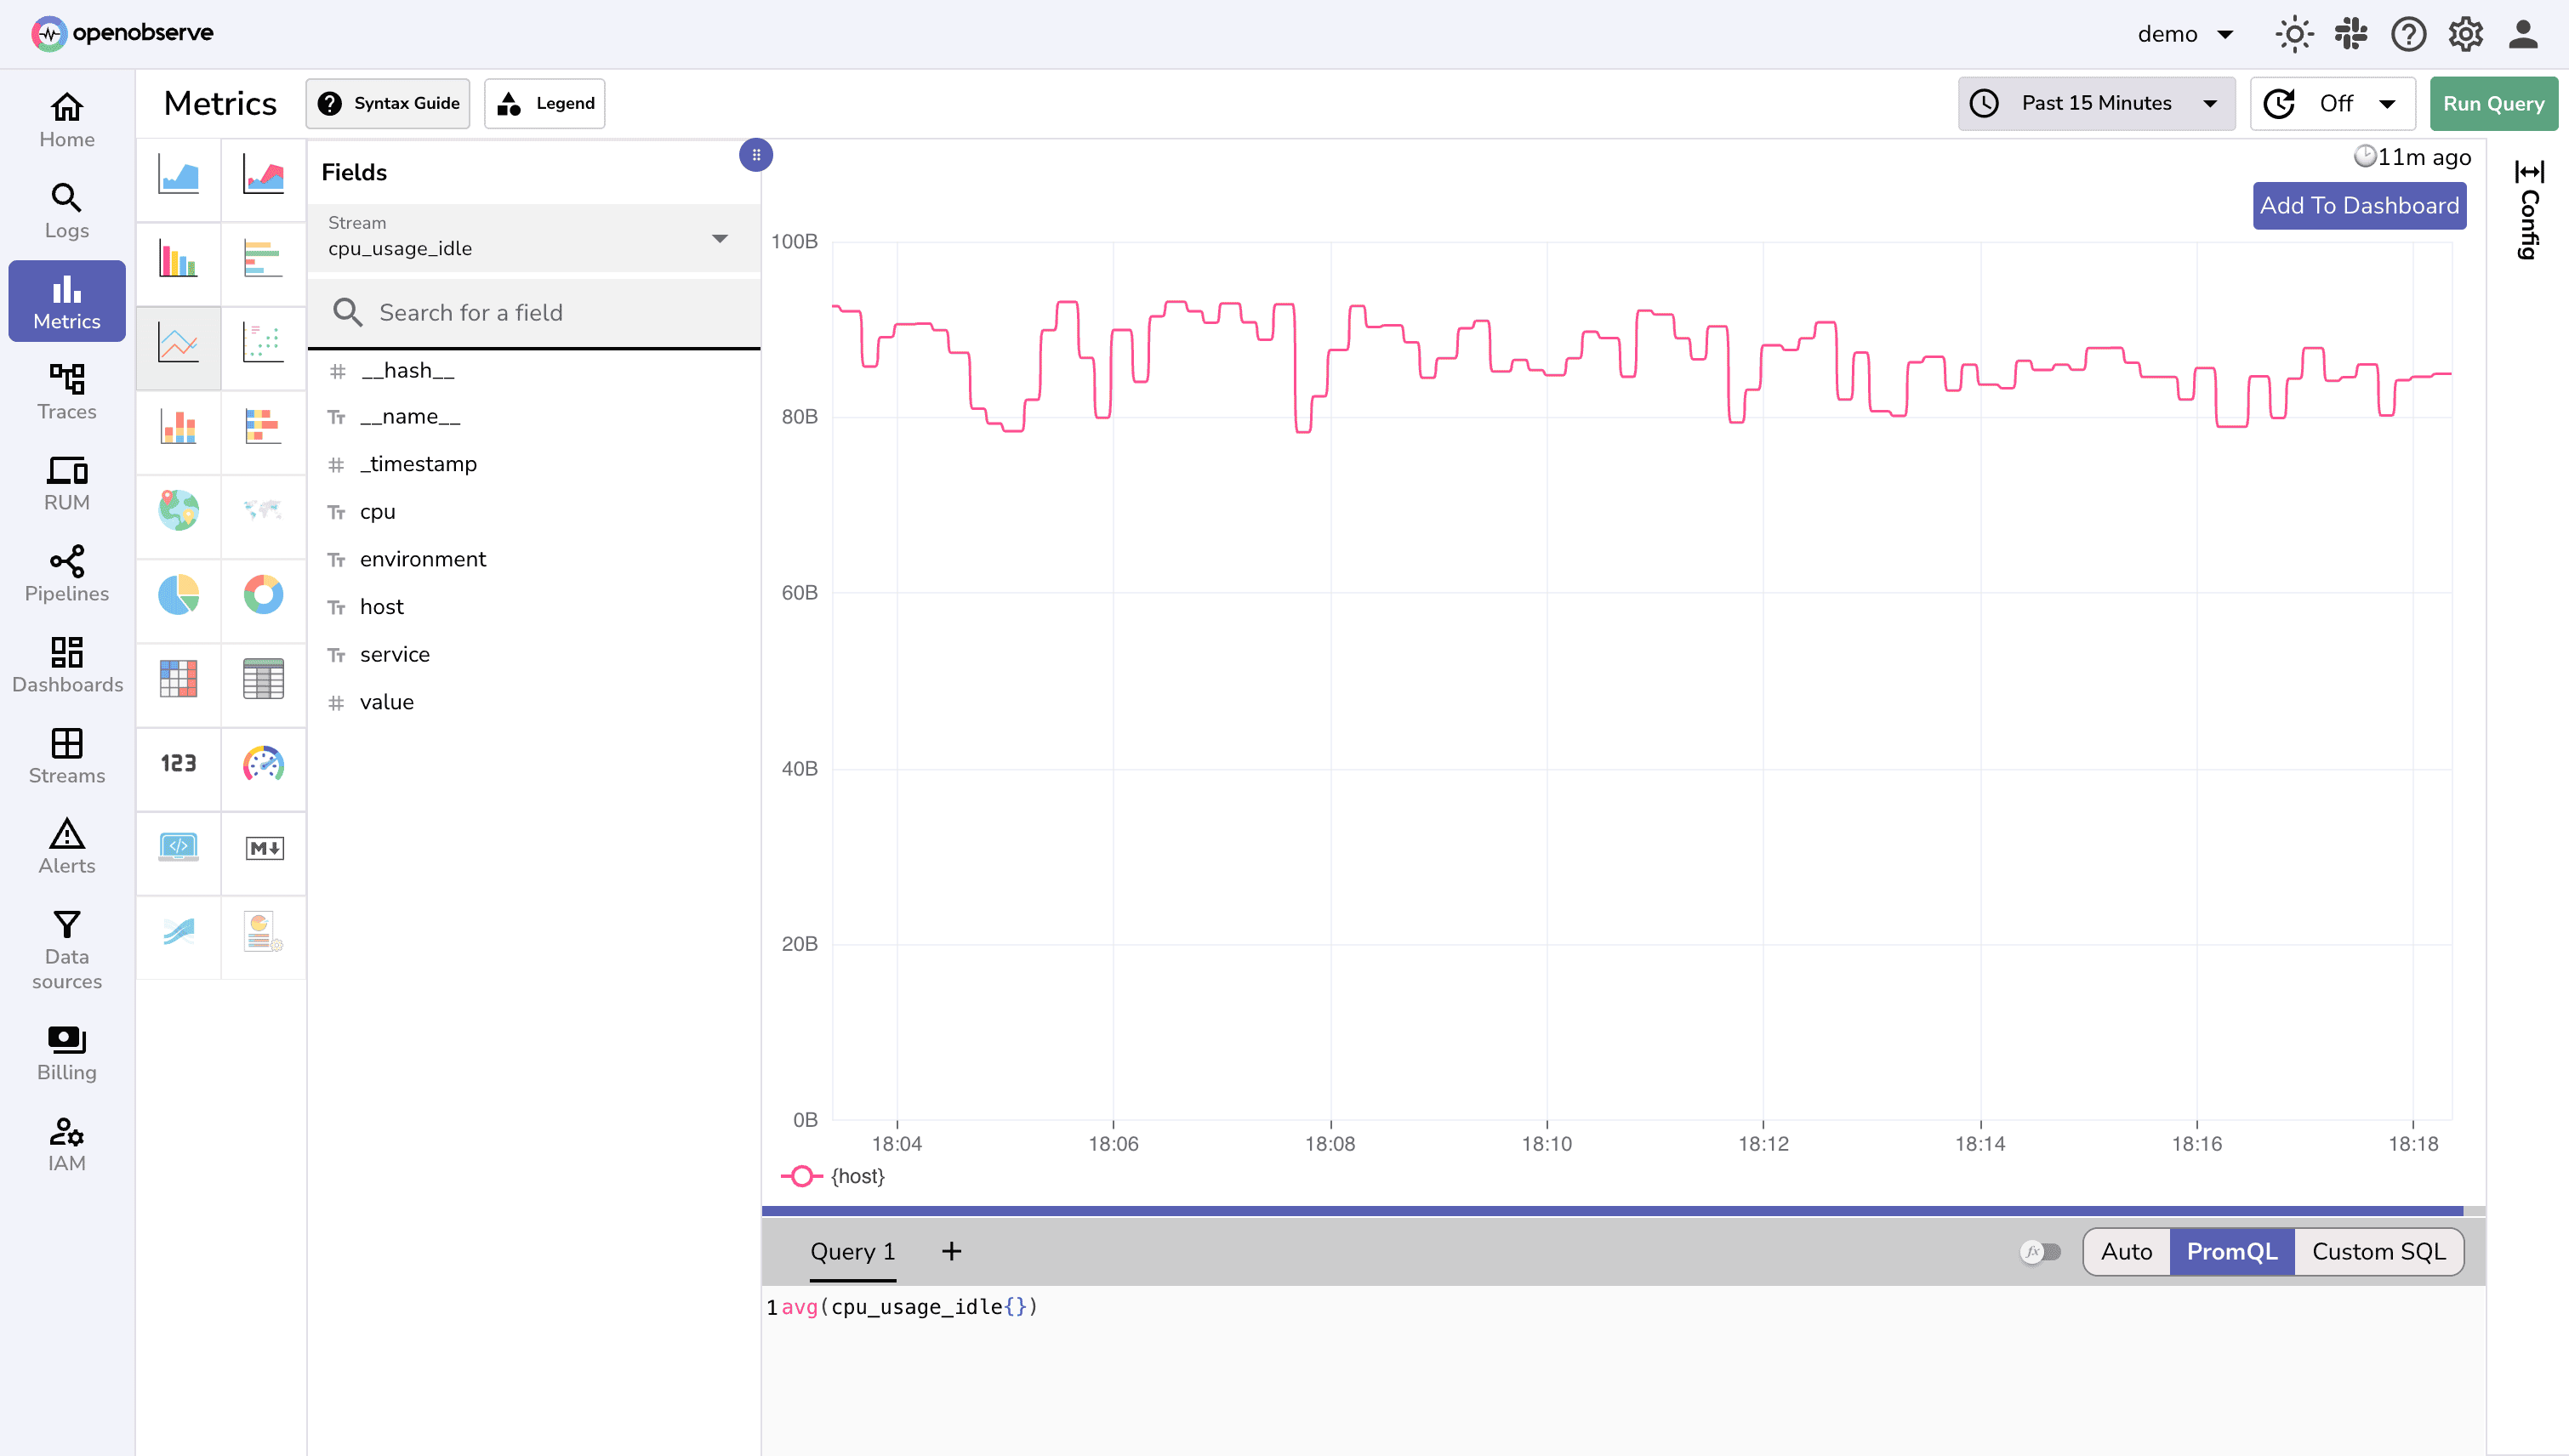
- Visualize metrics in OpenObserve :
- Log into your OpenObserve account
- Navigate to the Metrics Explorer
- Look for metrics like
cpu_usage_idle,memory_usage_percent, andhttp_requests_total
Extensive Integration Ecosystem
The power of Telegraf lies in its extensive plugin ecosystem. By using Telegraf, you can integrate OpenObserve with over 300 different tools and protocols, making it a universal observability solution.
Whether you need to monitor databases, cloud services, containers, or custom applications, Telegraf likely has a plugin for it. Some popular integrations include:
- Databases: PostgreSQL, MySQL, MongoDB, Redis, InfluxDB
- Cloud Services: AWS CloudWatch, Azure Monitor, Google Cloud Monitoring
- Containers: Docker, Kubernetes, containerd
- Web Servers: Nginx, Apache HTTP Server, HAProxy
- Message Queues: RabbitMQ, Apache Kafka, NATS
- System Metrics: CPU, Memory, Disk, Network statistics
- Custom Applications: Any service exposing Prometheus metrics
To explore the complete list of available integrations and learn how to configure them, visit the InfluxData Integrations page for OpenObserve.
Common Issues and Solutions
Connection Refused Errors
Error: dial tcp: lookup by pg api.openobserve.ai: no such host
Solution: Verify your internet connection, check firewall settings, and ensure the OpenObserve URL is correct.
401 Unauthorized Authentication Failures
Error: HTTP 401 Unauthorized
Solution: Verify your credentials are correct, ensure base64 encoding is properly formatted, and check if your OpenObserve account is active.
High Memory Usage
[agent]
  metric_buffer_limit = 5000
  flush_interval = "5s"
Solution: Reduce buffer size and flush more frequently.
Best Practices for Production
Configuration Management
- Use environment variables for sensitive data like credentials
- Keep configuration files in version control (excluding secrets)
- Split large configurations into multiple files for better maintainability
Performance Optimization
[agent]
  interval = "30s"              # Adjust collection interval based on needs
  metric_batch_size = 1000      # Optimize batch size
  metric_buffer_limit = 10000   # Set appropriate buffer limits
  flush_interval = "10s"        # Balance between latency and efficiency
Security Considerations
- Always use HTTPS for production environments
- Implement proper credential management using environment variables or secret management systems
- Set up appropriate firewall rules
- Keep Telegraf and OpenObserve updated regularly
Monitoring Telegraf Itself
[[inputs.internal]]
  # Monitor Telegraf's own performance
Data Retention and Storage
- Configure appropriate data retention policies in OpenObserve
- Leverage OpenObserve's built in compression capabilities
- Optimize indexing strategies for your query patterns
Conclusion and Next Steps
By following this guide, you've learned how to install and configure Telegraf, set up OpenObserve integration, monitor HTTP endpoints and system metrics, troubleshoot common issues, and implement best practices for production environments.
The combination of Telegraf's powerful collection capabilities and OpenObserve's efficient storage and analysis features creates a robust observability platform that can scale with your needs. Whether you're monitoring a single application or a complex microservices architecture, this setup provides the foundation for comprehensive system monitoring and alerting.
What's Next?
Now that you have a working setup, consider these next steps to expand your observability capabilities:
- Explore Advanced Plugins: Investigate Telegraf's extensive plugin ecosystem to monitor databases, cloud services, and custom applications
- Create Custom Dashboards: Build visualizations in OpenObserve to gain insights into your system performance
- Set Up Alerting: Configure alerts based on your metrics to proactively respond to issues
- Scale Your Setup: Deploy across multiple environments and regions for comprehensive coverage
- Integrate More Services: Use more of the 300+ available integrations to monitor your entire technology stack
Additional Resources
- Telegraf Documentation
- OpenObserve Documentation
- Telegraf Plugin Directory
- OpenObserve GitHub Repository
- Prometheus vs OpenTelemetry: Which Do You Need?
- Prometheus Alternatives for Metrics at Scale
Ready to put these principles into practice? Sign up for an OpenObserve cloud account (14 day free trial) or visit our downloads page to self host OpenObserve.
About the Author
Manas Sharma


Manas is a passionate Dev and Cloud Advocate with a strong focus on cloud-native technologies, including observability, cloud, kubernetes, and opensource. building bridges between tech and community.
Follow OpenObserve on Google
Add OpenObserve as a preferred source to see more of our articles in Google Search and Top Stories.













