OpenTelemetry for LLMs: What It Is and Why Your SRE Team Needs It Now

Ready to get started?
Try OpenObserve Cloud today for more efficient and performant observability.
Your Kubernetes pods have dashboards. Your databases have slow-query logs. Your APIs have latency SLOs. But your LLM? It's a black box, and that's about to become a production incident.
At OpenObserve, we work with engineering teams who have mastered observability for traditional infrastructure but are starting from scratch when it comes to LLMs. This guide is written for DevOps and SRE practitioners who need to close that gap using the open standard they already know: OpenTelemetry.
Why LLMs Break Traditional Observability
Monitoring LLM applications is a fundamentally different challenge compared to traditional software. With a conventional REST API, when something slows down you can usually trace the cause: a slow database query, a cache miss, a network timeout. The telemetry: a span, a latency histogram, an error log, maps directly to the problem.
LLMs don't behave that way. There are three core reasons observability gets difficult:
Usage and cost tracking. Unlike typical services billed by time or compute, LLMs are billed per token. You need to track how often the model is called, how many tokens each request consumes, and what that translates to in real spend. Without instrumentation, cost attribution across teams or features is impossible.
Non-deterministic latency. Response time from an LLM varies depending on prompt length, the model version, the provider's current load, and whether a multi-step agent triggered several sub-calls before the response arrived. A
200 OKdoesn't mean the response was fast, correct, or even useful.Rate limiting and API dependency. Most production LLM applications rely on external APIs rather than locally hosted models. When you hit a rate limit, the entire downstream feature breaks. Without observability into request volume and error patterns, you can't catch this before it becomes an incident.
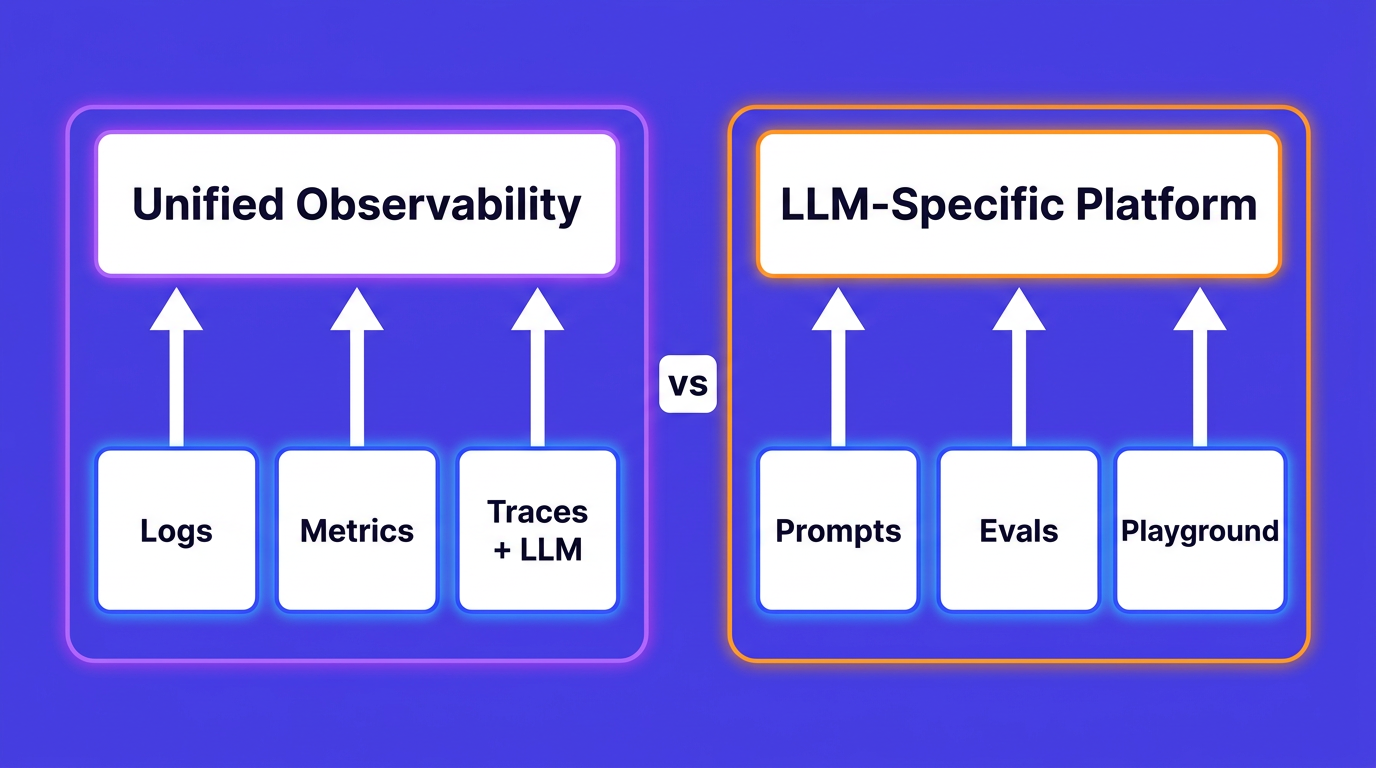
LLM Observability vs. Traditional Observability
It helps to be explicit about what's different. Traditional observability centres on identifying exceptions and validating expected system behaviour. LLM observability requires monitoring dynamic, stochastic outputs — and the users of that telemetry are often not just SRE teams but also ML engineers, data scientists, and product owners.
| Dimension | Traditional Observability | LLM Observability |
|---|---|---|
| Async instrumentation | Not in the critical path | Not in the critical path |
| Spans / traces | Core abstraction | Core abstraction |
| Metrics | Standard | Token usage, cost, latency |
| Exceptions | Detected at runtime | Often ex-post (evaluations, user feedback, hallucination scoring) |
| Main use cases | Alerts, SLOs, aggregated performance | Debug individual traces, dataset collection, hallucination monitoring |
| Primary users | SRE / Ops teams | MLE, SWE, data scientists, non-technical stakeholders |
| Focus | Holistic system health | What's critical to the LLM application |
There is also a meaningful split between development and production phases that doesn't exist in the same way for traditional services:
| Development Phase | Production Phase |
|---|---|
| Debug step-by-step through agent or pipeline stages | Monitor cost, latency, and quality in real time |
| Run experiments across datasets and evaluate outputs | Debug issues surfaced by user feedback or evaluations |
| Document and share experiment results | Cluster user intents and identify failure modes |
Refer: OpenObserve LLM Observability Docs
What Is OpenTelemetry?
OpenTelemetry (OTel) is a CNCF project that provides a vendor-neutral open standard for collecting, processing, and exporting telemetry data ,traces, metrics, and logs from your applications. It is now the de facto standard for cloud-native observability.
Instead of writing platform-specific instrumentation, you instrument your code once with OTel. The OTel Collector then routes that telemetry to any OTLP-compatible backend including OpenObserve, which accepts all three signals (traces, metrics, and logs) over a single OTLP endpoint with no pipeline re-architecting required.
App (OTel SDK)
    │
    ▼
OTel Collector      ← processes, redacts, enriches, routes
    │
    └──► OpenObserve (traces + metrics + logs, unified)
             │
             └──► Dashboards · Alerts · Search · Cost Analysis
For SRE teams, OTel's biggest value is the single, governed pipeline: one place to redact sensitive prompt content, enrich spans with environment metadata, and route signals to the right backends — before anything leaves your network. OpenObserve's native OTLP ingestion means you don't need to operate separate Jaeger, Prometheus, and Loki instances — all three signals land in one place, queryable together.
Read about OpenObserve OpenTelemetry Integration
The Three Signals: Traces, Metrics, and Logs for GenAI
OpenTelemetry's three pillars map directly to what your team needs for LLM workloads — but each requires a different mental model than traditional services.
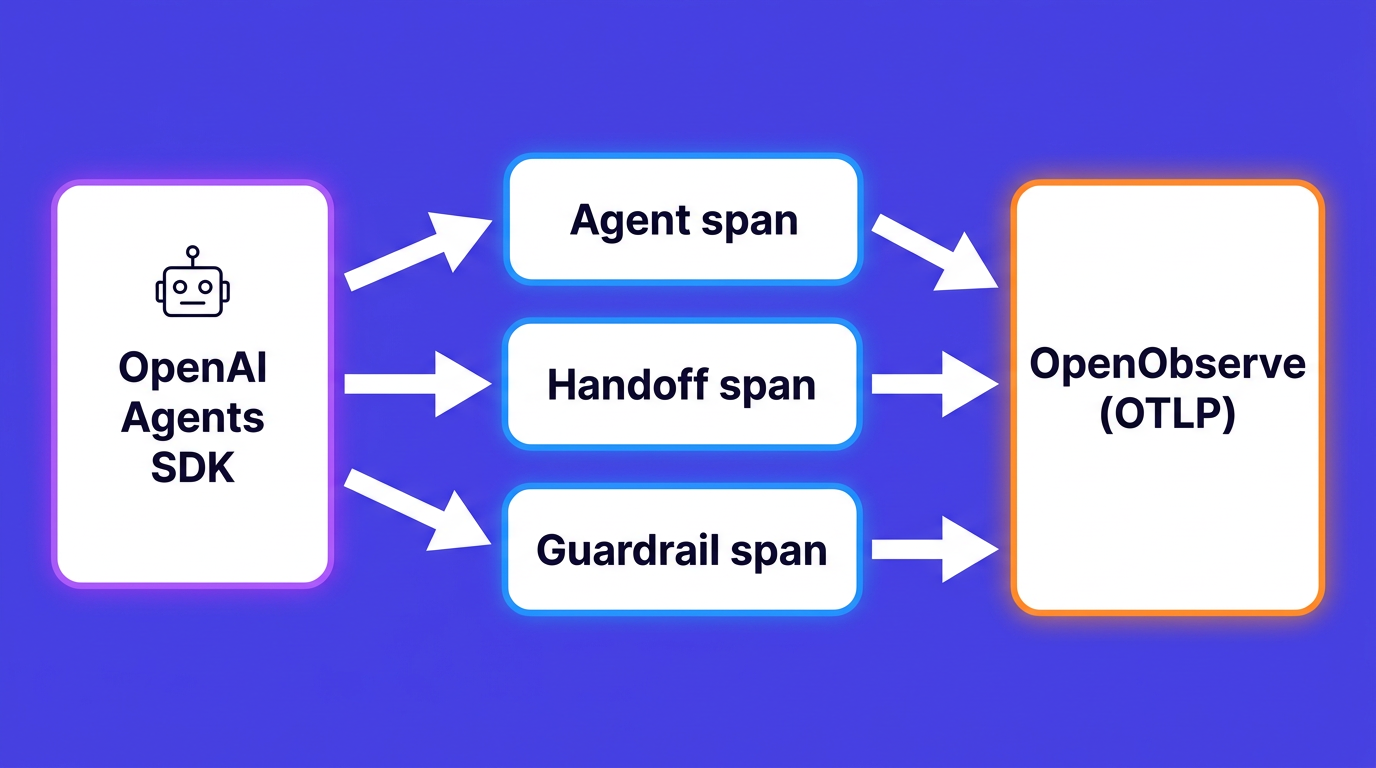
Traces
Traces follow a user query through every stage of your pipeline — retrieval, prompt construction, LLM inference, response parsing. Each stage becomes a span with parent-child relationships, so you can see exactly where time was spent.
For a RAG pipeline, a single user request might create spans for:
- Query embedding
- Vector store lookup (with metadata: source, document count, latency)
- Prompt construction
- LLM inference (with metadata: model name, temperature, token counts, response)
- Response parsing
Key trace attributes for LLMs include request metadata (temperature, top_p, model name, prompt details) and response metadata (token counts, cost, finish reason). These differ from traditional service traces because the parameters directly affect both cost and output quality in ways that aren't visible from status codes alone.
OpenObserve visualises these as full execution trees from system prompt to final response, stitching traces across process boundaries automatically using W3C context propagation.
Metrics
Metrics provide aggregated, time-series insight into system behaviour:
- Request volume — total requests to the LLM service; detects anomalous spikes or drops
- Request duration — end-to-end latency histogram; the basis for SLOs
- Token usage — input and output token counts; the primary cost driver
- Cost estimation — token counts multiplied by model pricing rates; enables trace-level cost transparency
Events & Logs
Logs and events capture the raw content of what happened: prompts, model responses, tool call payloads, and errors. Unlike traces (timing) and metrics (aggregates), logs give you the full context needed to investigate a specific failing request or a hallucinated response.
Use structured JSON logs so they can be parsed, filtered, and correlated with traces via trace_id and span_id. In OpenObserve, logs are co-located with traces and metrics — you can pivot from a slow span directly into the corresponding log stream without switching tools.
Read more about OTel Traces, OTel Metrics,OTel Logs
OTel GenAI Semantic Conventions
Raw spans are only useful if every team names attributes consistently. That's what Semantic Conventions solve. The OTel GenAI Semantic Conventions define a standard vocabulary for all AI workloads, so a span from a LangChain agent looks identical to one from a raw OpenAI call.
The OTel GenAI SIG has been developing these conventions since April 2024, covering:
- LLM inference operations (
gen_ai.chat,gen_ai.text_completion) - Embedding generation
- Tool and function calls
- Agent task and action tracking (actively in development)
# Example: LLM inference span following OTel GenAI conventions
Span name: gen_ai.chat

Attributes:
  gen_ai.operation.name: "chat"
  gen_ai.provider.name: "openai"
  gen_ai.request.model: "gpt-4o"
  gen_ai.response.model: "gpt-4o-2024-08-06"
  gen_ai.usage.input_tokens: 312
  gen_ai.usage.output_tokens: 148
  gen_ai.request.temperature: 0.7
  gen_ai.request.top_p: 0.9
  gen_ai.response.finish_reason: "stop"
  server.address: "api.openai.com"
OpenObserve ingests spans following these conventions natively — no custom attribute mapping or proprietary SDK required. You instrument once with OTel and send directly to OpenObserve's OTLP endpoint.
The SIG's roadmap is structured in three horizons:
- Near term: Ship OTel instrumentation libraries for OpenAI and other GenAI clients in Python and JavaScript
- Mid term: Extend coverage to embeddings, image/audio generation, and popular orchestration frameworks
- Long term: Full instrumentation for complex multi-step scenarios like RAG, agent frameworks, and multi-agent coordination
Explore the OTel GenAI Semantic Conventions (official spec)
Key Attributes Every SRE Should Track
Not all span attributes are equally useful operationally. Here are the ones that matter most for visibility, SLOs, and cost attribution:
| Attribute | What It Tells You |
|---|---|
gen_ai.usage.input_tokens |
Prompt cost driver; spikes indicate prompt bloat or runaway context windows |
gen_ai.usage.output_tokens |
Response size; unexpectedly large values may signal verbose generation |
gen_ai.request.model |
Model version being called; critical for cost attribution across providers |
gen_ai.response.finish_reason |
Was the response truncated? Did a tool call trigger? Key quality signal |
gen_ai.provider.name |
Provider-level attribution; enables per-vendor SLO and failover tracking |
gen_ai.request.temperature |
Correlate non-determinism with quality regressions over time |
gen_ai.request.top_p |
Affects output diversity; useful when debugging inconsistent responses |
error.type |
Rate-limit hits, timeouts, content policy rejections — the new class of 5xx |
server.address |
Which endpoint or proxy handled the call; useful for multi-region routing |
In OpenObserve, all of these attributes are searchable and filterable across logs, traces, and metrics in a unified query interface — so your team can answer questions like "which model + temperature combination had the highest truncation rate last week?" without writing cross-tool queries.
Metrics to SLO On
# Standard GenAI metric instruments (OTel conventions)
gen_ai.client.token.usage              → histogram  (tokens per request)
gen_ai.client.operation.duration       → histogram  (latency in seconds)

# Recommended SLO dimensions
- p95 latency by (gen_ai.provider.name, gen_ai.request.model)
- token budget utilization per team or feature
- error rate by error.type
- cost per 1k requests (token usage × model pricing rates)
Learn more about OTel GenAI Metrics Reference
The Current Ecosystem
The OTel GenAI tooling landscape is moving fast. Here's where the key pieces fit — and where OpenObserve sits in this stack:
| Tool | Role |
|---|---|
| OpenObserve | Unified backend for traces, metrics, and logs. Native OTLP ingestion, no re-architecting required. Built-in dashboards for LLM cost, latency, and token usage. 60–90% cost savings vs. Datadog at scale. |
| OpenLIT | OpenTelemetry-native auto-instrumentation library for OpenAI, Anthropic, LangChain, LlamaIndex, and vector databases. Works natively with OpenObserve as the OTLP backend. |
| OpenLLMetry | OTel extension covering agent frameworks. Ships an LLM gateway proxy (Hub) for centralised instrumentation. |
| OTel Collector | Processes, redacts, and routes all three signals before they reach your backend. Routes to OpenObserve via OTLP. |
| Langfuse | LLMOps layer for evaluations, annotations, and user feedback — can complement OpenObserve for teams that need ex-post quality scoring. |
Read our detailed guide on comparing LLM observability tools
The OTel GenAI SIG is actively developing semantic conventions for multi-agent systems, covering tasks, actions, agent teams, memory, and artifact tracking. OpenObserve's OTLP-native architecture means your pipeline will support these new conventions as soon as instrumentation libraries ship them.
How To Instrument Your LLM Application with OpenTelemetry and OpenObserve
Getting LLM traces into OpenObserve is intentionally straightforward. Under the hood it is pure OpenTelemetry — there is nothing special about LLM traces compared to regular distributed traces. The openobserve-telemetry-sdk is a thin wrapper around the standard OTel Python SDK that handles exporter configuration for you, so you can go from zero to traces in three steps.
Prerequisites: Python 3.8+, a running OpenObserve instance (cloud.openobserve.ai or self-hosted), and your organisation ID and Base64-encoded auth token.
Step 1 : Configure your environment
Create a .env file in your project root with your OpenObserve credentials:
# .env
OPENOBSERVE_URL=https://api.openobserve.ai/   # trailing slash required; use http://localhost:5080/ for self-hosted
OPENOBSERVE_ORG=your_org_id
OPENOBSERVE_AUTH_TOKEN="Basic <your_base64_token>"  # Base64-encoded "email:password"
OPENOBSERVE_ENABLED=true

# LLM provider keys
OPENAI_API_KEY=sk-...
ANTHROPIC_API_KEY=sk-ant-...
| Variable | Description | Required |
|---|---|---|
OPENOBSERVE_URL |
Base URL of your OpenObserve instance | Yes |
OPENOBSERVE_ORG |
Organisation slug or ID | Yes |
OPENOBSERVE_AUTH_TOKEN |
Basic <base64(email:password)> |
Yes |
OPENOBSERVE_ENABLED |
Toggle tracing on/off | No (default: true) |
Step 2: Install dependencies
uv pip install openobserve-telemetry-sdk \
               opentelemetry-instrumentation-openai \
               python-dotenv
The openobserve-telemetry-sdk is a thin wrapper around the standard OTel Python SDK. If you already have an OTel pipeline, you can skip it and send directly to OpenObserve's OTLP endpoint — no re-architecting needed.
Step 3: Configure your application
For OpenAI:
from opentelemetry.instrumentation.openai import OpenAIInstrumentor
from openobserve import openobserve_init

# Instrument before any LLM calls
OpenAIInstrumentor().instrument()
openobserve_init()

# Use your client as normal — traces are captured automatically
from openai import OpenAI
client = OpenAI()
response = client.chat.completions.create(
    model="gpt-4o",
    messages=[{"role": "user", "content": "Summarise this incident report."}]
)
print(response.choices[0].message.content)
For Anthropic (Claude):
from opentelemetry.instrumentation.anthropic import AnthropicInstrumentor
from openobserve import openobserve_init

AnthropicInstrumentor().instrument()
openobserve_init()

from anthropic import Anthropic
client = Anthropic()
response = client.messages.create(
    model="claude-3-5-sonnet-20241022",
    max_tokens=1024,
    messages=[{"role": "user", "content": "Summarise this incident report."}]
)
print(response.content[0].text)
Every call is now captured as a trace span and exported to OpenObserve — no manual span creation, no SDK boilerplate.
Step 4 : (Optional) Quickstart with the bundled example
If you want to see traces flowing before touching your own codebase, clone the SDK repo and run the included example:
git clone https://github.com/openobserve/openobserve-python-sdk/
cd openobserve-python-sdk
uv pip install -r requirements.txt
uv run examples/openai_example.py
Open OpenObserve → Traces and search by service name to see spans appear in real time.
What gets captured automatically
The instrumentor attaches the following attributes to each span with zero configuration:
| Attribute | Description |
|---|---|
llm.request.model |
Model name (e.g. gpt-4o) |
llm.usage.prompt_tokens |
Tokens in the prompt |
llm.usage.completion_tokens |
Tokens in the response |
llm.usage.total_tokens |
Total tokens consumed |
llm.request.temperature |
Temperature parameter |
llm.request.max_tokens |
Max tokens parameter |
duration |
End-to-end request latency |
error |
Exception detail if the request failed |
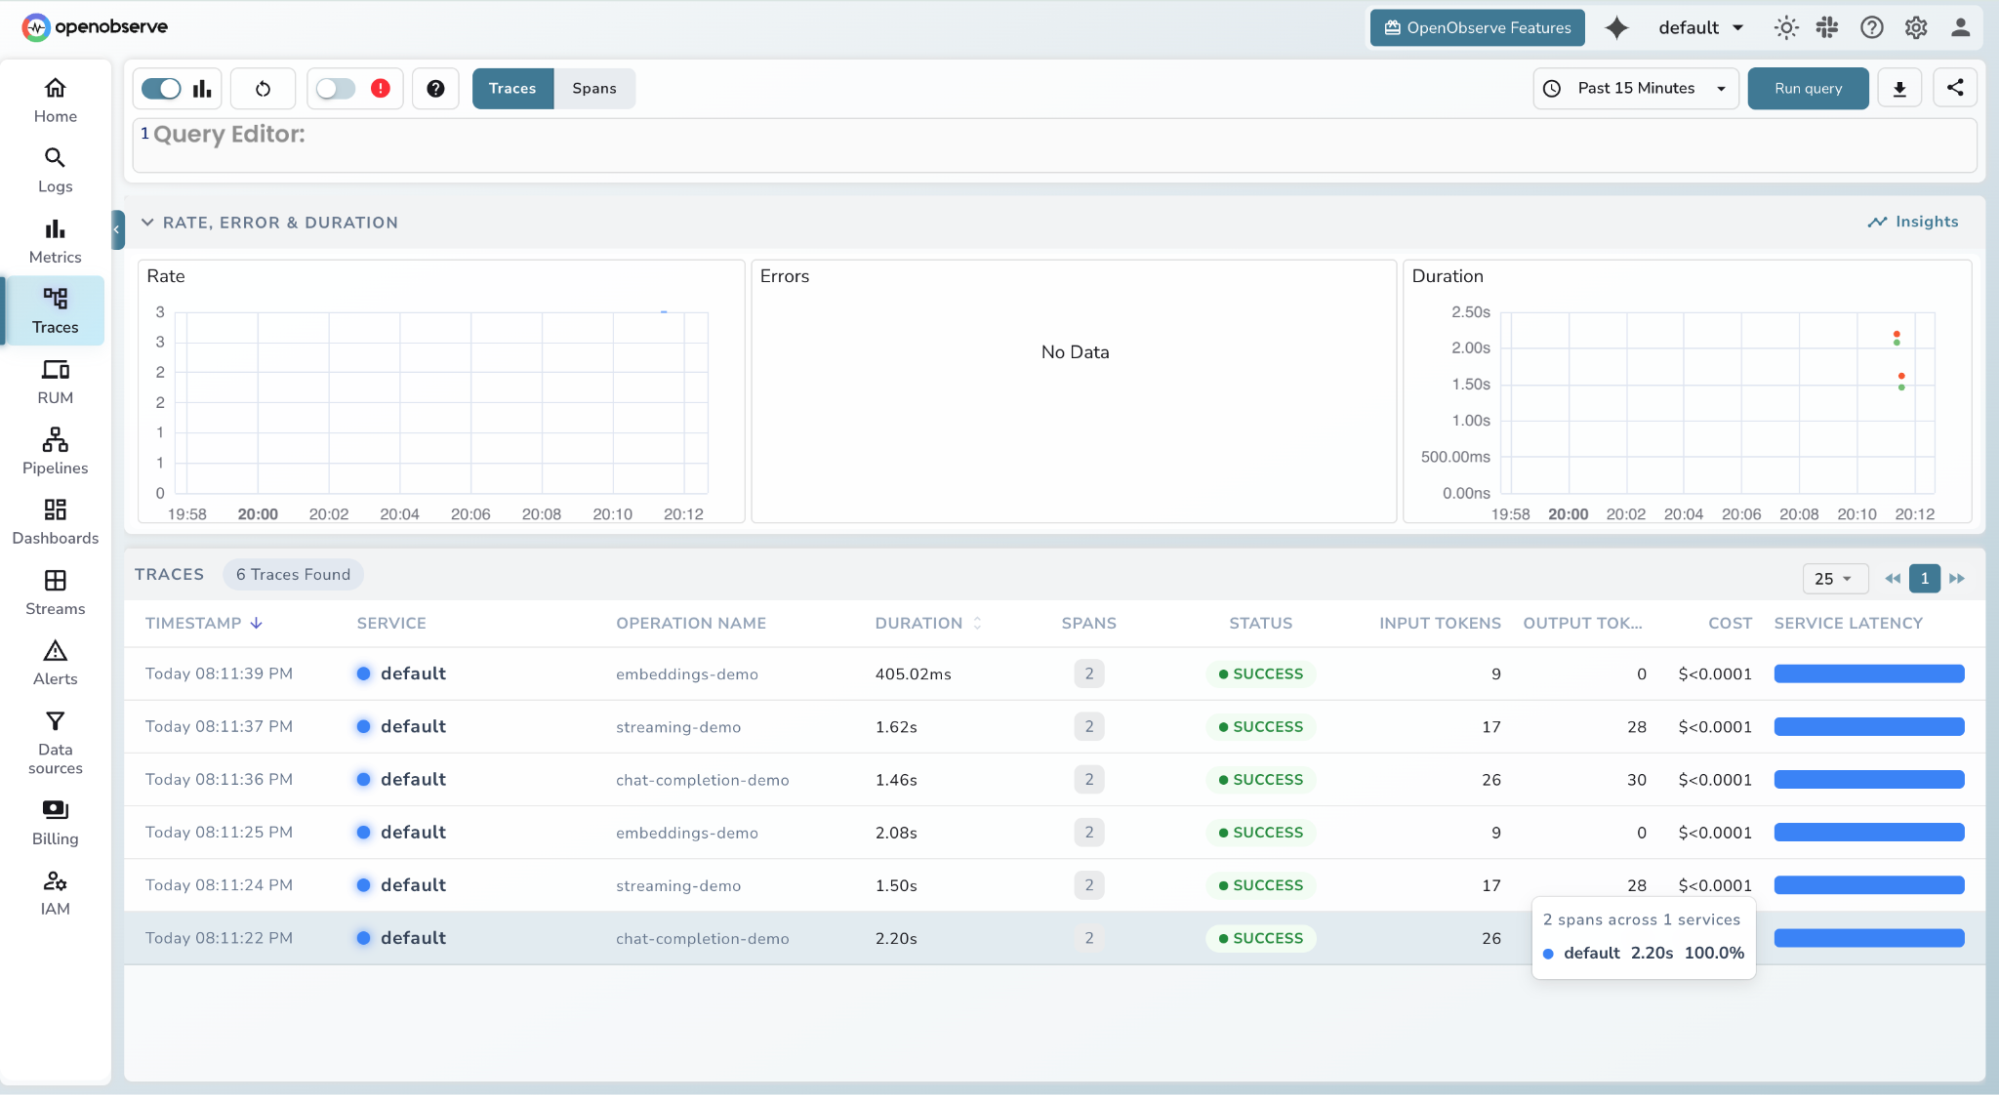
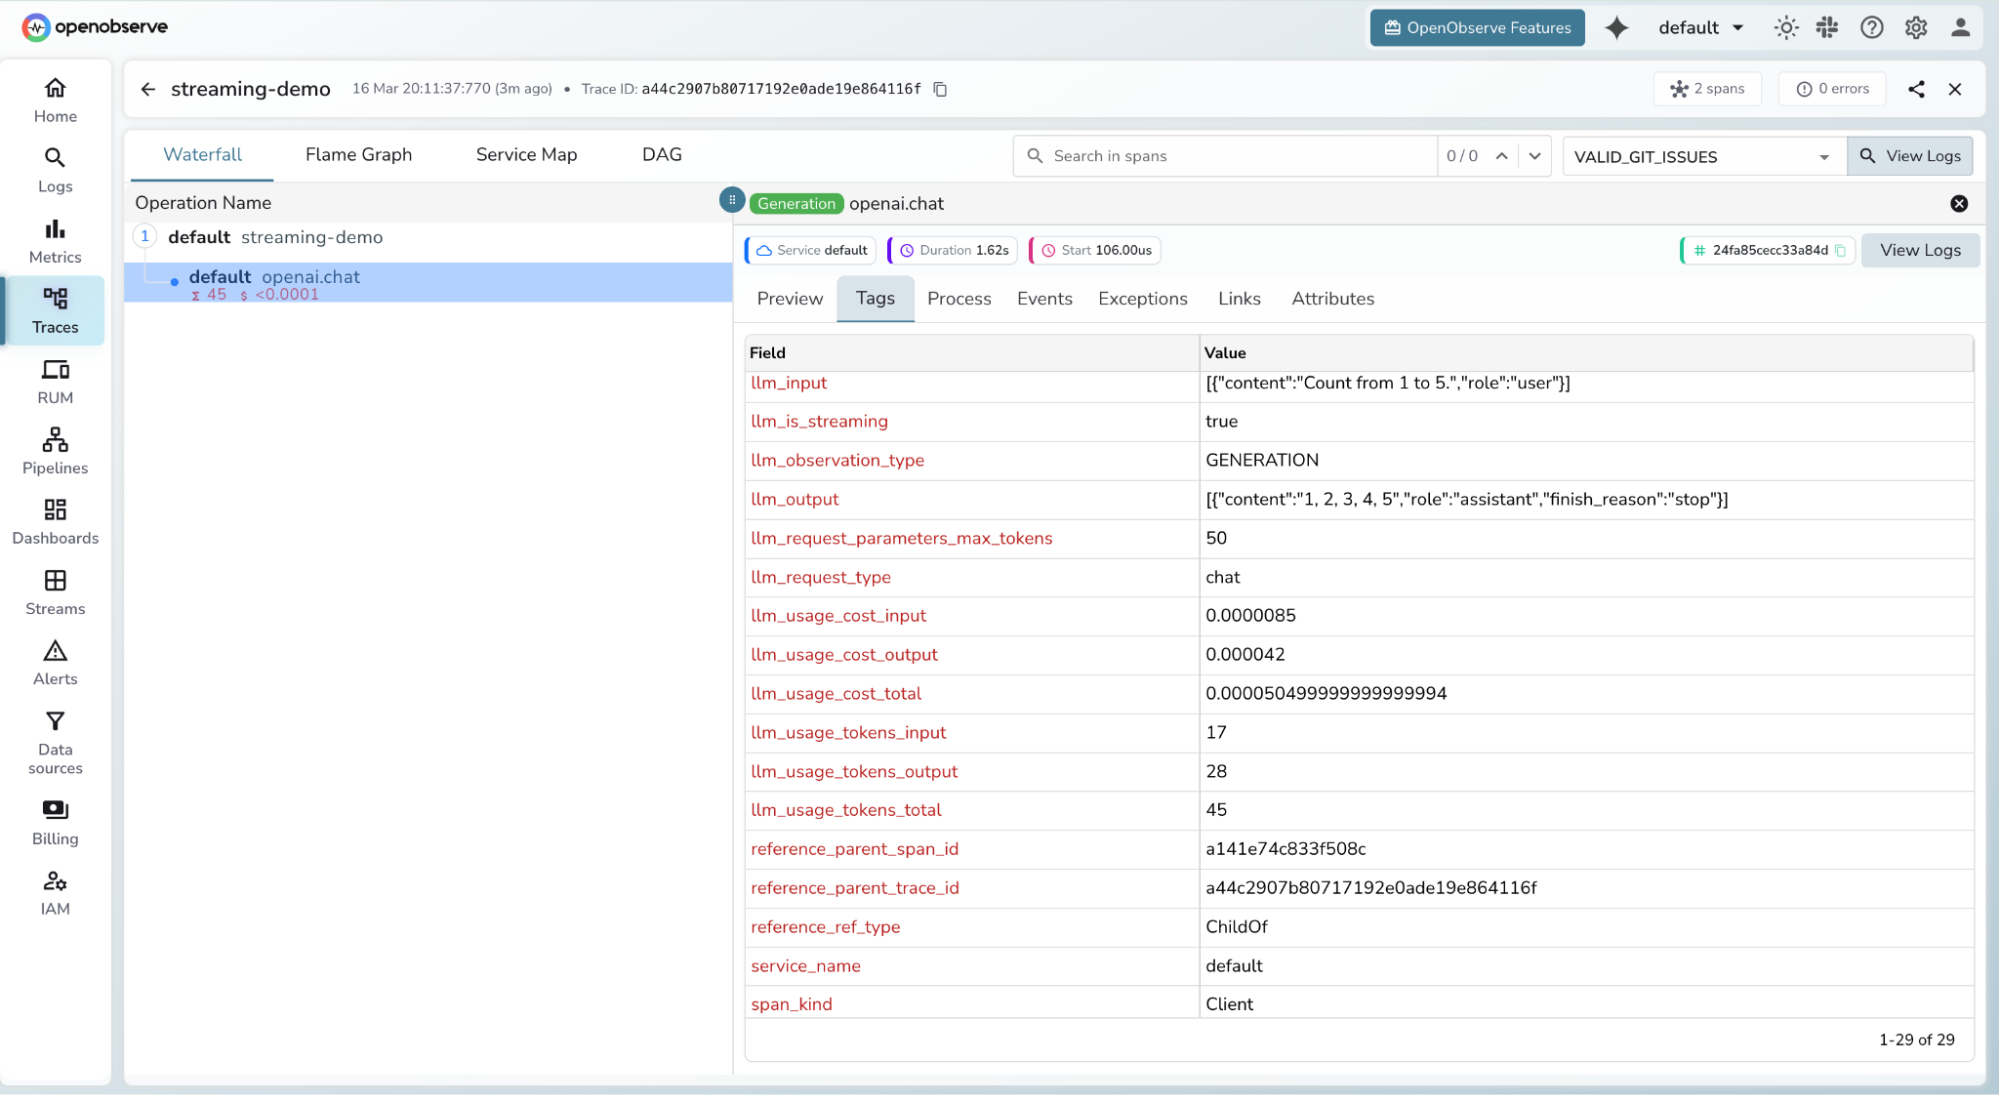
Step 5 : View traces in OpenObserve
- Log in to your OpenObserve instance and navigate to Traces in the left sidebar
- Filter by service name, model, or time range
- Click any span to inspect token counts, latency, and full request metadata
- Use the Logs tab with
trace_idto pivot from a span directly into the correlated log stream
Step 6 : (Optional) Route through the OTel Collector for redaction
If you need to sanitise prompt or response content before it reaches OpenObserve — e.g. to strip PII — add an OTel Collector in between:
# otel-collector-config.yaml
receivers:
  otlp:
    protocols:
      grpc: { endpoint: 0.0.0.0:4317 }
      http: { endpoint: 0.0.0.0:4318 }

processors:
  redaction:
    allow_all_keys: true
    blocked_values:
      - "llm.prompt.details"
      - "llm.response.details"
  memory_limiter:
    limit_mib: 1500
    spike_limit_mib: 512
    check_interval: 5s
  batch: {}

exporters:
  otlphttp/openobserve:
    endpoint: https://api.openobserve.ai/api/YOUR_ORG
    headers:
      Authorization: "Basic <base64(email:password)>"

service:
  pipelines:
    traces:
      receivers: [otlp]
      processors: [redaction, memory_limiter, batch]
      exporters: [otlphttp/openobserve]
    metrics:
      receivers: [otlp]
      processors: [memory_limiter, batch]
      exporters: [otlphttp/openobserve]
    logs:
      receivers: [otlp]
      processors: [batch]
      exporters: [otlphttp/openobserve]
or you can make use of sensitive redaction in OpenObserve
Troubleshooting
| Symptom | Fix |
|---|---|
| Traces not appearing | Confirm OPENOBSERVE_ENABLED=true and that OPENOBSERVE_URL ends with a trailing / |
| Auth errors | Verify OPENOBSERVE_AUTH_TOKEN is correctly Base64-encoded (Basic <token>) |
ModuleNotFoundError: dotenv |
Install python-dotenv, not dotenv |
ModuleNotFoundError: openobserve_telemetry |
Run uv pip install openobserve-telemetry-sdk |
| SDK not tracing | Ensure openobserve_init() is called before any LLM client instantiation |
What this setup enables
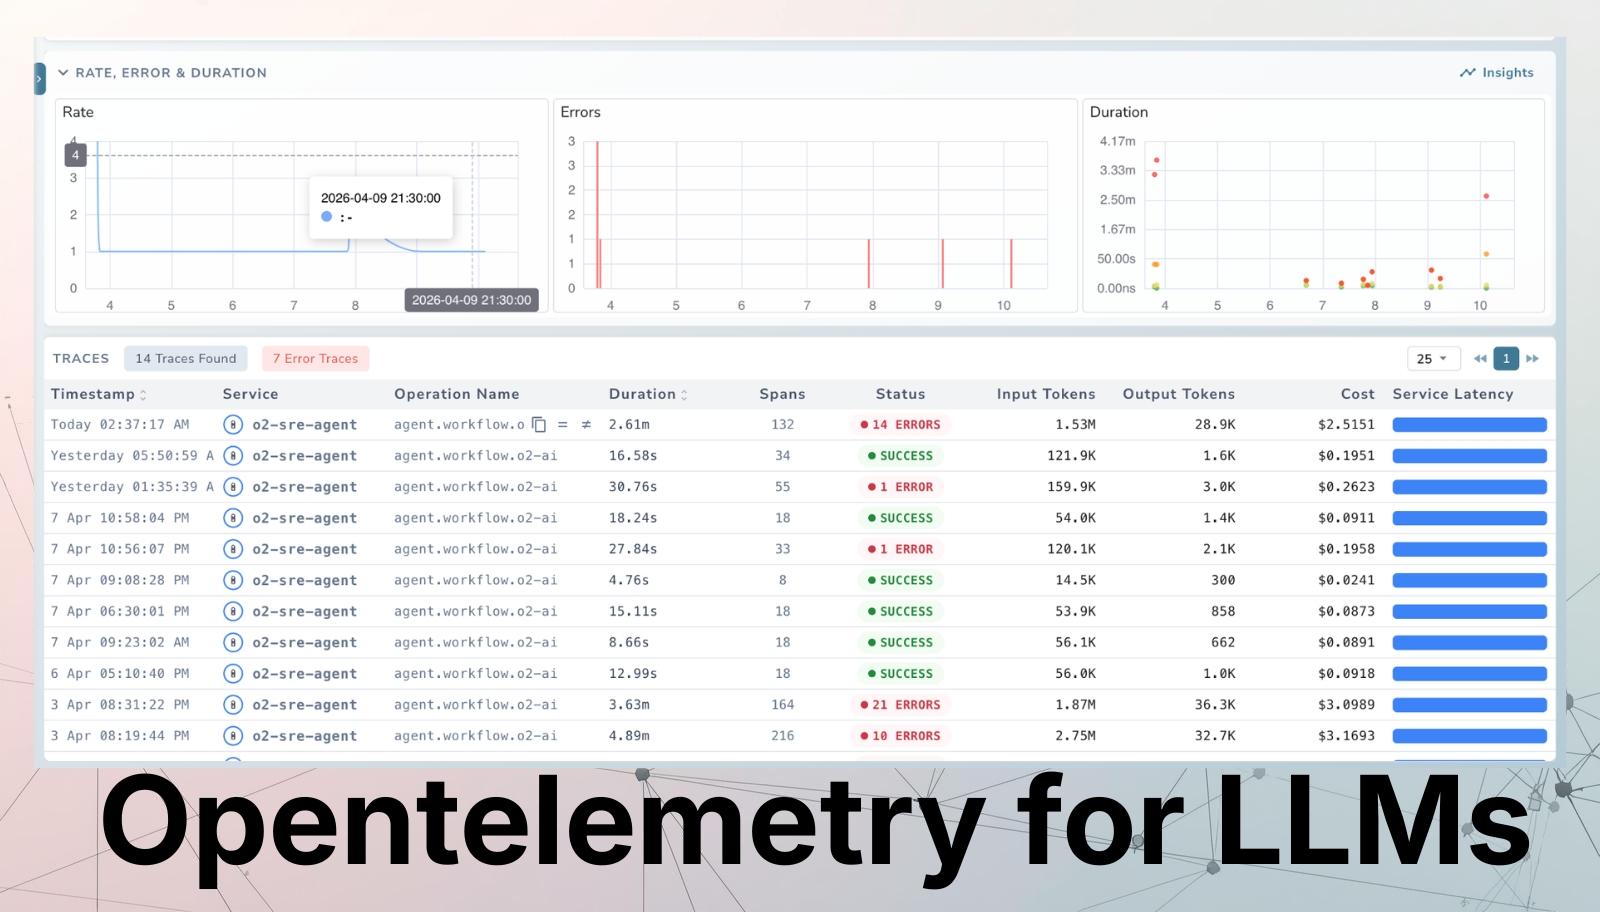
- Latency root cause analysis: Traces distinguish whether slow responses originate in retrieval or LLM inference — visible in OpenObserve's Gantt chart view.
- Trace-level cost transparency: Token counters per span enable per-request, per-team, per-feature cost attribution without any external billing tooling.
- Hallucination debugging: Prompt and response content in logs (sanitised by the Collector before export) lets you correlate poor answers with specific retrieval results or prompt configurations.
- Model governance: Attributes like
gen_ai.request.model,gen_ai.request.temperature, andgen_ai.request.top_plet you correlate configuration changes with quality or cost regressions over time.
Read more details around the Integration: OpenObserve LLM Observability Docs
Conclusion
LLMs are now first-class production infrastructure. The same reliability standards you hold for your APIs and databases — SLOs, alerting, cost attribution, incident traces — apply to every model inference your systems make. OpenTelemetry's GenAI Semantic Conventions are the foundation that makes that possible, and OpenObserve is built to receive all three signals :traces, metrics, and logs in one place, without the operational overhead or the cost of proprietary alternatives.
Frequently Asked Questions
About the Author
Simran Kumari
Passionate about observability, AI systems, and cloud-native tools. All in on DevOps and improving the developer experience.