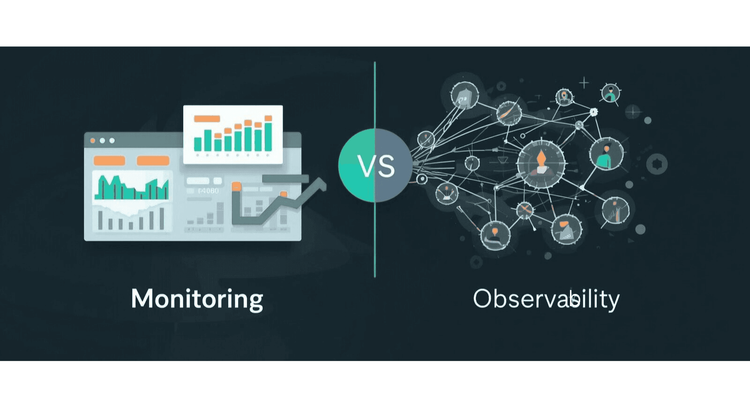
Observability vs monitoring explained. Learn the key differences, use cases, and why modern teams move beyond monitoring to observability.
A complete guide to full stack observability - covering frontend, backend, infrastructure, traces, logs, metrics, and OpenTelemetry for DevOps and SRE teams.
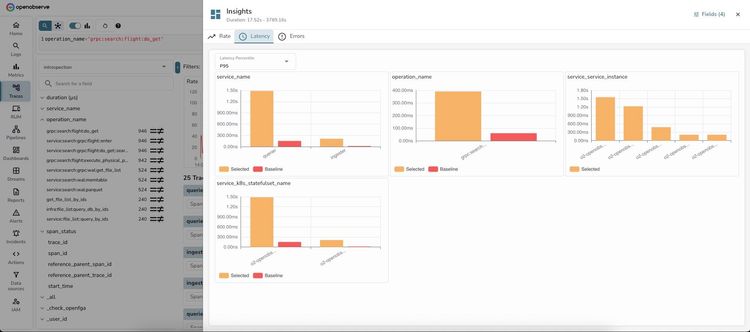
Learn how to use OpenObserve Insights for interactive log and trace analysis. Identify root causes in 60 seconds with dimension analysis. Real examples, step-by-step guides, and troubleshooting tips.
A comprehensive comparison of the top 10 observability platforms in 2026 highlighting their strengths, trade-offs, and use-cases.
Does cheaper observability mean worse capabilities? We tested this assumption by sending identical telemetry from a 16-service OpenTelemetry demo to both DataDog and OpenObserve simultaneously. The results: DataDog costs $174/day vs OpenObserve's $3/day—98% cost savings without sacrificing visibility. Evereve achieved similar results: 90% cost reduction, platform consolidation, and unlimited instrumentation after migrating from DataDog.
Top 10 open source monitoring tools explained. Learn what they are, why they matter, and how to choose to get the most from your observability strategy.
A comprehensive comparison of the top 10 open source observability platforms in 2026 highlighting their strengths, trade-offs, and use-cases.
Hands-on comparison of DataDog and OpenObserve for alerting and monitoring. DataDog's proprietary monitor syntax and per-custom-metric charges vs OpenObserve's SQL-based unified alerts, composite conditions with joins, and Jinja2-templated notifications. Real test data shows custom metric pricing impact on alert coverage versus flat-rate pricing with comprehensive alerting capabilities.
Hands-on comparison of DataDog and OpenObserve for dashboard visualizations. DataDog's proprietary query syntax and premium tiers vs OpenObserve's SQL/PromQL queries, ECharts custom charts, and community dashboard library. Real test data shows 98% cost savings ($174/day vs $3/day) with identical dashboard capabilities and OpenTelemetry-native architecture.
OpenObserve Kubernetes Operator brings observability as code to platform teams. Manage alerts, pipelines, and functions as Kubernetes resources with GitOps workflows.
Real-world comparison of DataDog and OpenObserve for log management. SQL queries, automatic field discovery, and 90% cost savings. Tested with OpenTelemetry.
Traditional monitoring tools fail when you need them most. Learn how Rust-powered observability platforms solve memory safety issues and deliver reliable, high-performance monitoring at 60-90% and lower cost.
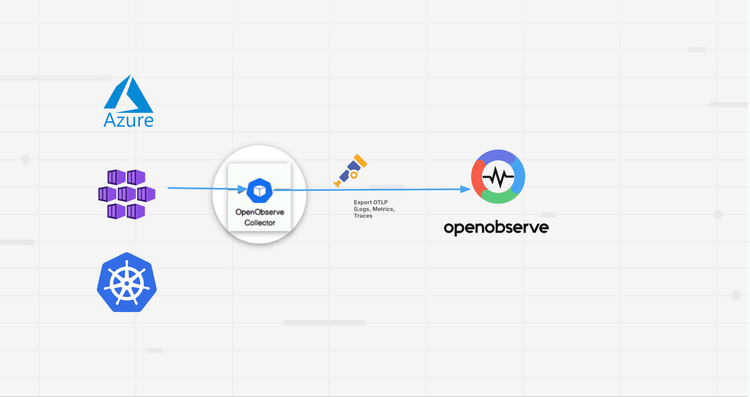
Learn how to set up comprehensive AKS monitoring with OpenObserve. Deploy the OpenObserve Collector to capture logs, metrics, and traces from your Azure Kubernetes clusters. Get unified observability with significant cost savings compared to Azure Log Analytics.
Discover how full-stack observability helps teams correlate telemetry across systems to cut MTTR, reduce data costs, and improve performance.
OpenObserve v0.16.1 delivers meaningful new features including Alert History for debugging monitoring reliability, Pipeline History for execution tracking, and automatic Log Pattern extraction that groups millions of logs into actionable insights. This release brings significant performance improvements with optimized indexing and query execution, alongside UI/UX refinements that enhance readability and usability across the platform. Teams can now better understand their system behavior, reduce alert fatigue through deduplication, and troubleshoot issues faster with comprehensive execution history and diagnostics.
Learn how to scale observability systems to handle Black Friday-level traffic without losing visibility. Discover best practices for ingestion tuning, query optimization, and resilience using OpenObserve.
Monitor NVIDIA H100, H200, and A100 GPUs with DCGM Exporter and OpenObserve. Complete setup guide with dashboards, alerts, and 89% cost savings vs traditional tools.
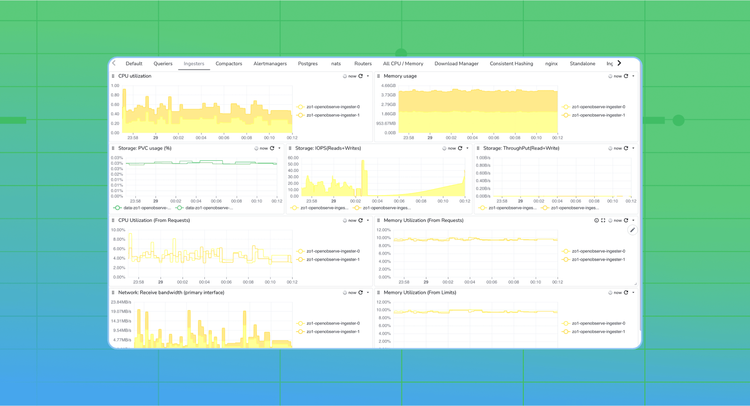
Learn how to effectively monitor your OpenObserve deployment, starting from system health metrics like CPU, memory, and network usage, to OpenObserve’s own internal metrics exposed in Prometheus format. This guide walks through best practices, setup steps, and configuration examples.
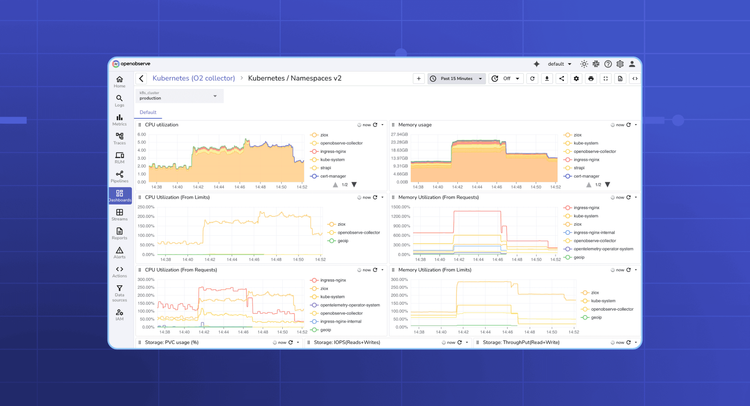
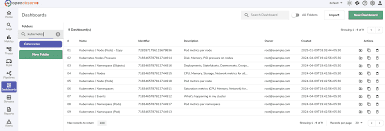
Import OpenObserve’s prebuilt Kubernetes dashboards for end-to-end visibility, trend analysis, and proactive alerts across clusters.
A comprehensive comparison of the top 10 observability platforms in 2025 highlighting their strengths, trade-offs, and use-cases.
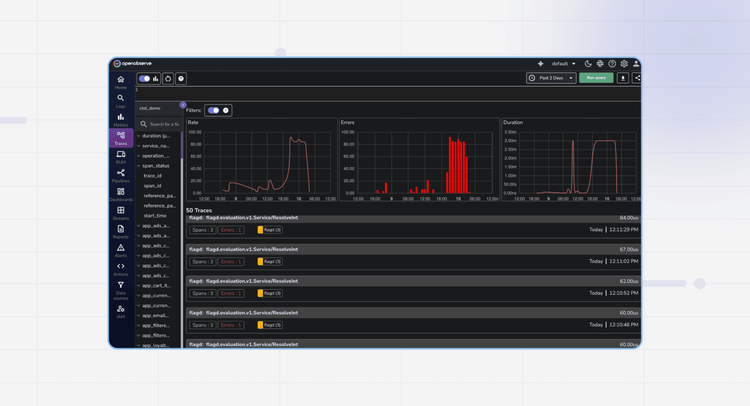
Deploy the OpenTelemetry Astronomy Shop demo and stream traces, metrics, and logs to OpenObserve with Helm. Easily configure OTLP and visualize everything in dashboards.