OpenTelemetry Astronomy Shop Demo App with OpenObserve Integration




Ready to get started?
Try OpenObserve Cloud today for more efficient and performant observability.
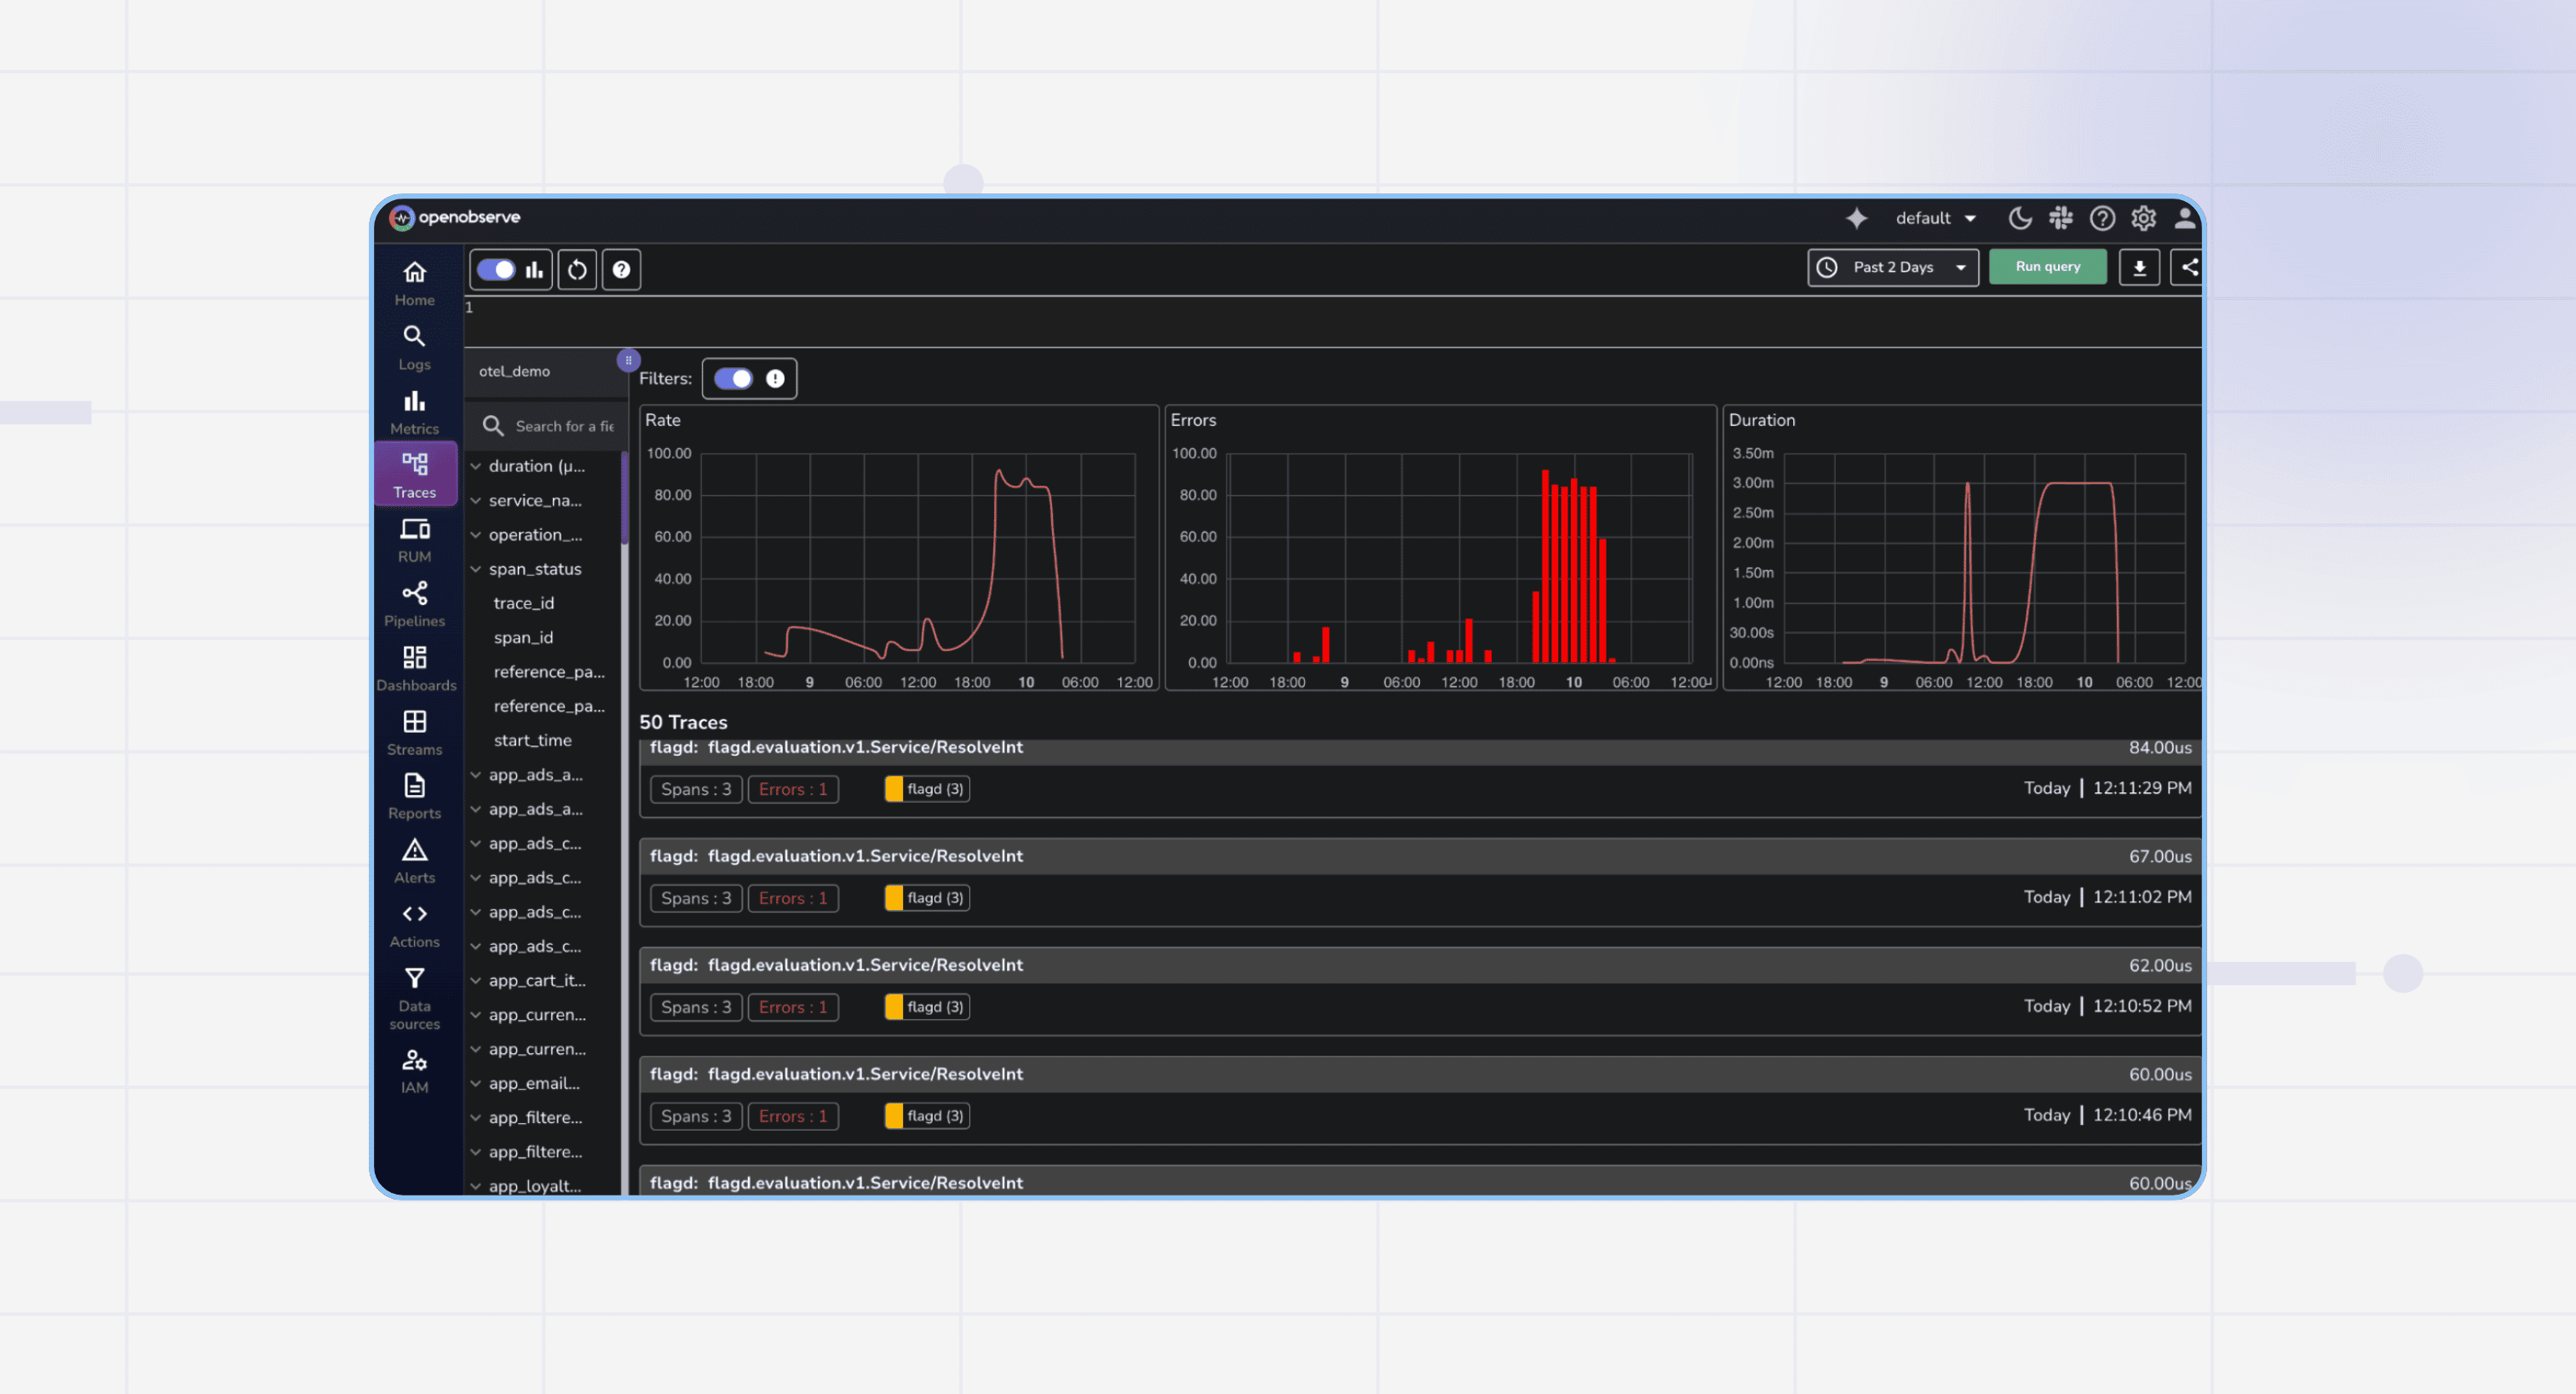
Want to explore OpenTelemetry with a real-world example? The OpenTelemetry Astronomy Shop demo is a microservices-based application that generates traces, metrics, and logs - perfect for learning observability concepts. We’ll cover how to set it up and ingest all that telemetry data into OpenObserve.
What You'll Build
This guide walks you through deploying the OpenTelemetry demo application and configuring it to send observability data to OpenObserve, giving you a complete view of your distributed system's performance.
Prerequisites
- OpenTelemetry Astronomy Shop demo
- OpenTelemetry Helm Chart
- OpenObserve Cloud or self-hosted instance
Setup Steps
Step 1: Clone the Demo Repository
git clone https://github.com/open-telemetry/opentelemetry-demo.git
Step 2: Add the OpenTelemetry Helm Repository
helm repo add open-telemetry https://open-telemetry.github.io/opentelemetry-helm-charts
Step 3: Configure OpenObserve Integration
Create a values.yml file with your OpenObserve-specific configuration. This tells the OpenTelemetry Collector where to send your data:
opentelemetry-collector:
  config:
    exporters:
      otlphttp/openobserve:
        endpoint: https://example.openobserve.ai/api/default/
        headers:
          Authorization: Basic TOKEN
          stream-name: otel-demo

    service:
      pipelines:
        traces:
          exporters: [otlp, debug, spanmetrics, otlphttp/openobserve]
        metrics:
          exporters: [otlphttp/openobserve]
        logs:
          exporters: [otlphttp/openobserve]
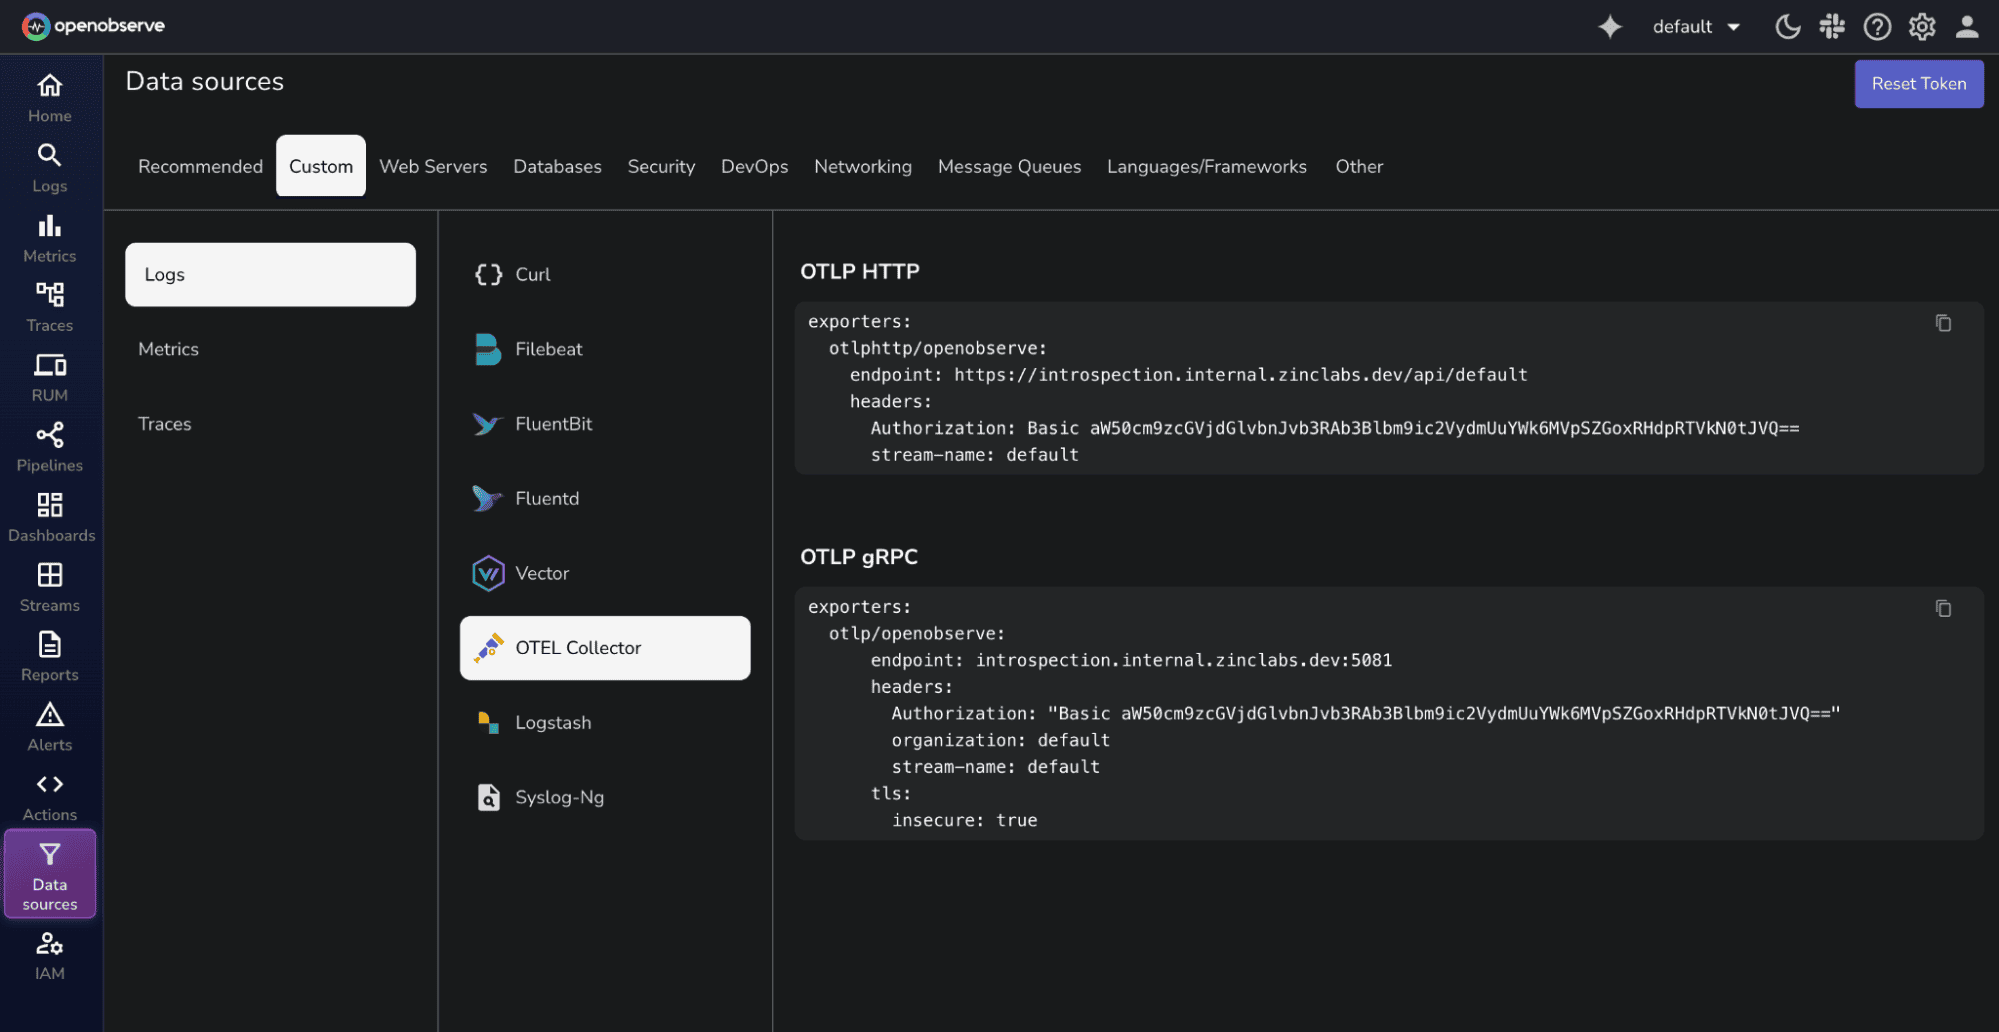
Replace example.openobserve.ai with your OpenObserve instance URL and TOKEN with your authentication token. You can find these configuration details in OpenObserve under DataSources > Custom > Logs/Metrics/Traces > OTEL Collector.
Step 4: Deploy with Helm
helm install otel-demo open-telemetry/opentelemetry-demo --values my-values.yml
Step 5: Visualize in OpenObserve
Once deployed, head over to your OpenObserve dashboard. You'll see traces, metrics, and logs from the Astronomy Shop flowing in, ready to explore and analyze.
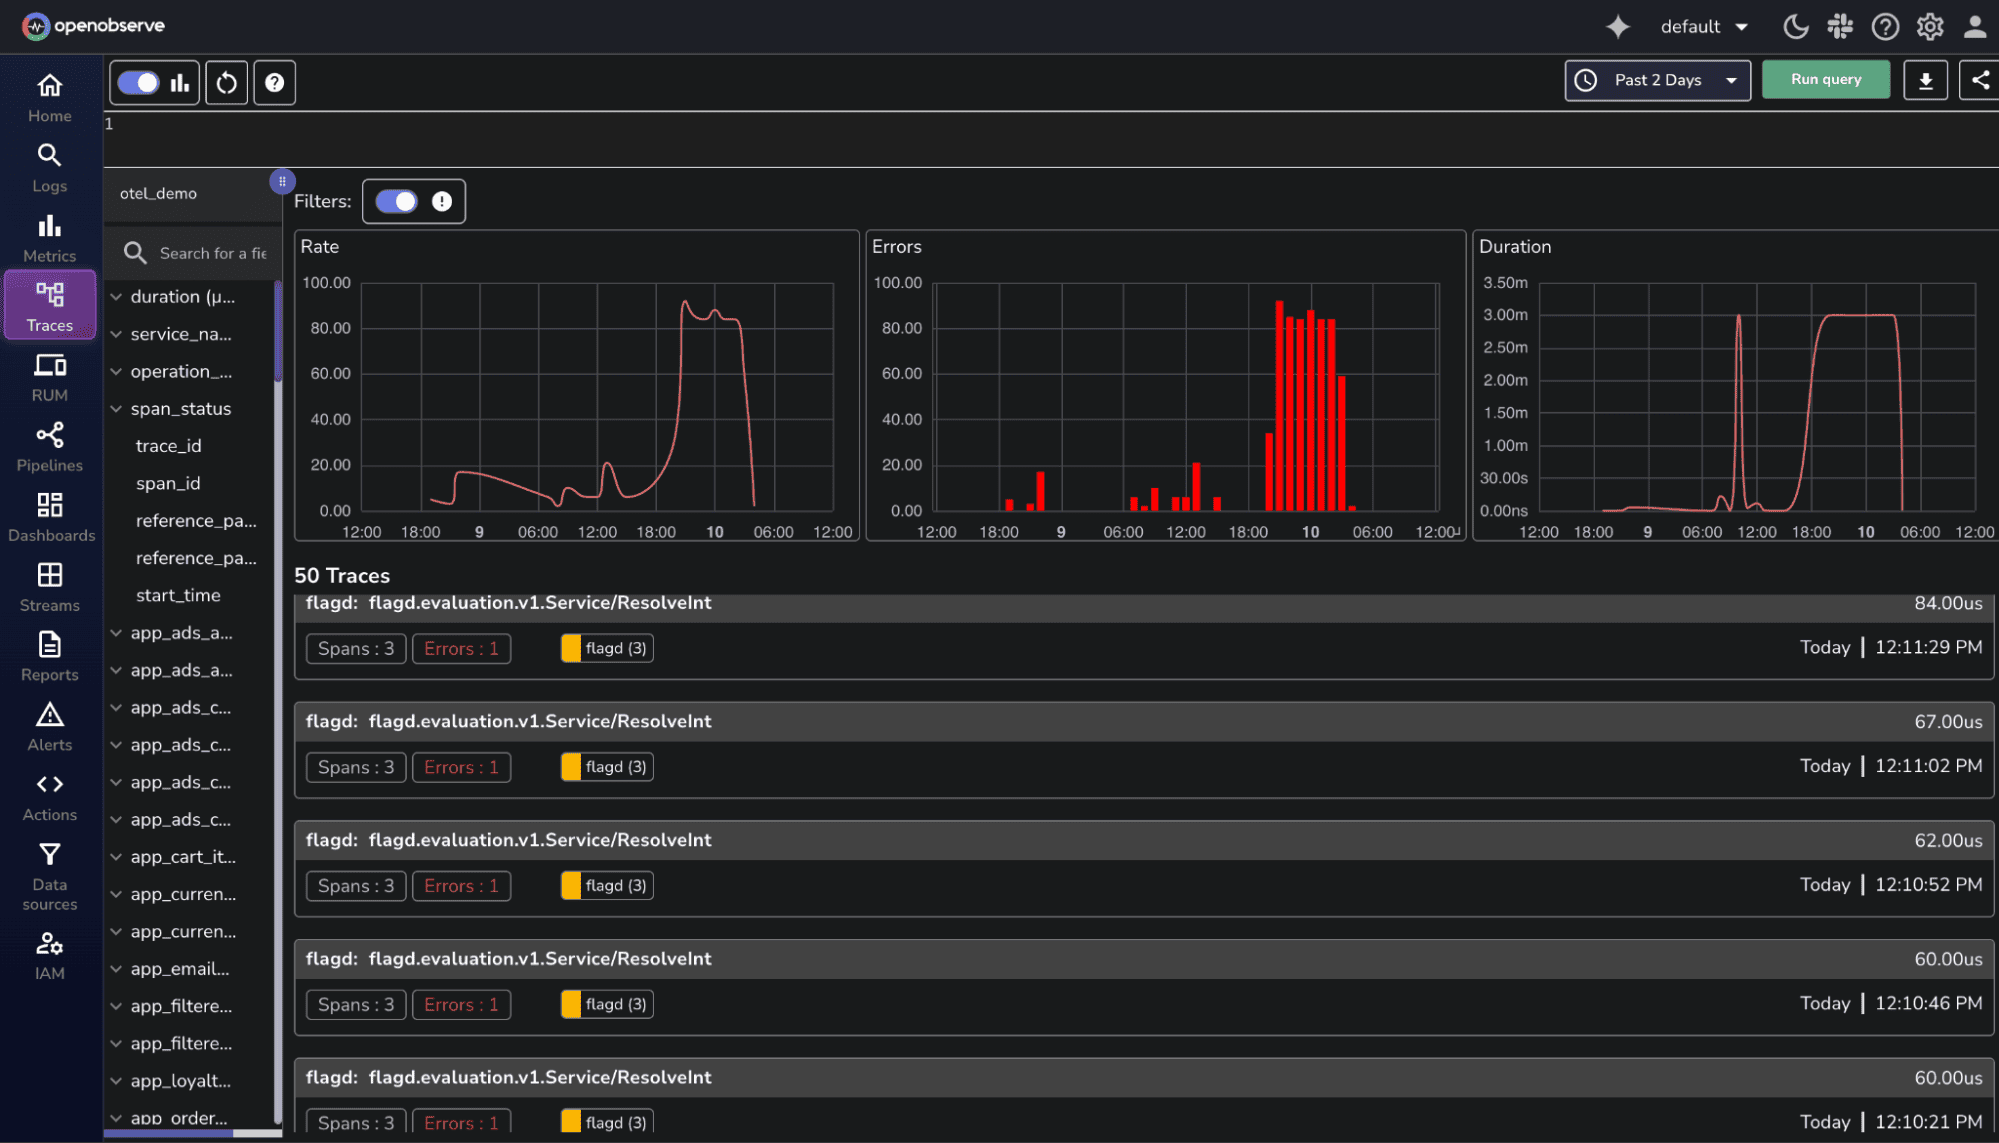
- Errors-only filter for Traces: Quickly isolate and inspect failed transactions by filtering traces with errors, helping you focus on problematic service paths.
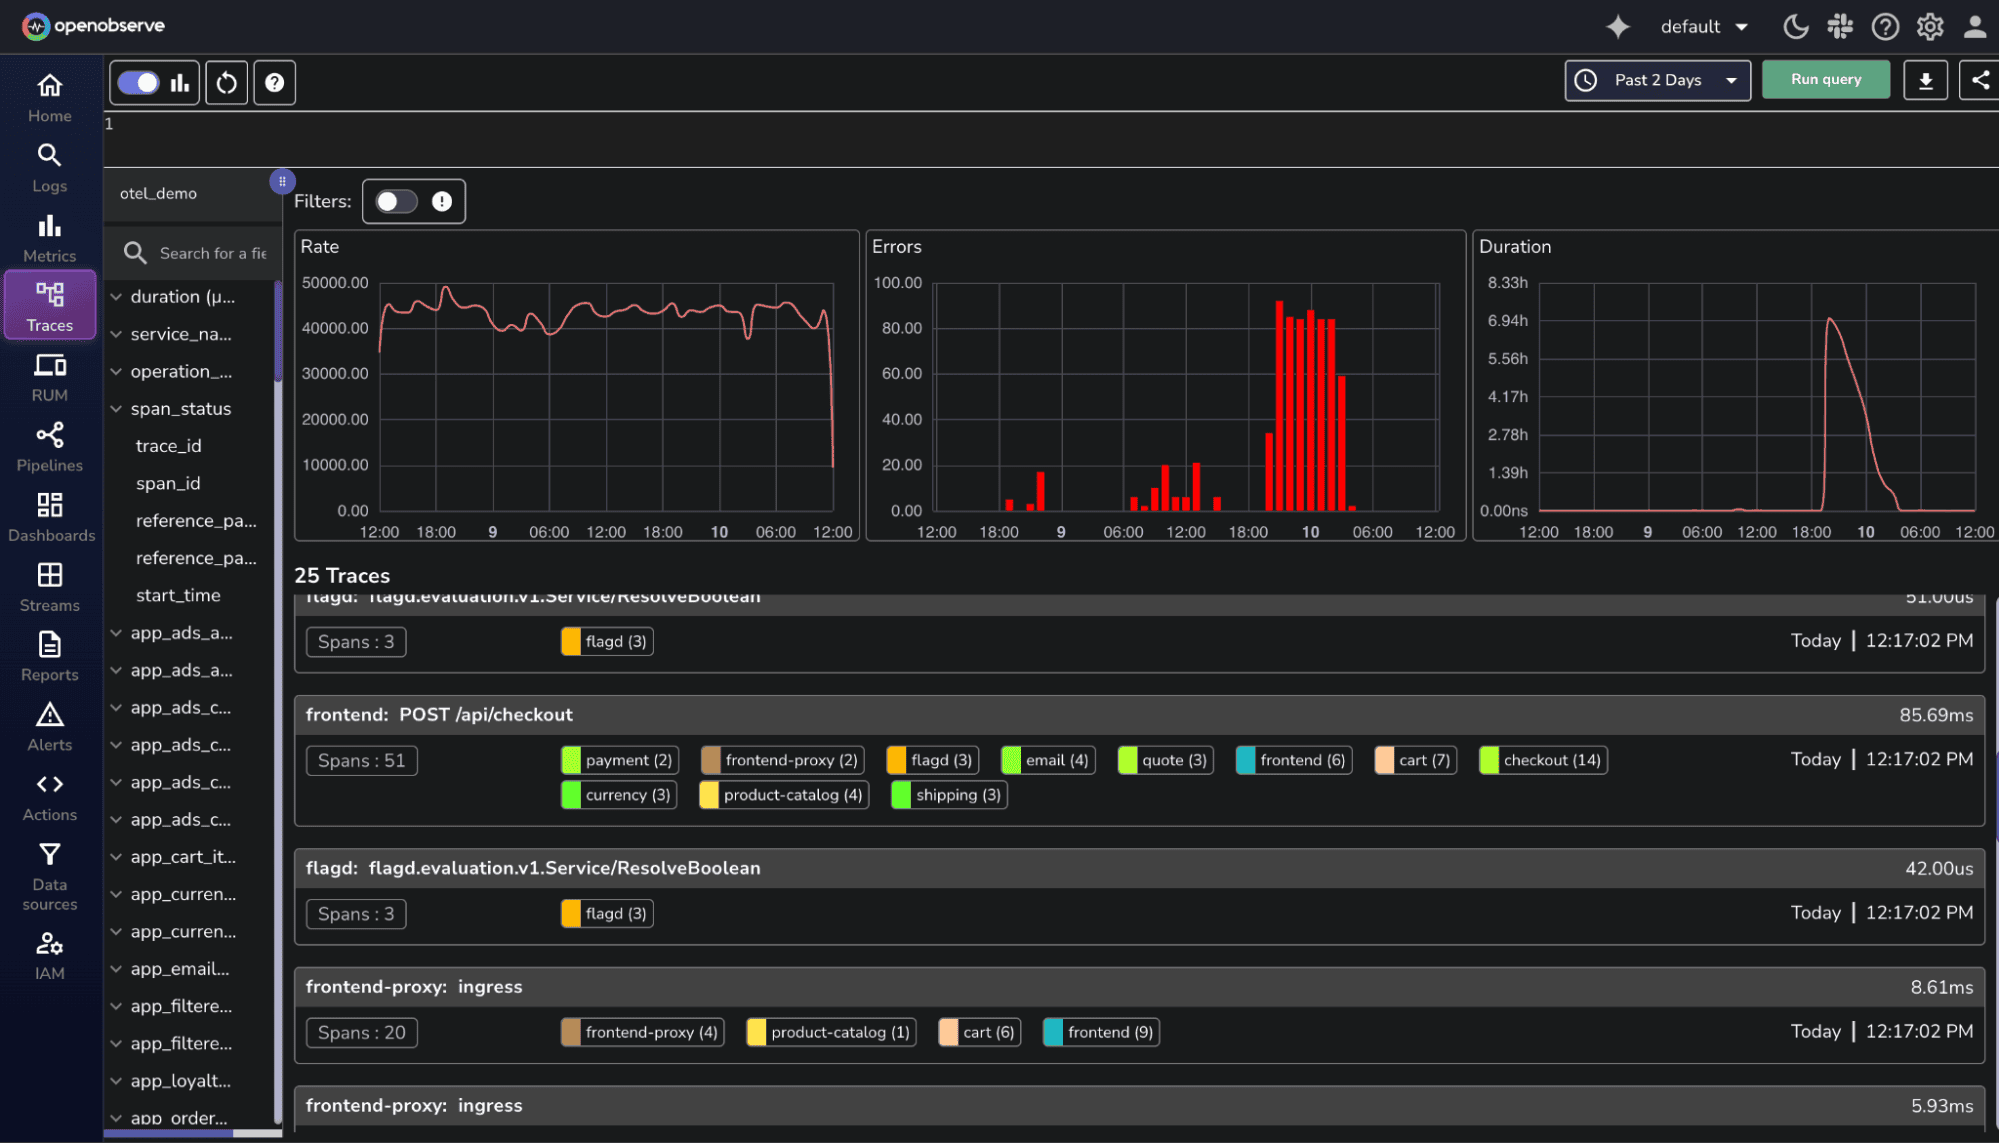
- Viewing all the traces: Explore all recorded traces in one place to get a high-level overview of request flows, system activity, and key RED metrics (Requests, Errors, Duration).
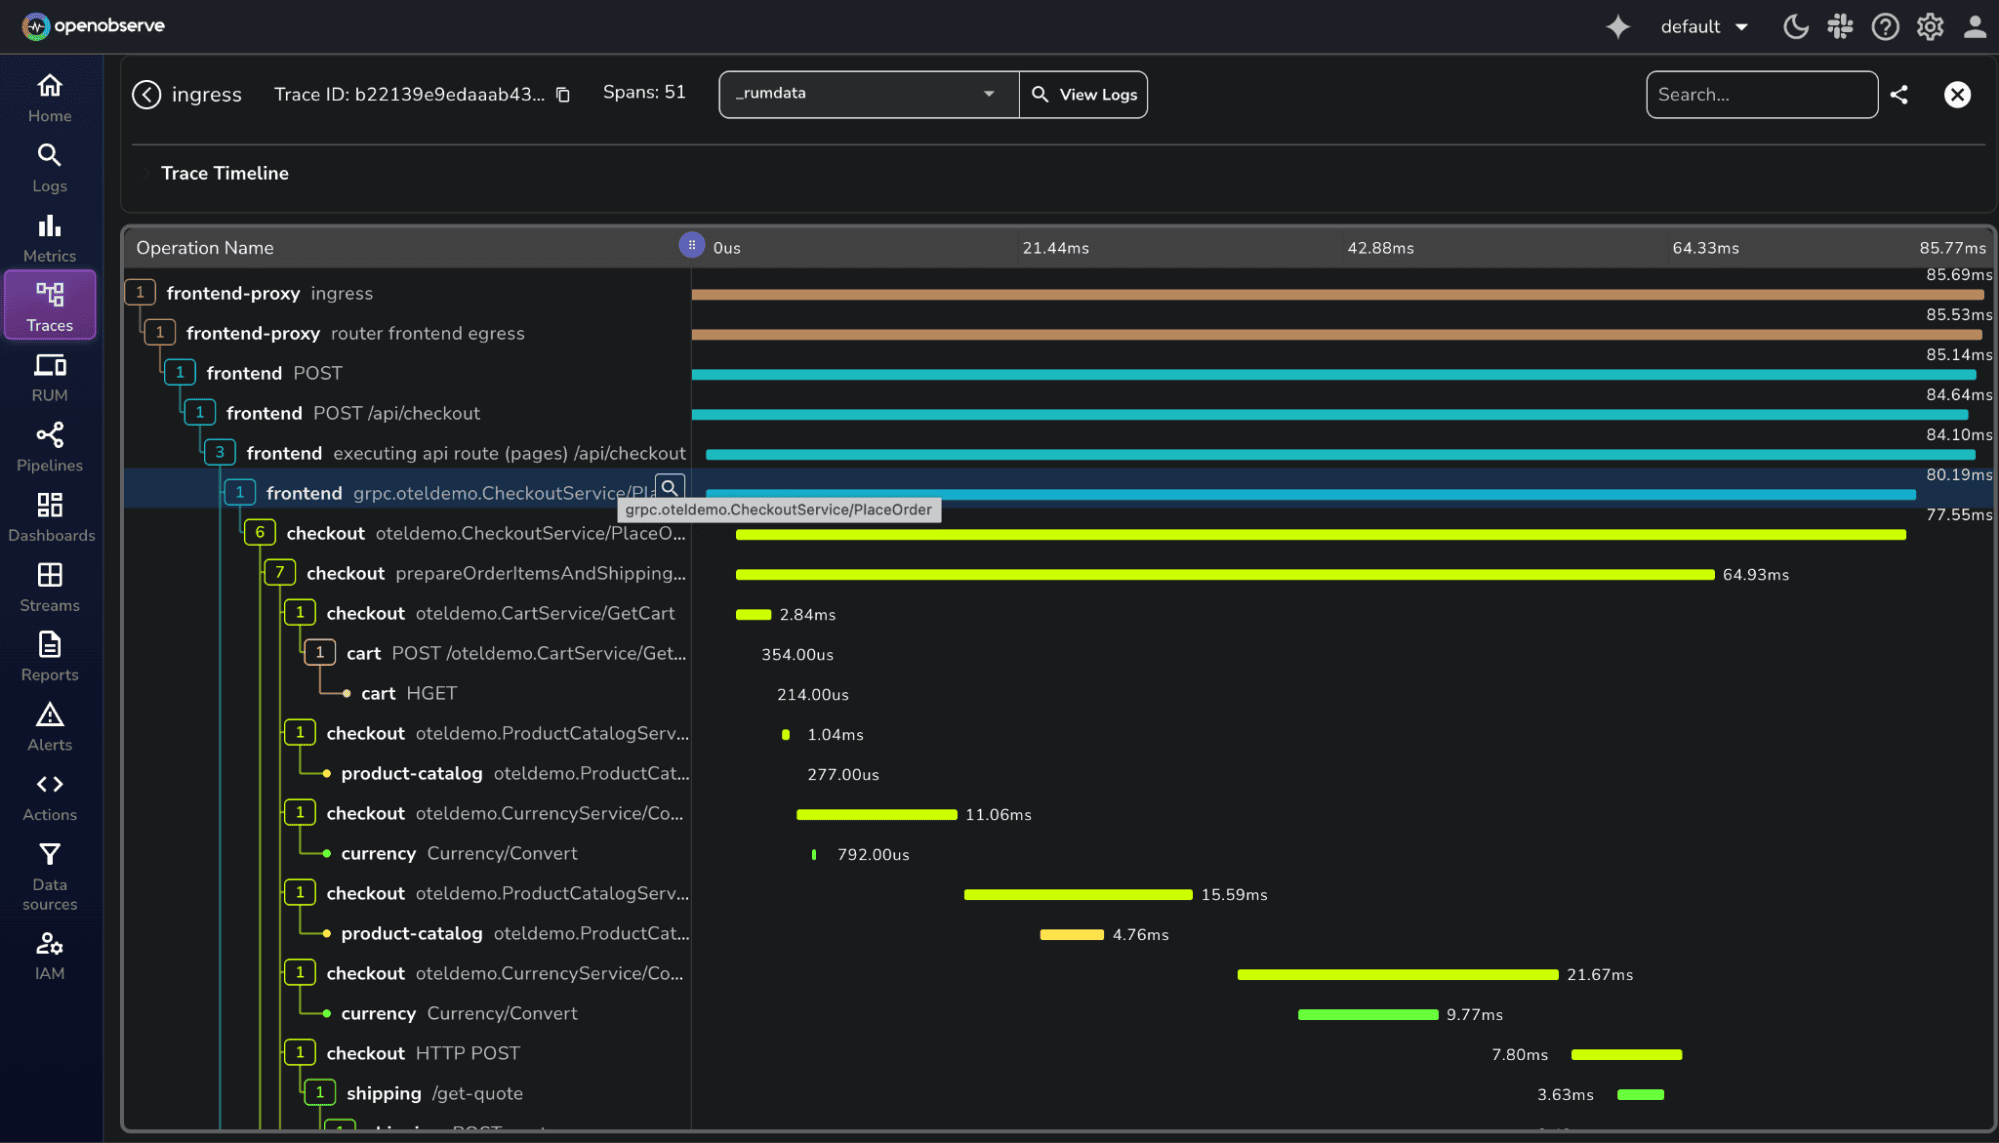
- Viewing all the spans of a Trace: Drill down into individual spans within a trace to understand how different microservices and components interacted during a request.
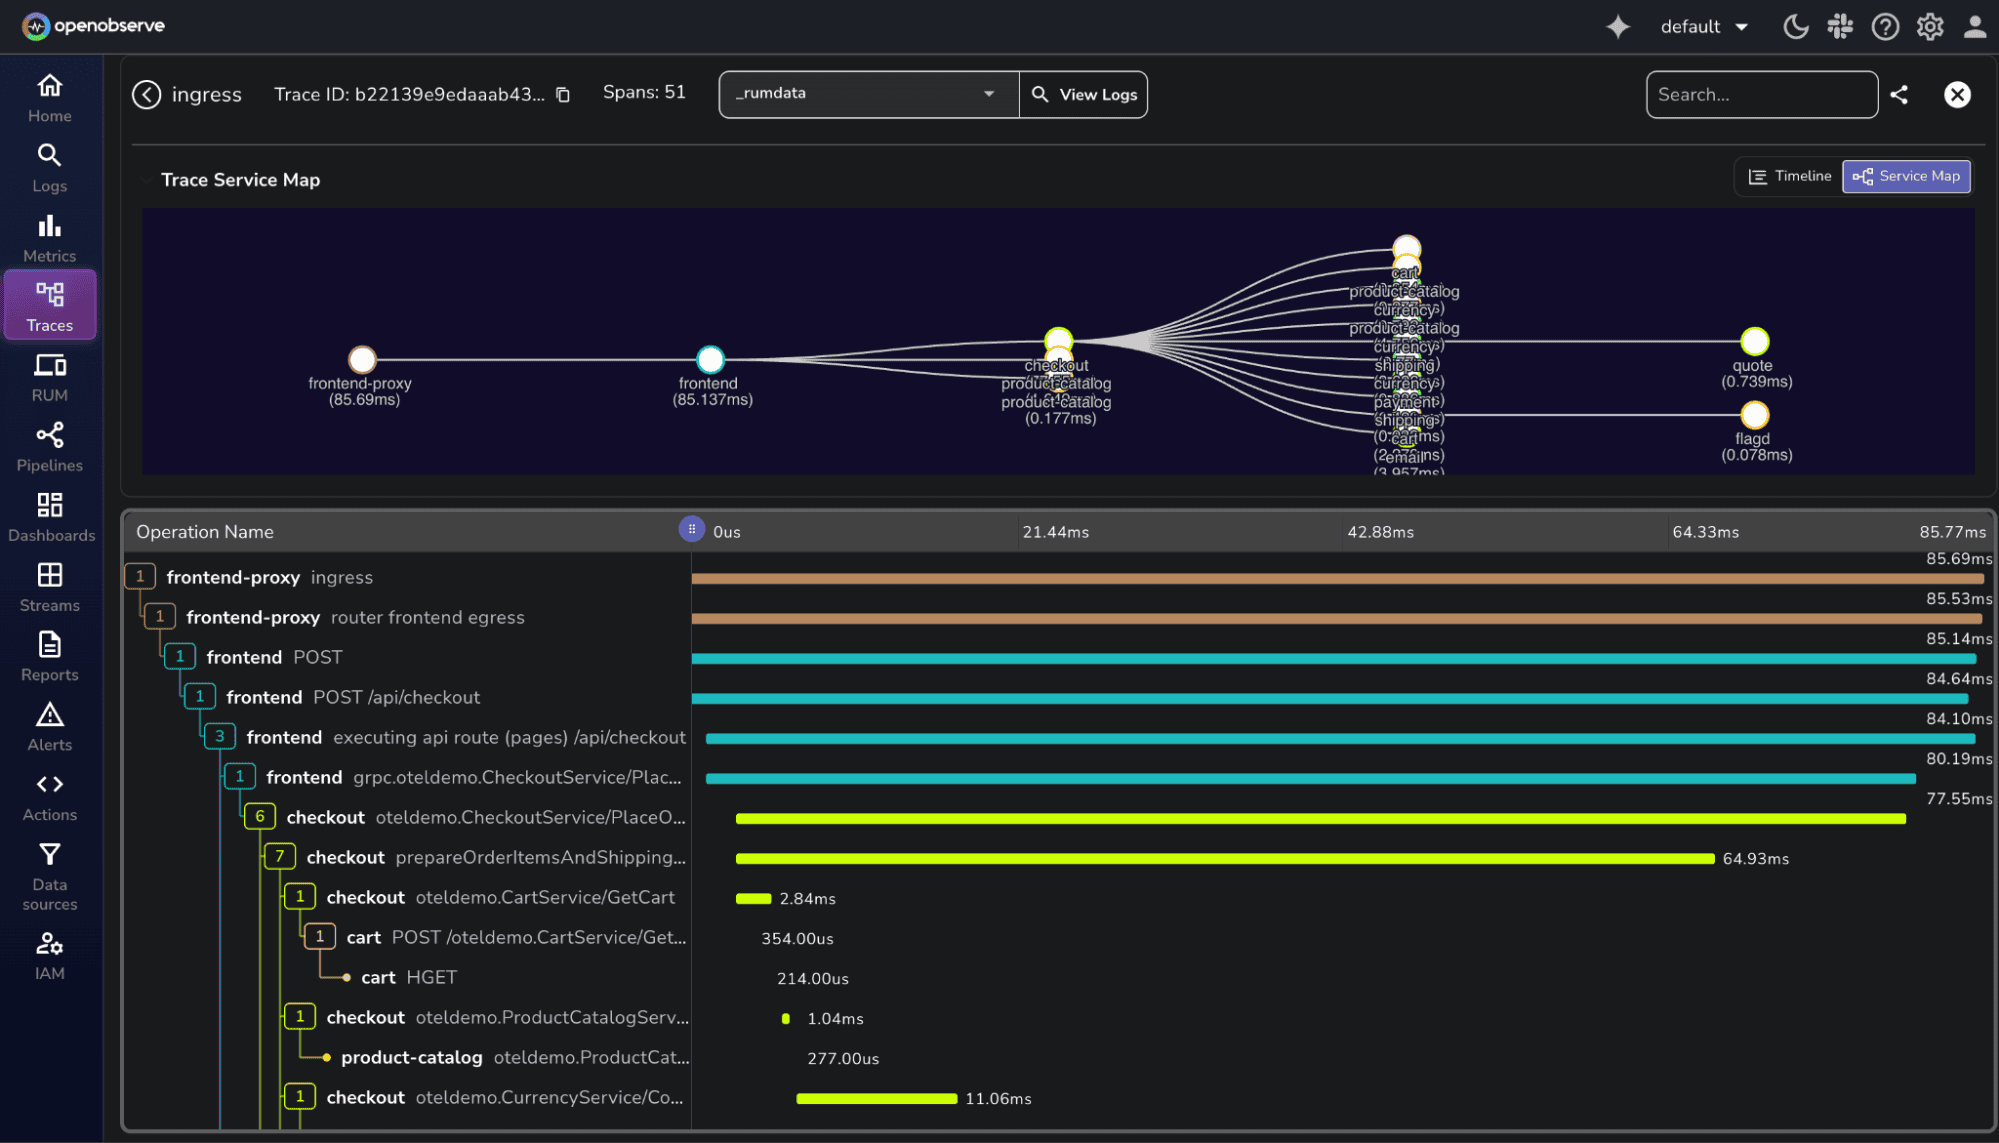
- Service map of entire microservices: Visualize service dependencies and call relationships across the Astronomy Shop, helping you see how components connect and communicate.
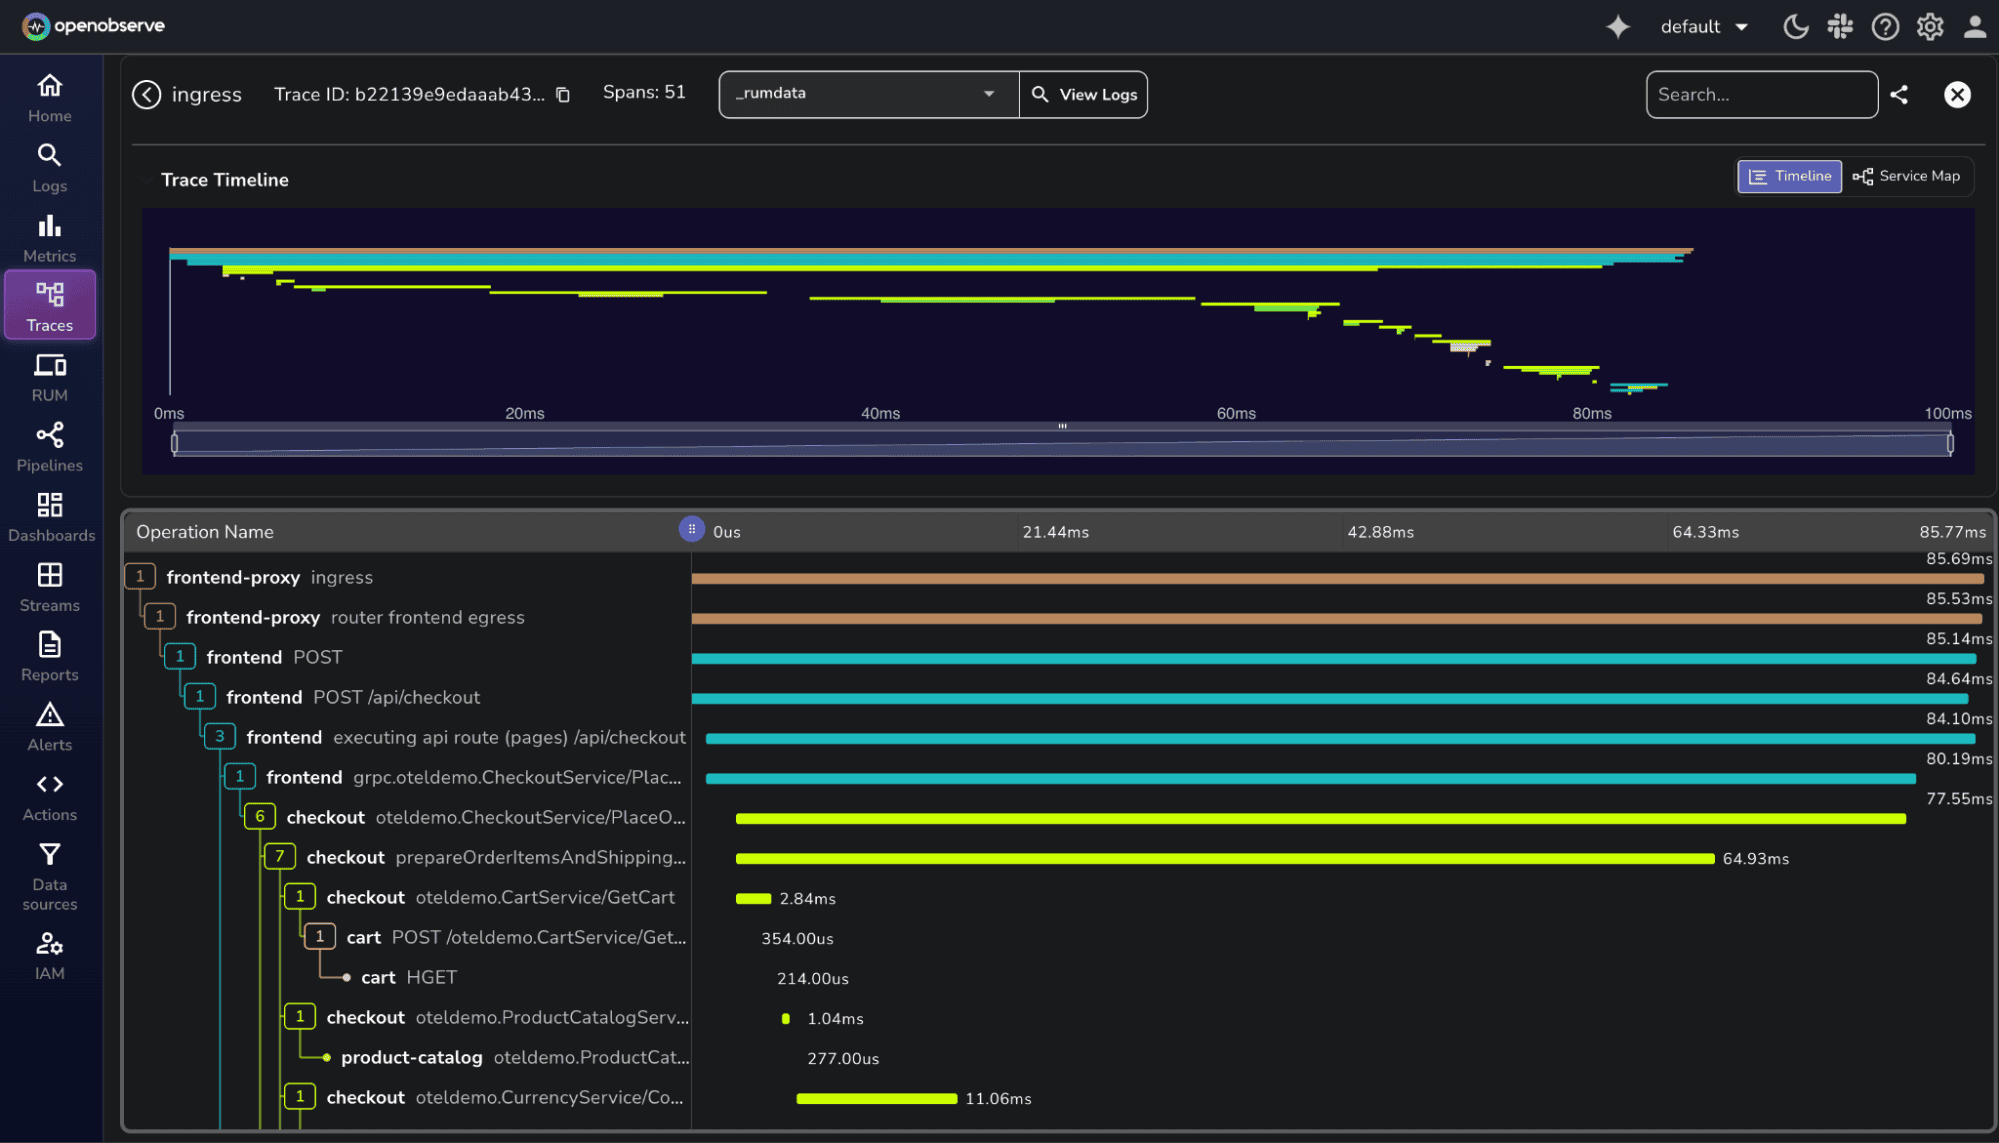
- Trace timeline for the Traces: Analyze request durations with a timeline view that shows latency contributions from each span in the trace.
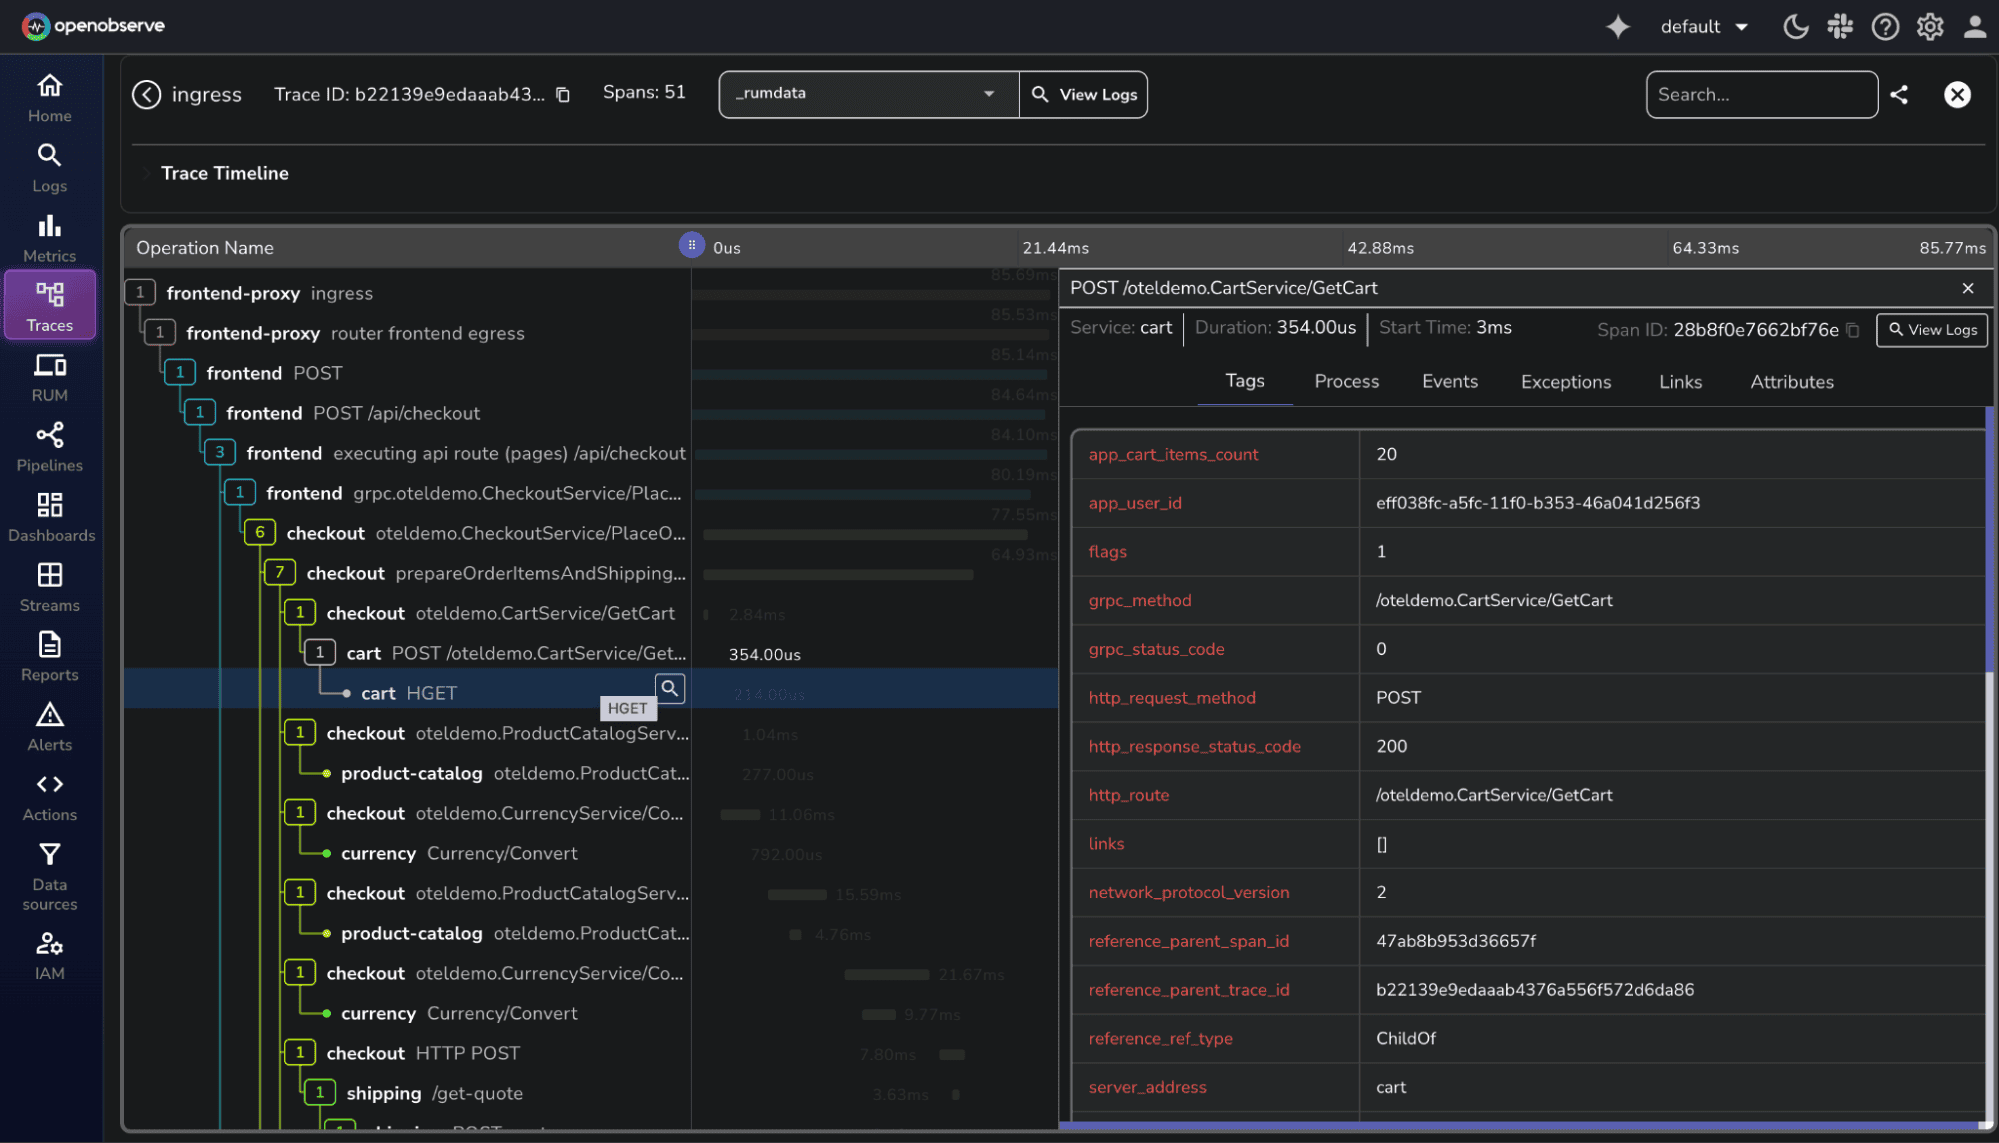
- Viewing attributes and learning more about the transaction: Inspect key attributes such as user IDs, service names, and request methods to get rich context about each transaction.
- Exploring events and exceptions: Dive into exception details and error events emitted by spans to pinpoint the root cause of failures.
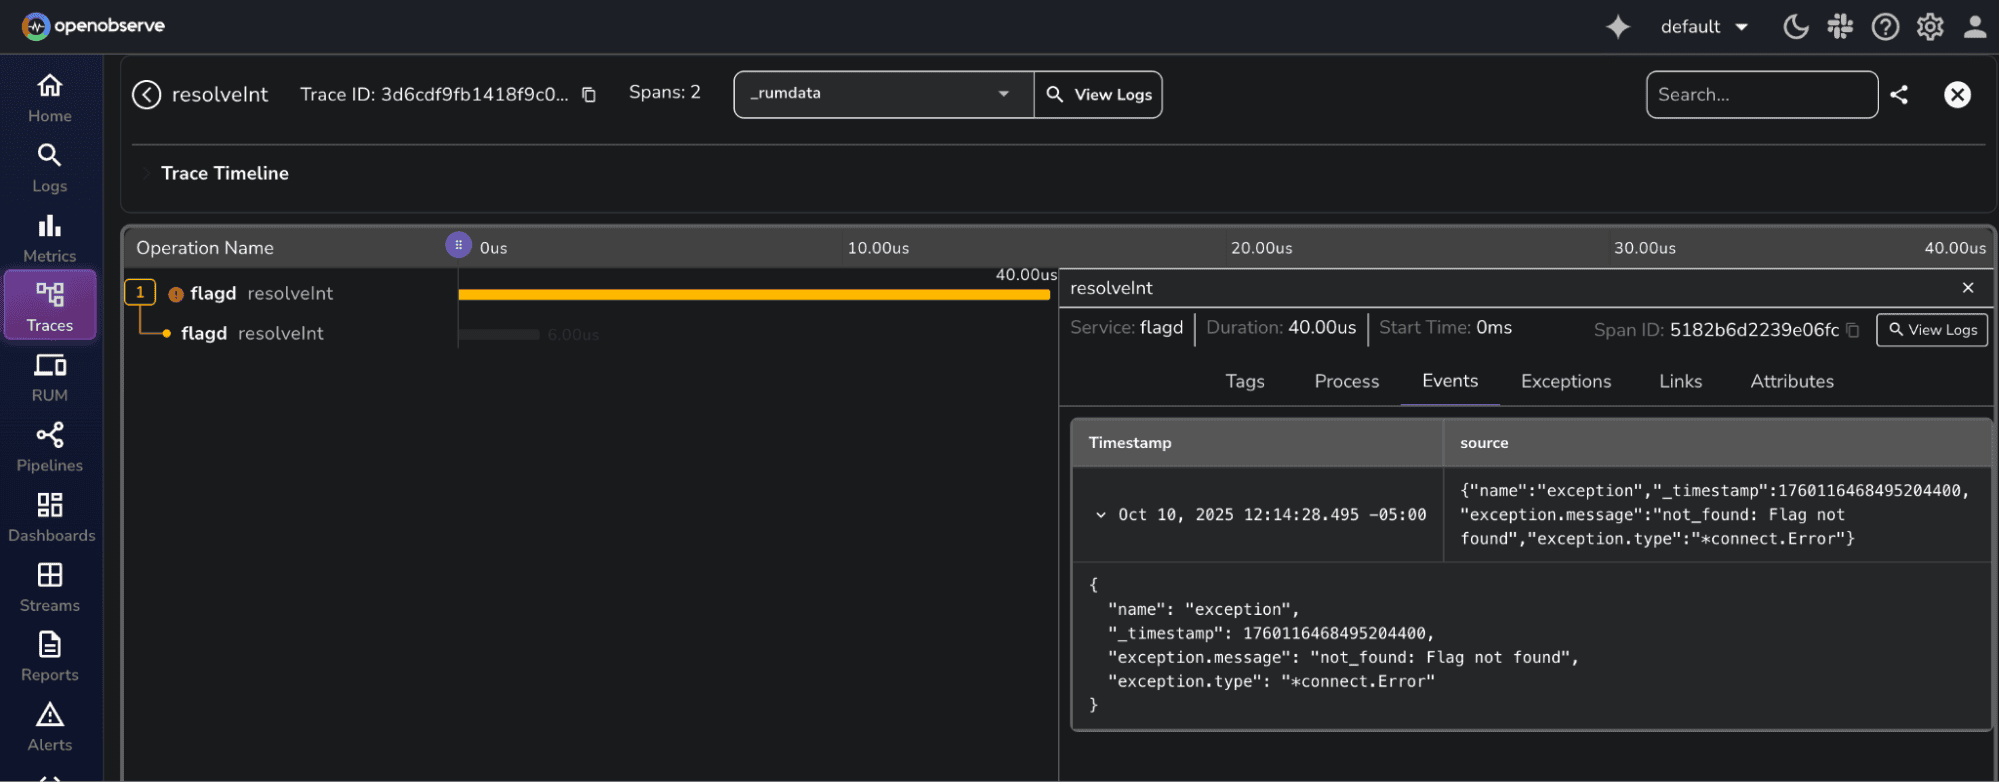
- Correlate Traces with Logs: Pivot from a trace to its associated logs, providing a full picture of what happened during a transaction.

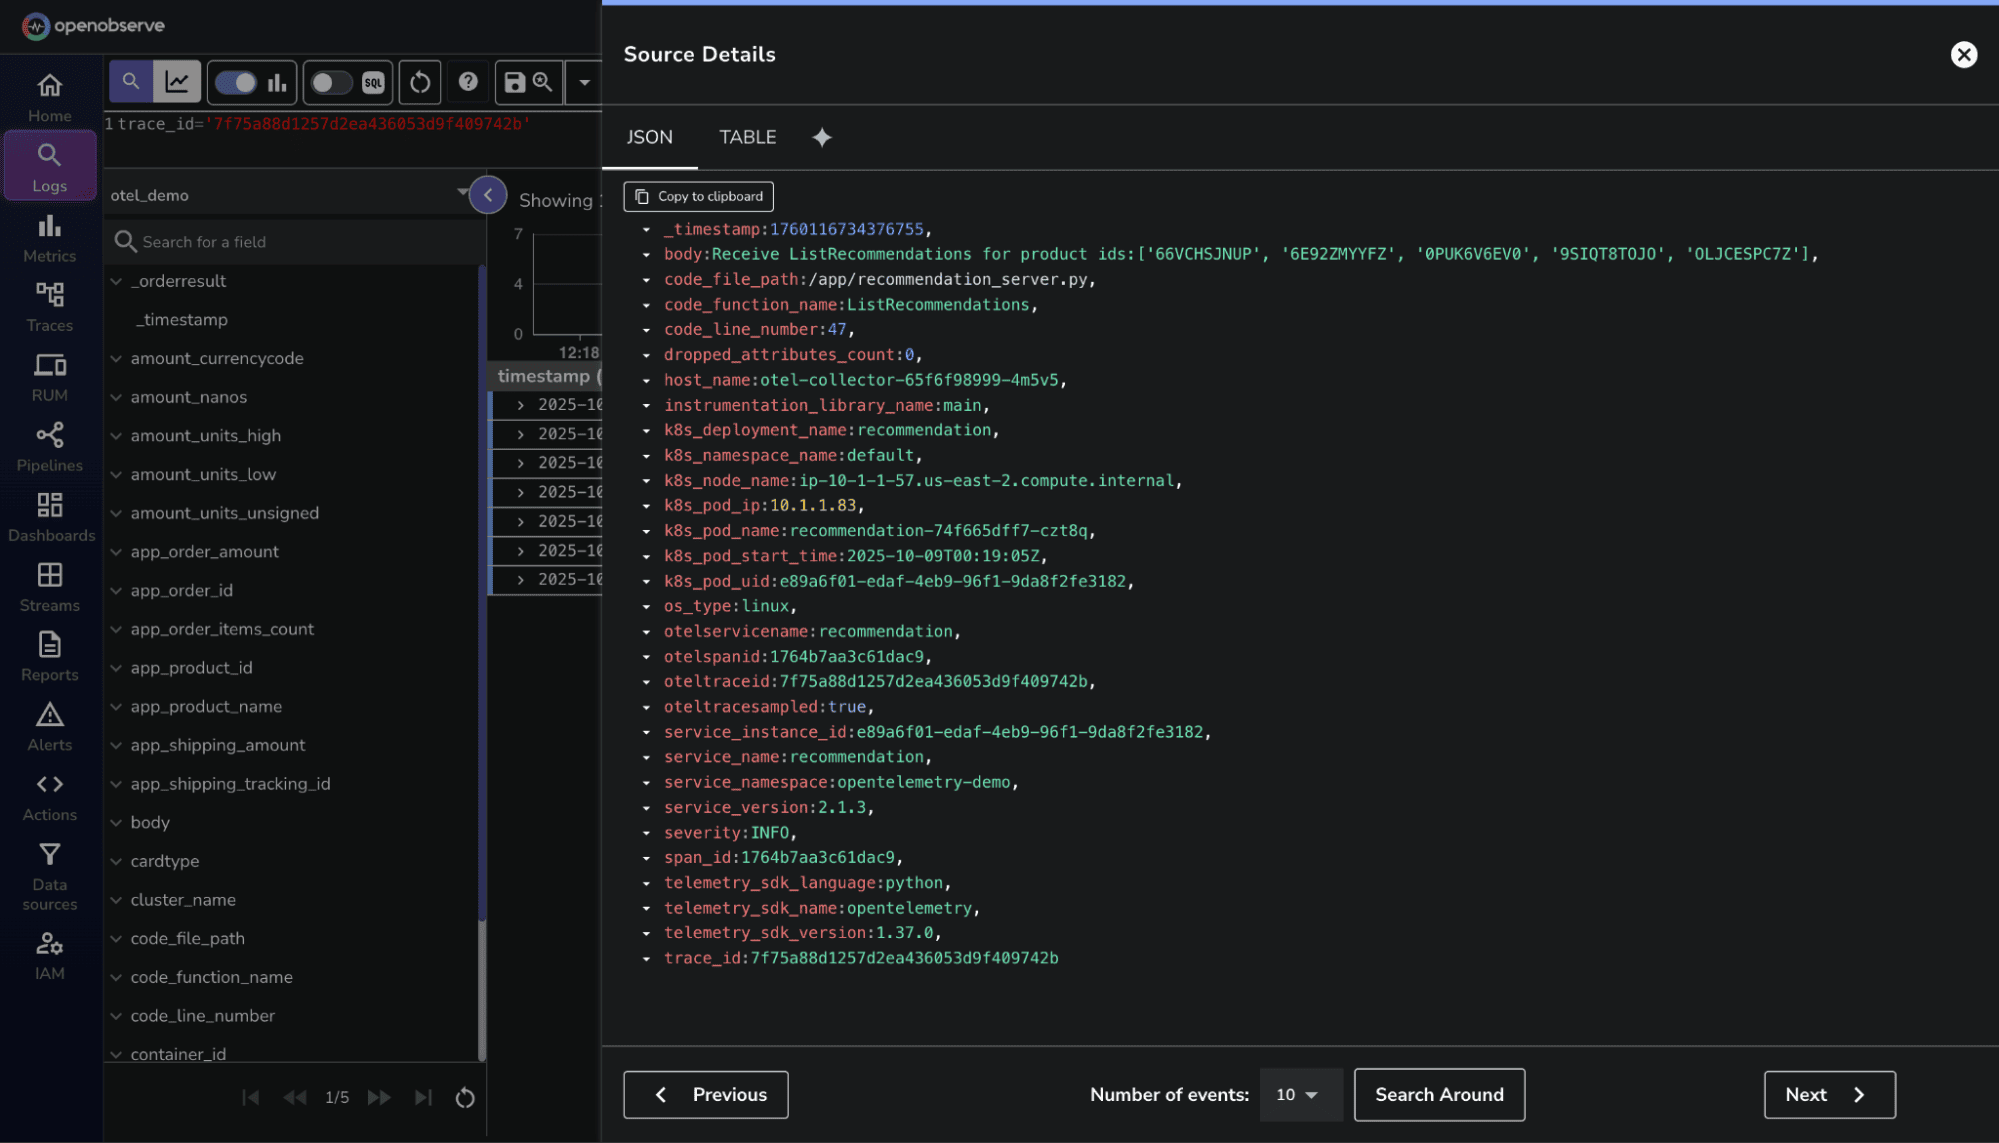
- Logs with selected TraceID: Filter logs by
TraceIDto view log entries that belong to the same transaction, perfect for debugging distributed requests.
What's Next?
With your demo running, you can experiment with different observability scenarios, create custom dashboards, set up alerts, and get hands-on experience with distributed tracing. The Astronomy Shop generates realistic traffic patterns across multiple microservices, making it an excellent playground for learning OpenTelemetry and OpenObserve.
Additional Resources
Learn more about Openobserve and OpenTelemetry and explore our other OTel blogs, including:
- Simplifying Kubernetes Monitoring with OpenTelemetry and OpenObserve
- Implementing OpenTelemetry Logging in .NET Applications
- Distributed Tracing in Node.js Applications with OpenTelemetry
Happy observing!
About the Author
Chaitanya Sistla

Chaitanya Sistla is a Principal Solutions Architect with 17X certifications across Cloud, Data, DevOps, and Cybersecurity. Leveraging extensive startup experience and a focus on MLOps, Chaitanya excels at designing scalable, innovative solutions that drive operational excellence and business transformation.
Follow OpenObserve on Google
Add OpenObserve as a preferred source to see more of our articles in Google Search and Top Stories.












