How to Import Prebuilt Kubernetes (K8s) Dashboards in OpenObserve




Ready to get started?
Try OpenObserve Cloud today for more efficient and performant observability.
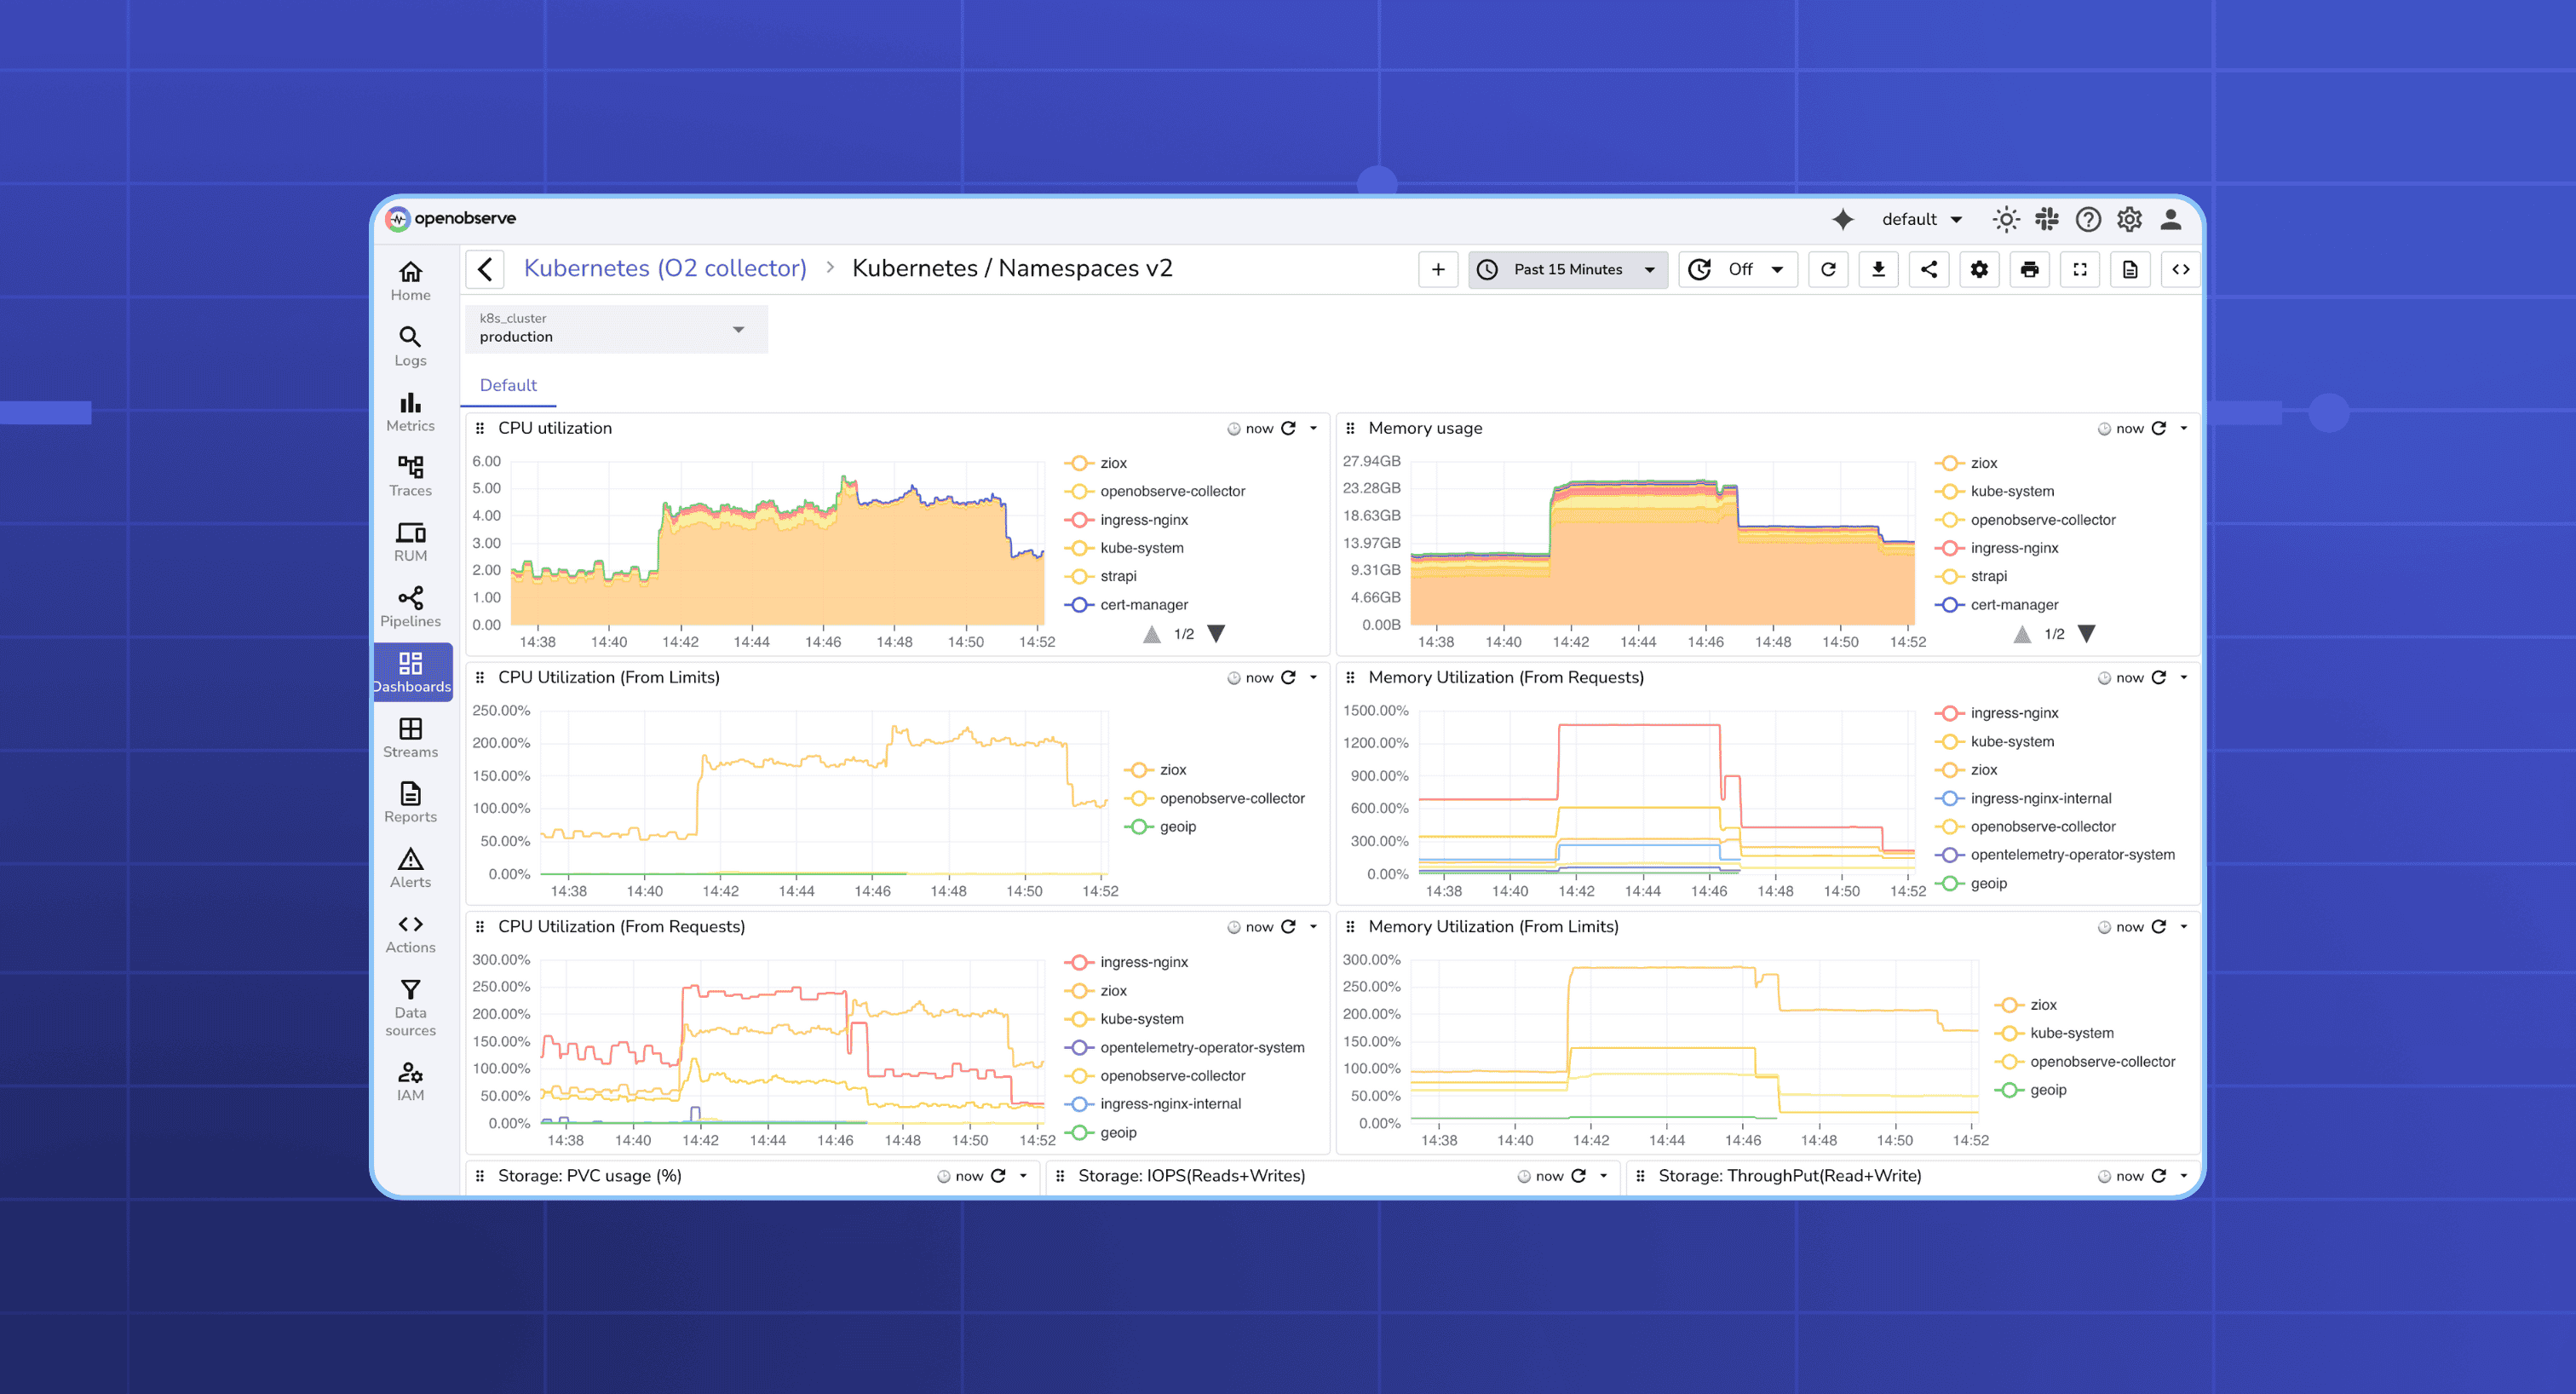
Kubernetes clusters generate valuable metrics, logs, and traces data. And while building dashboards from scratch to capture this date, it can be time-consuming and error-prone. Prebuilt Kubernetes (K8s) dashboards in OpenObserve let you start monitoring clusters, workloads, and pods immediately with industry best practices already integrated.
The Challenge with Native K8s Dashboards
Native K8s dashboards are useful for quick inspections but fall short for production monitoring, offering only basic metrics. They do not include logs, traces, alerts, or historical analysis. OpenObserve solves this with ready-to-use, production-grade prebuilt dashboards that combine metrics, logs, traces, alerts, and SLO tracking. With this approach, teams are provided instant, end-to-end observability across clusters, namespaces, and workloads.
Why Prebuilt Kubernetes Dashboards Matter
OpenObserve offers ready-to-use, production-grade K8s dashboards, so you can stop spending hours building panels and start focusing on observability that truly matters. These dashboards are designed for critical Kubernetes events and metrics, providing:
- Time Savings: Skip manual creation of panels and queries,get a full cluster view instantly.
- Proactive Observability: Focus on detecting issues before they impact users, rather than just building dashboards.
- Best Practices Out of the Box: Panels are optimized for cluster, pod, and node metrics, following production-grade monitoring standards.
- Consistency Across Teams: Everyone monitors Kubernetes with the same baseline dashboards, reducing confusion and onboarding friction.
- Instant Insights: Quickly visualize CPU, memory, pod status, error rates, network traffic, and more.
With OpenObserve, you get prebuilt K8s dashboards that are not just templates, they’re actionable, production-ready observability tools.
Prerequisite: Collect Kubernetes Logs & Metrics
Before you can use the OpenObserve Kubernetes Monitoring Dashboard, you need to ensure your cluster telemetry is flowing into OpenObserve. The dashboards are built on top of your cluster’s logs, metrics, and traces.
Navigate to Data Sources page and follow the set of commands under Kubernetes section to get the telemetry data ingested in OpenObserve.
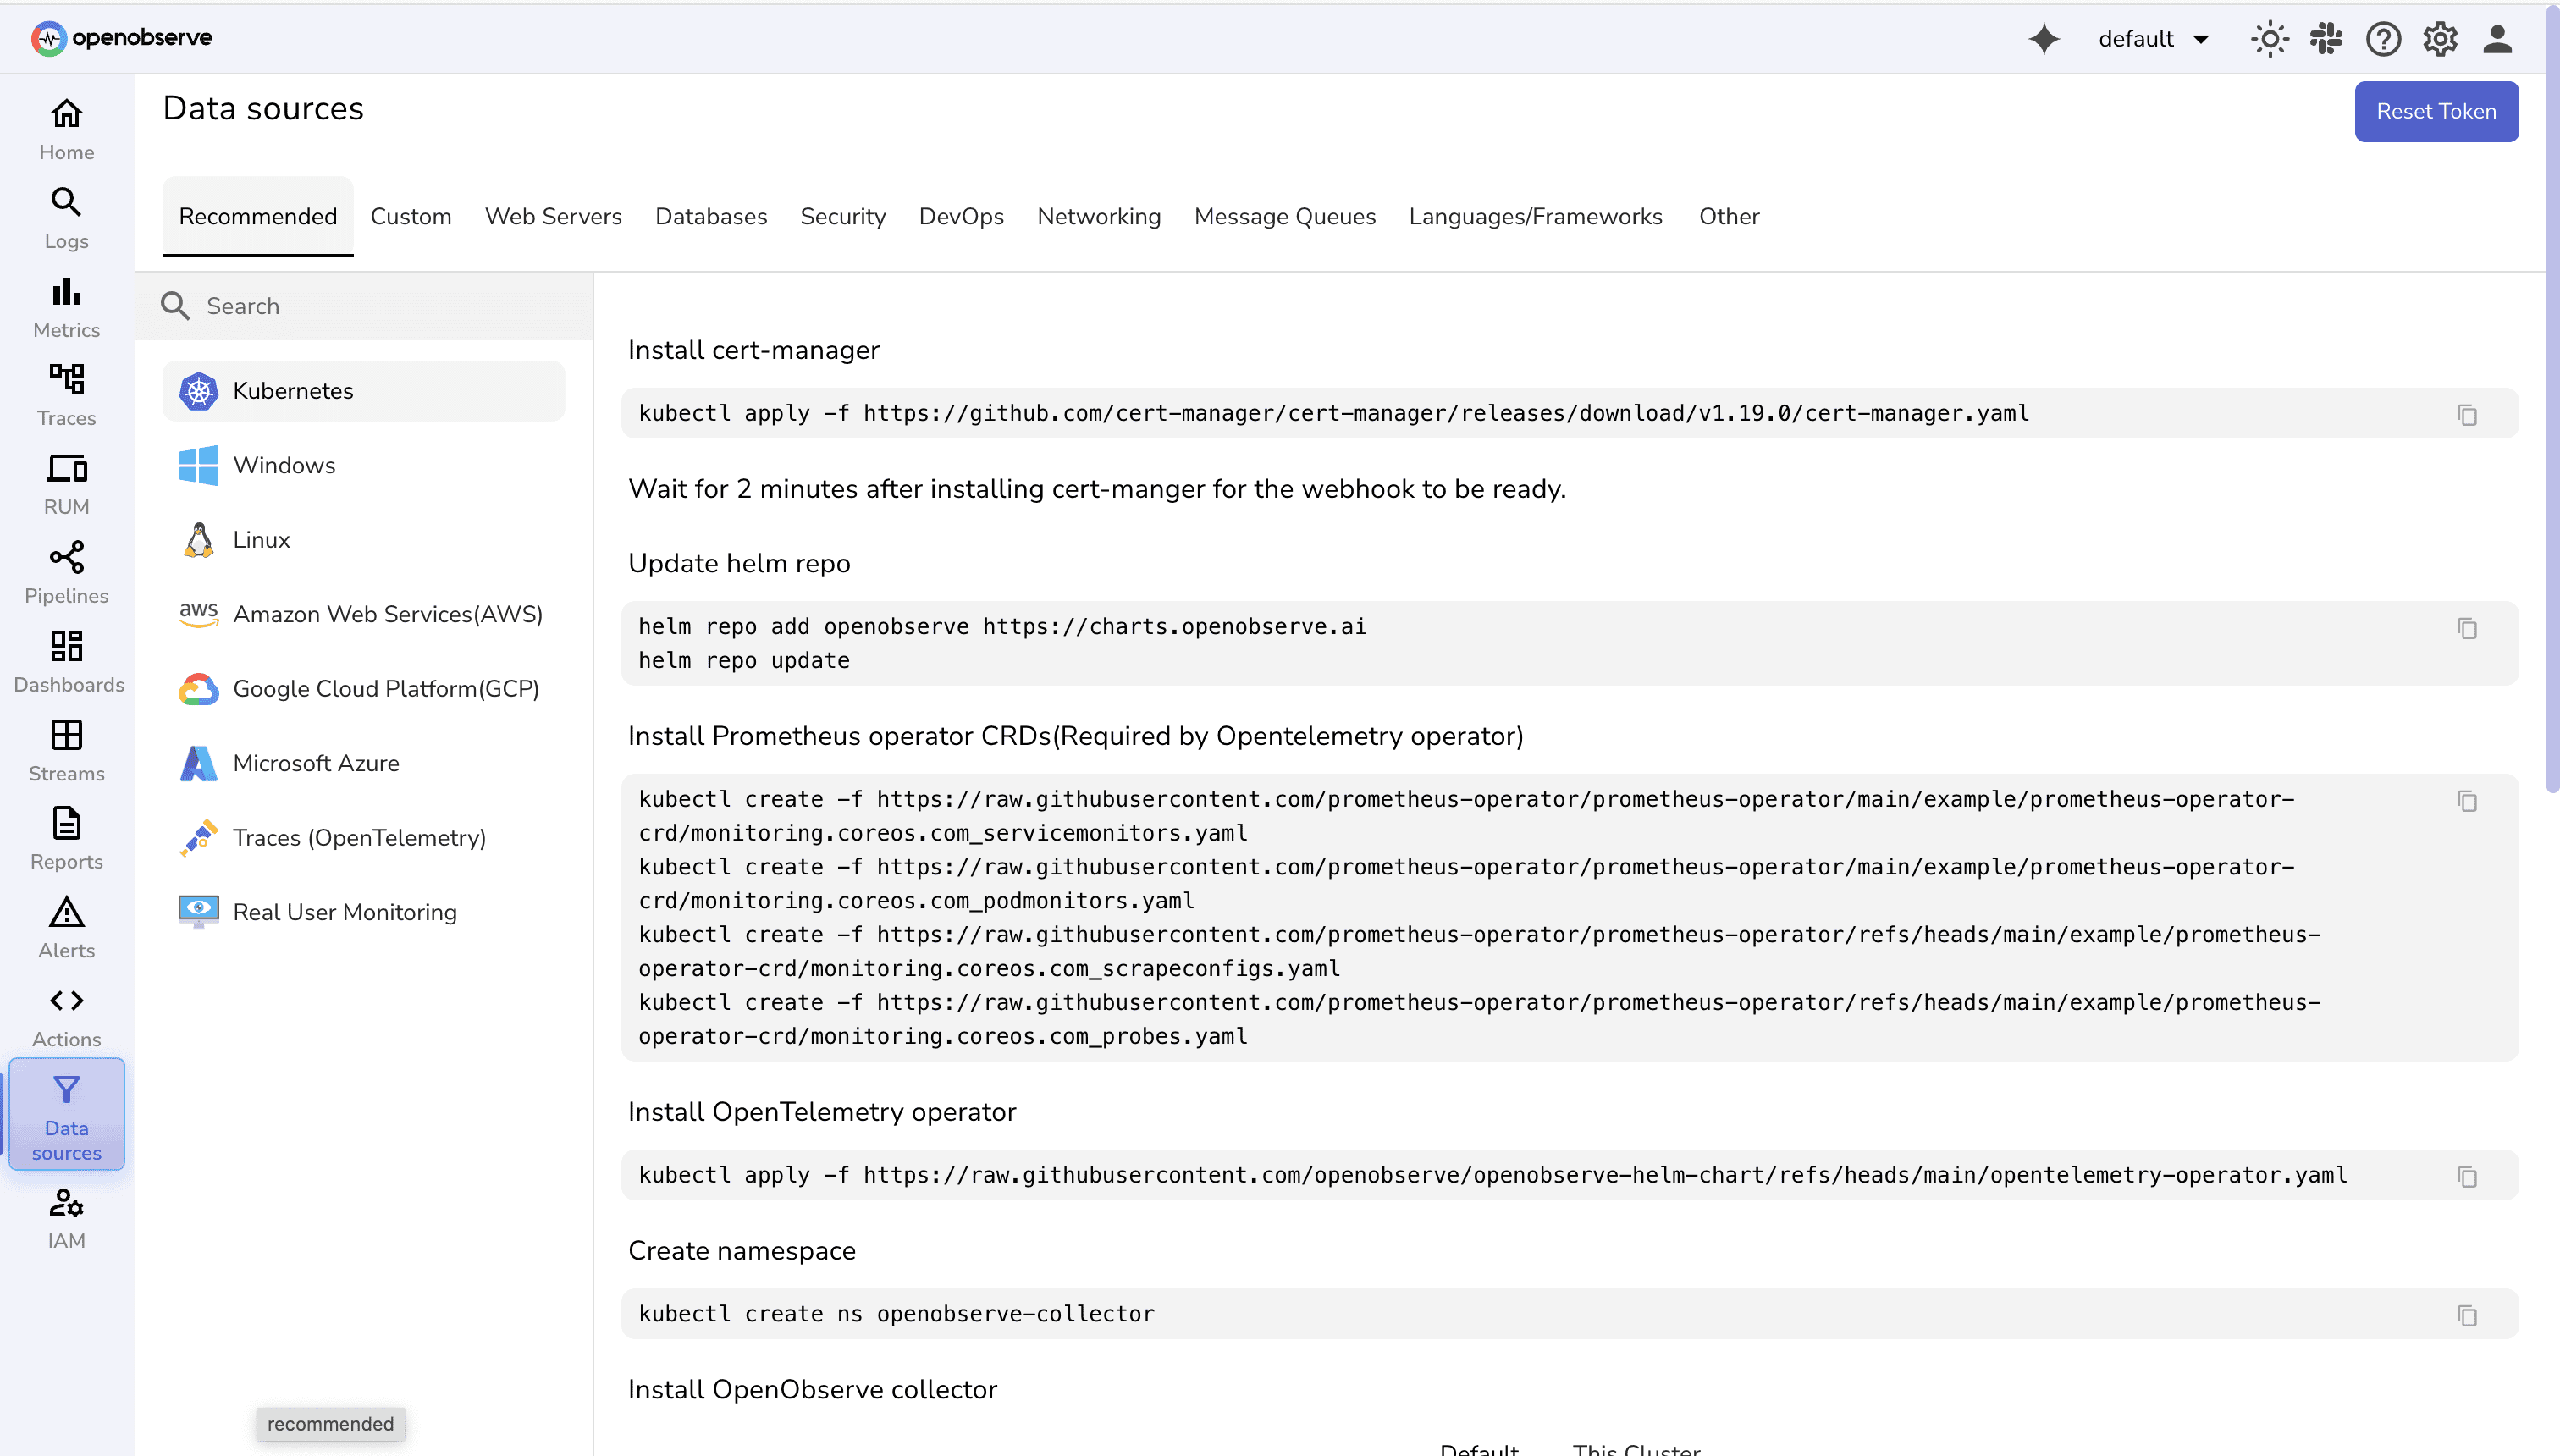
For a detailed step-by-step guide on setting up Kubernetes telemetry with OpenObserve and OpenTelemetry, check out Monitoring K8s with OpenTelemetry.
Step-by-Step Guide to Importing Prebuilt K8s Dashboards
Importing prebuilt K8s dashboards in OpenObserve is straightforward. Follow these steps:
1. Download the Dashboard File
- Dashboards can be imported in OpenObserve in JSON format.
- Source:
2. Access the OpenObserve Dashboard Import
- Open the OpenObserve UI.
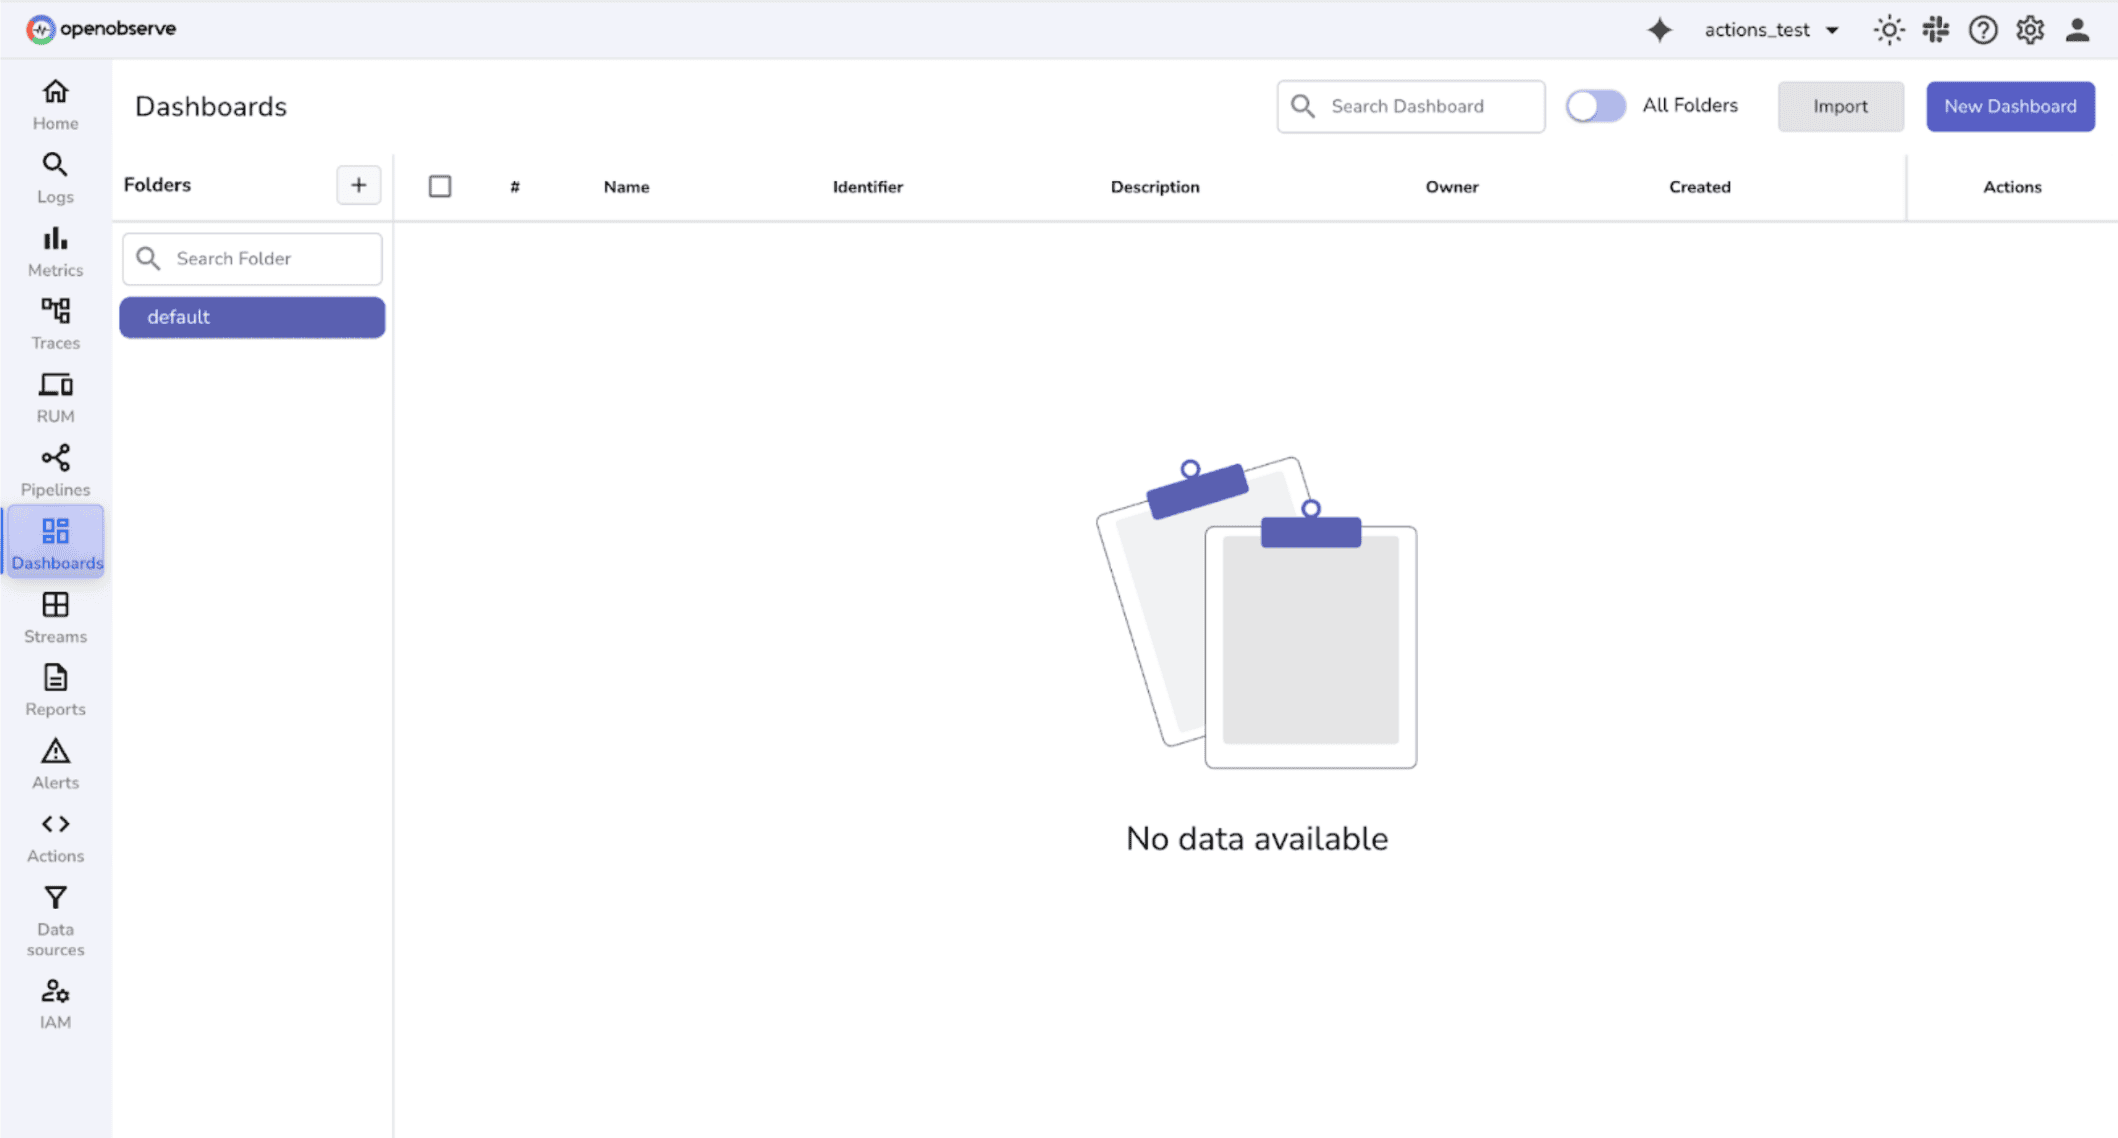
- Navigate to Dashboards → Import.
This is where you’ll upload your prebuilt dashboard file.
3. Upload the File
- Click Upload and select your downloaded JSON file. You can paste the content of the JSON File directly or even use the
URL Importoption.
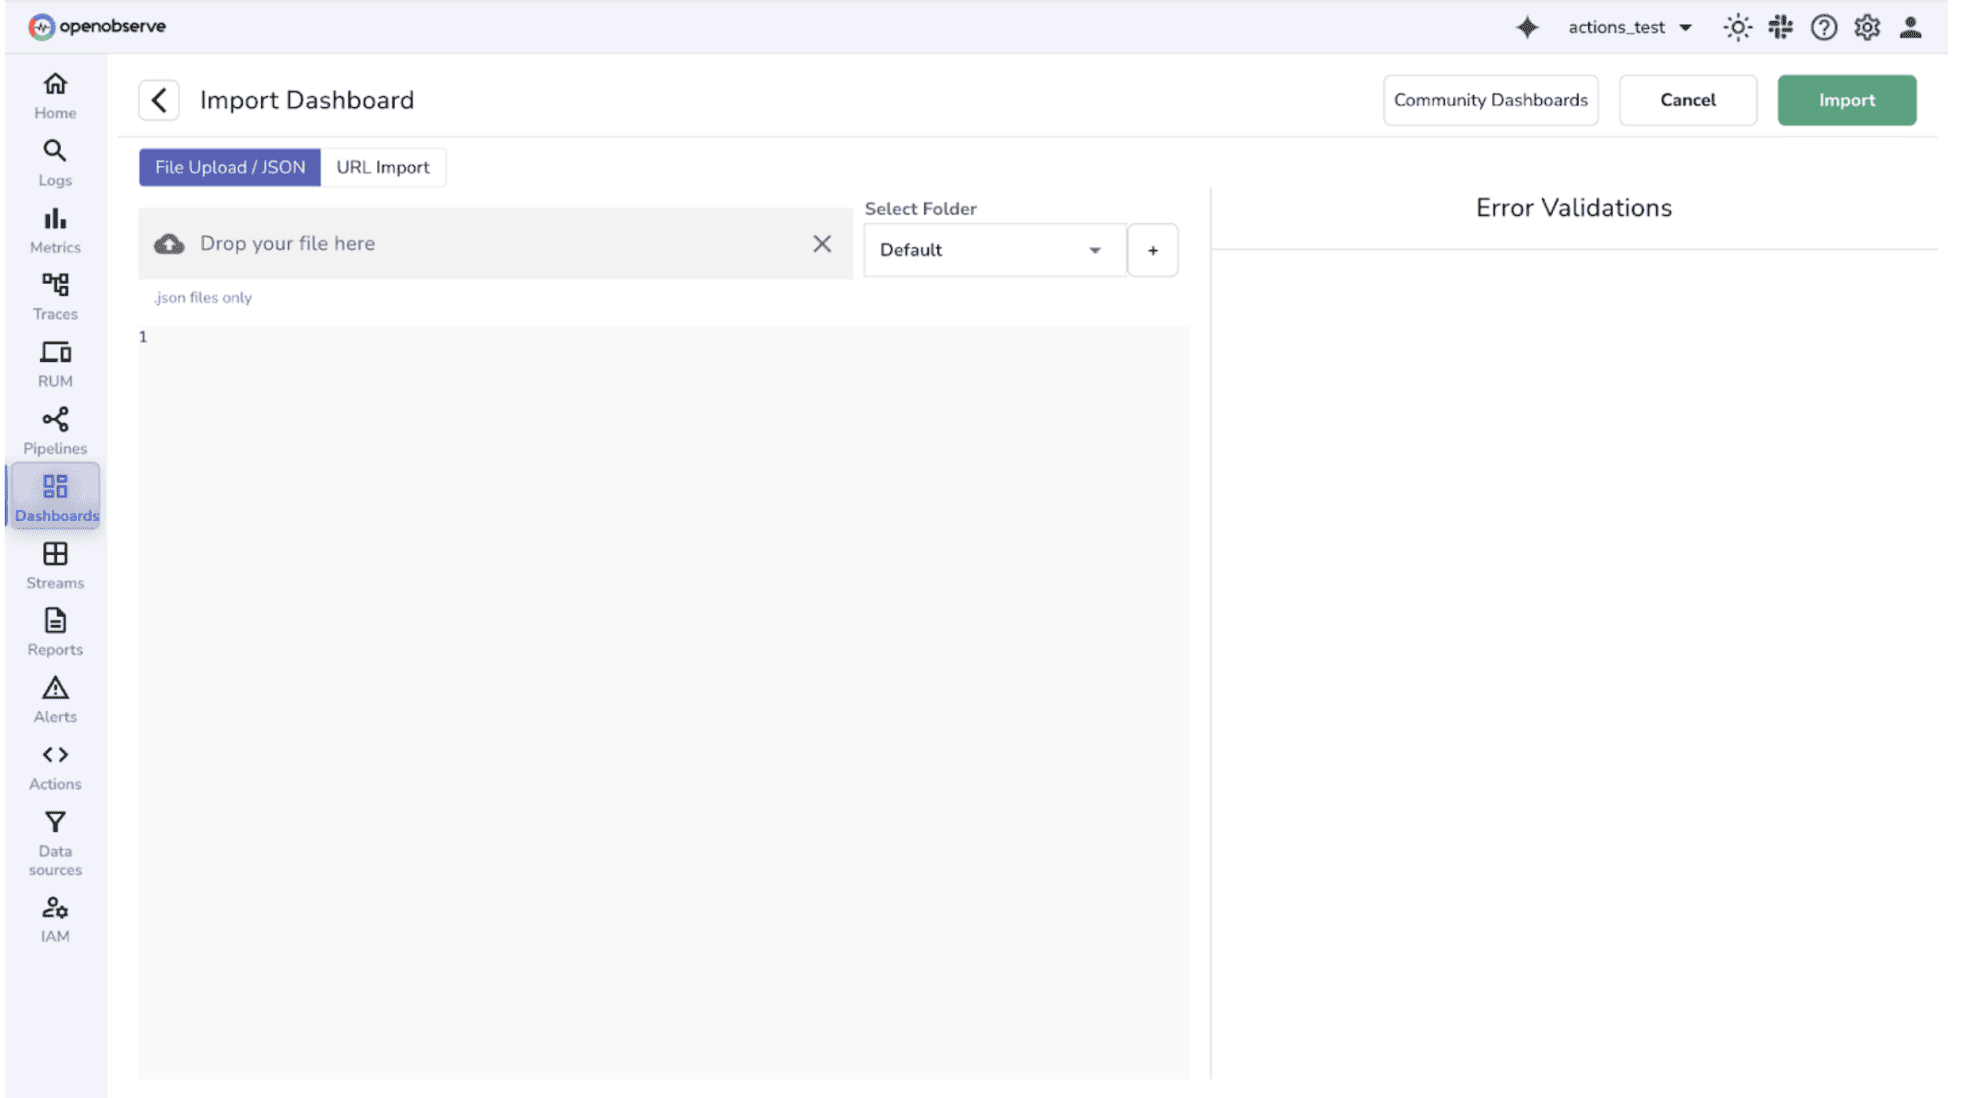
- OpenObserve will parse the file and prepare it for import.
- Hit the
Importbutton and verify that live data is populating the panels correctly.
Tip: Some dashboards may require minor adjustments if field names differ from your environment.
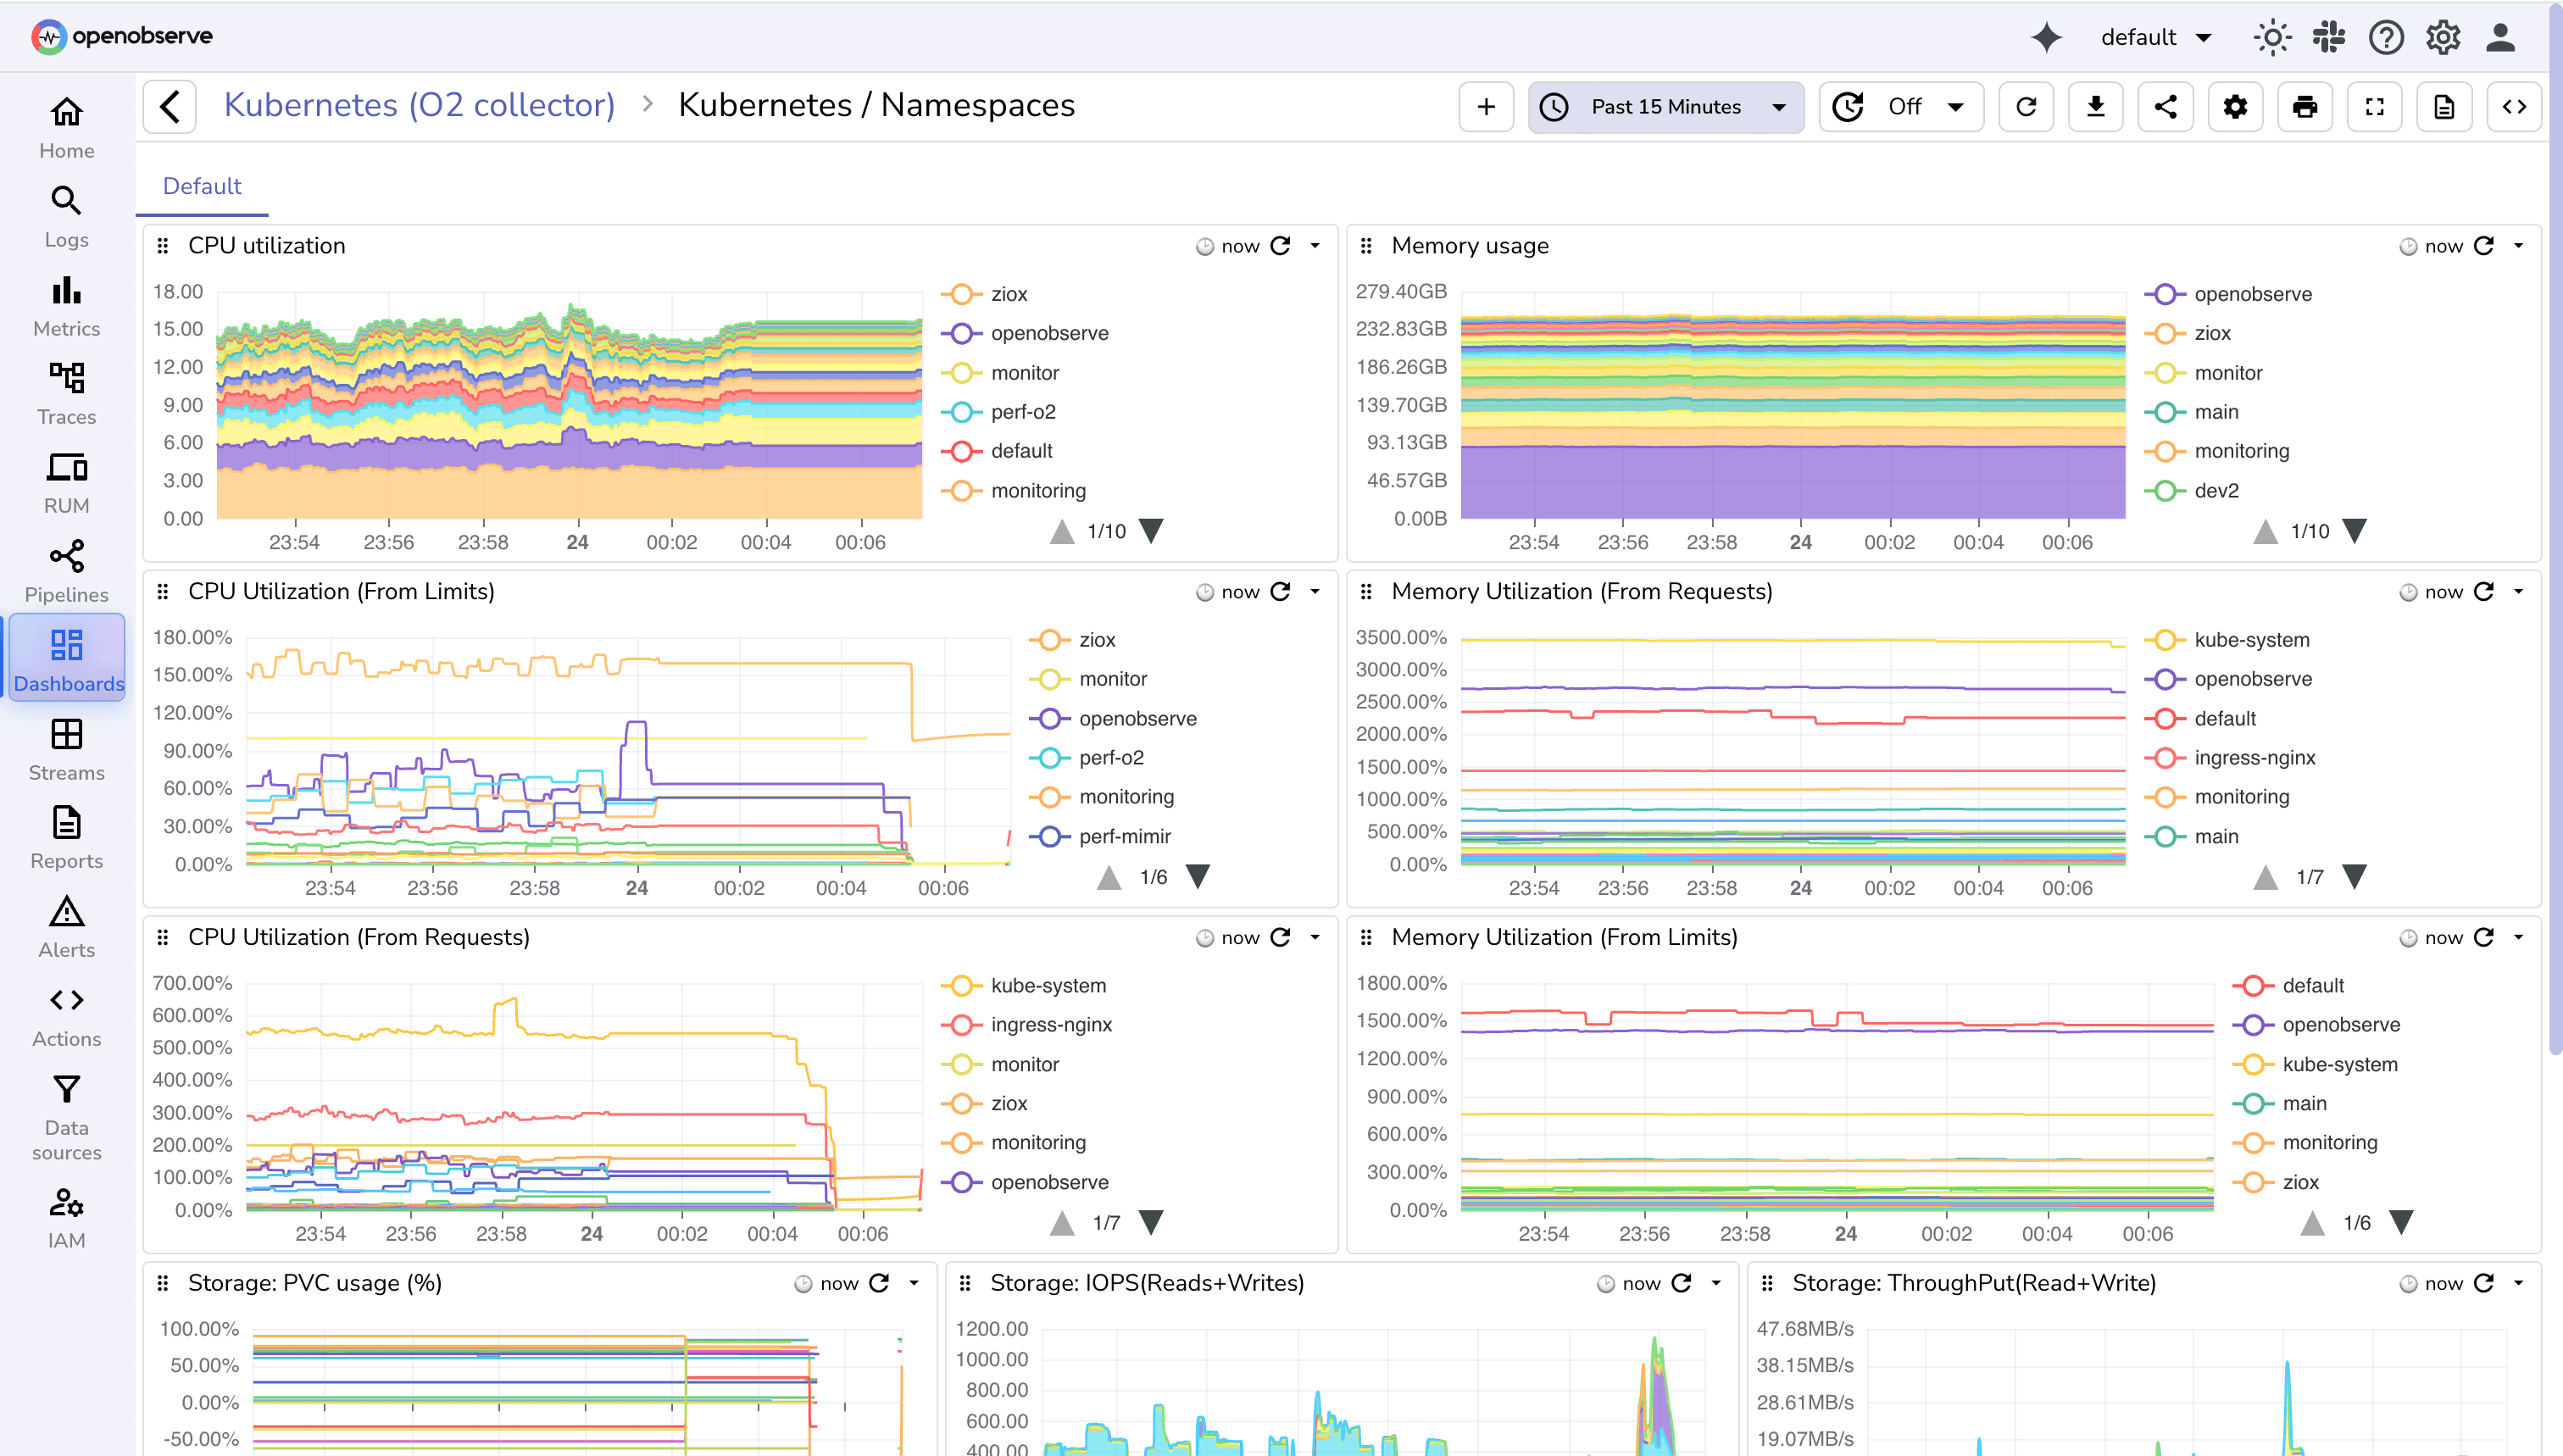
To understand the different K8s dashboard and how they are helpful check here.
4. Customize
- Adjust Metric Names: Ensure queries match your cluster’s metric names (e.g.,
kube_pod_status_phase). - Check Filters & Time Ranges: Ensure panels reflect the correct time window.
- Customize Visualizations: Change chart types, colors, or panel sizes if desired.
Key Pre-built K8s Dashboards
Let’s understand a few commonly used prebuilt K8s dashboards that you can use to monitor your K8s clusters effectively:
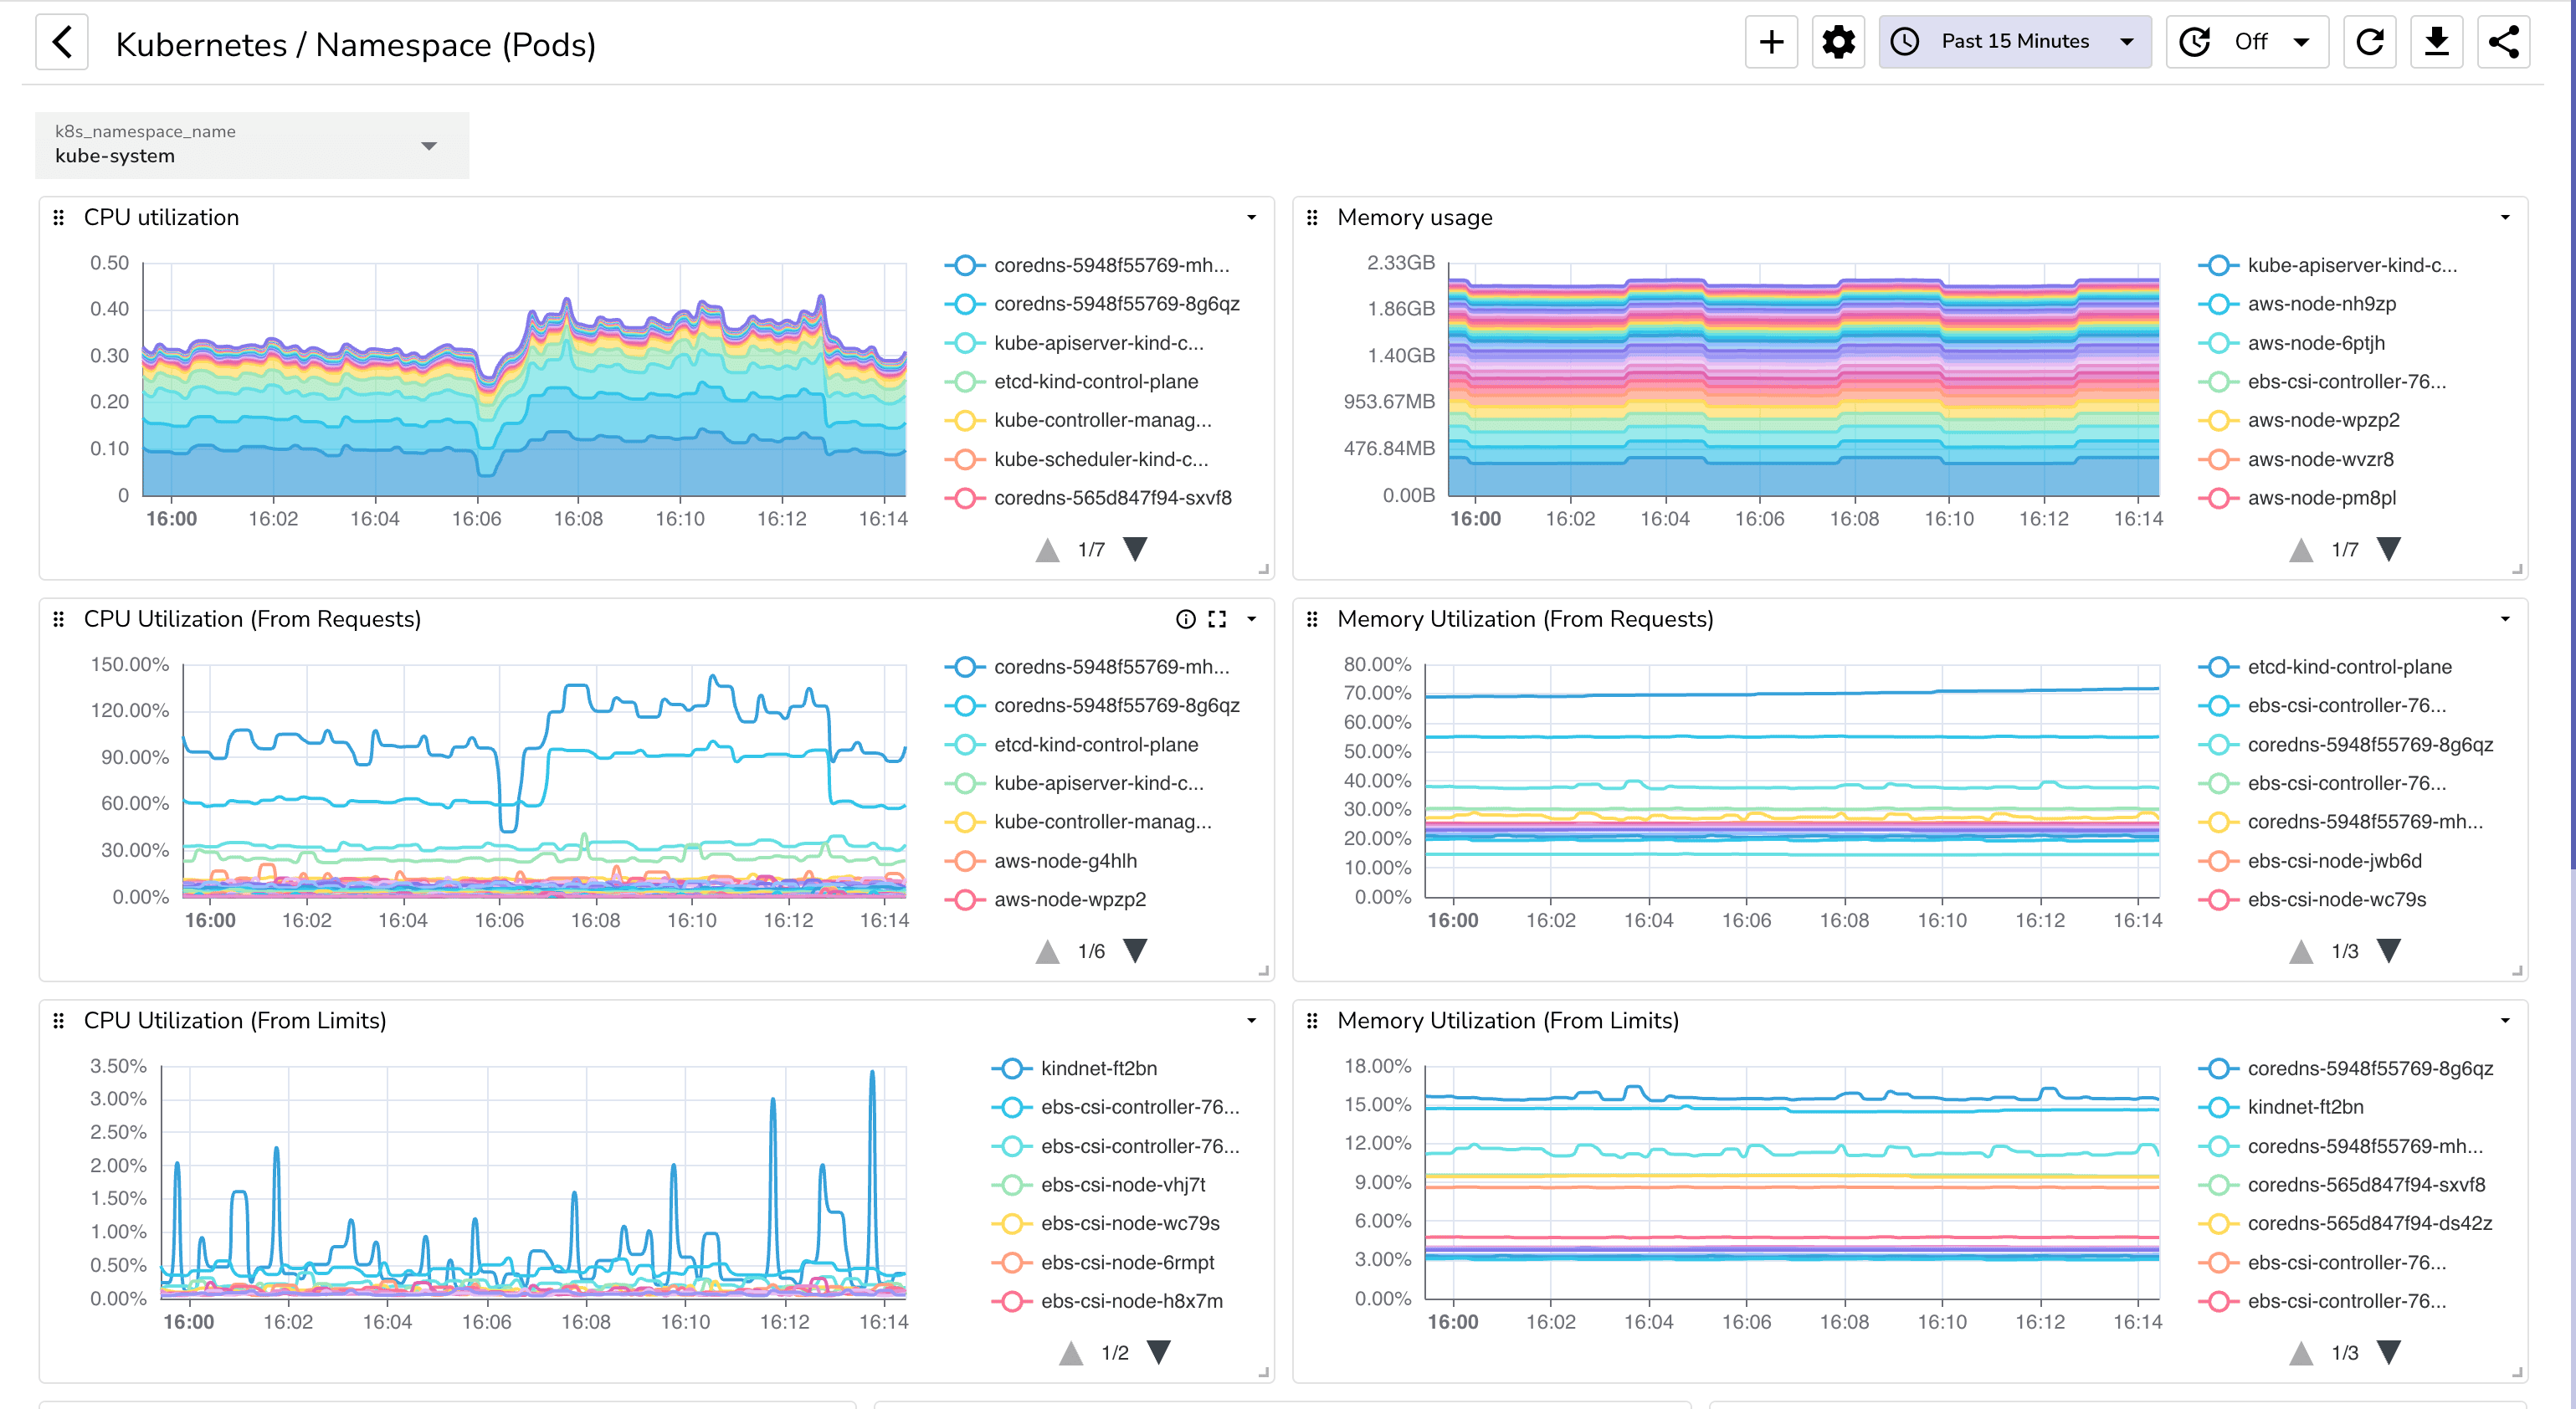
1. Kubernetes Namespace (Pods) Dashboard/Kubernetes%20%20_%20Namespace%20(Pods).dashboard.json)
Monitor the K8s resource consumption (CPU, memory) and status of pods within specific namespaces. Ideal for troubleshooting issues in particular workloads.
2. Kubernetes Namespaces Dashboard/Kubernetes%20%20_%20Namespaces.dashboard.json)
Provides a high-level overview of resource allocation and usage across all namespaces.Useful for understanding cluster-wide workload distribution and spotting anomalies.
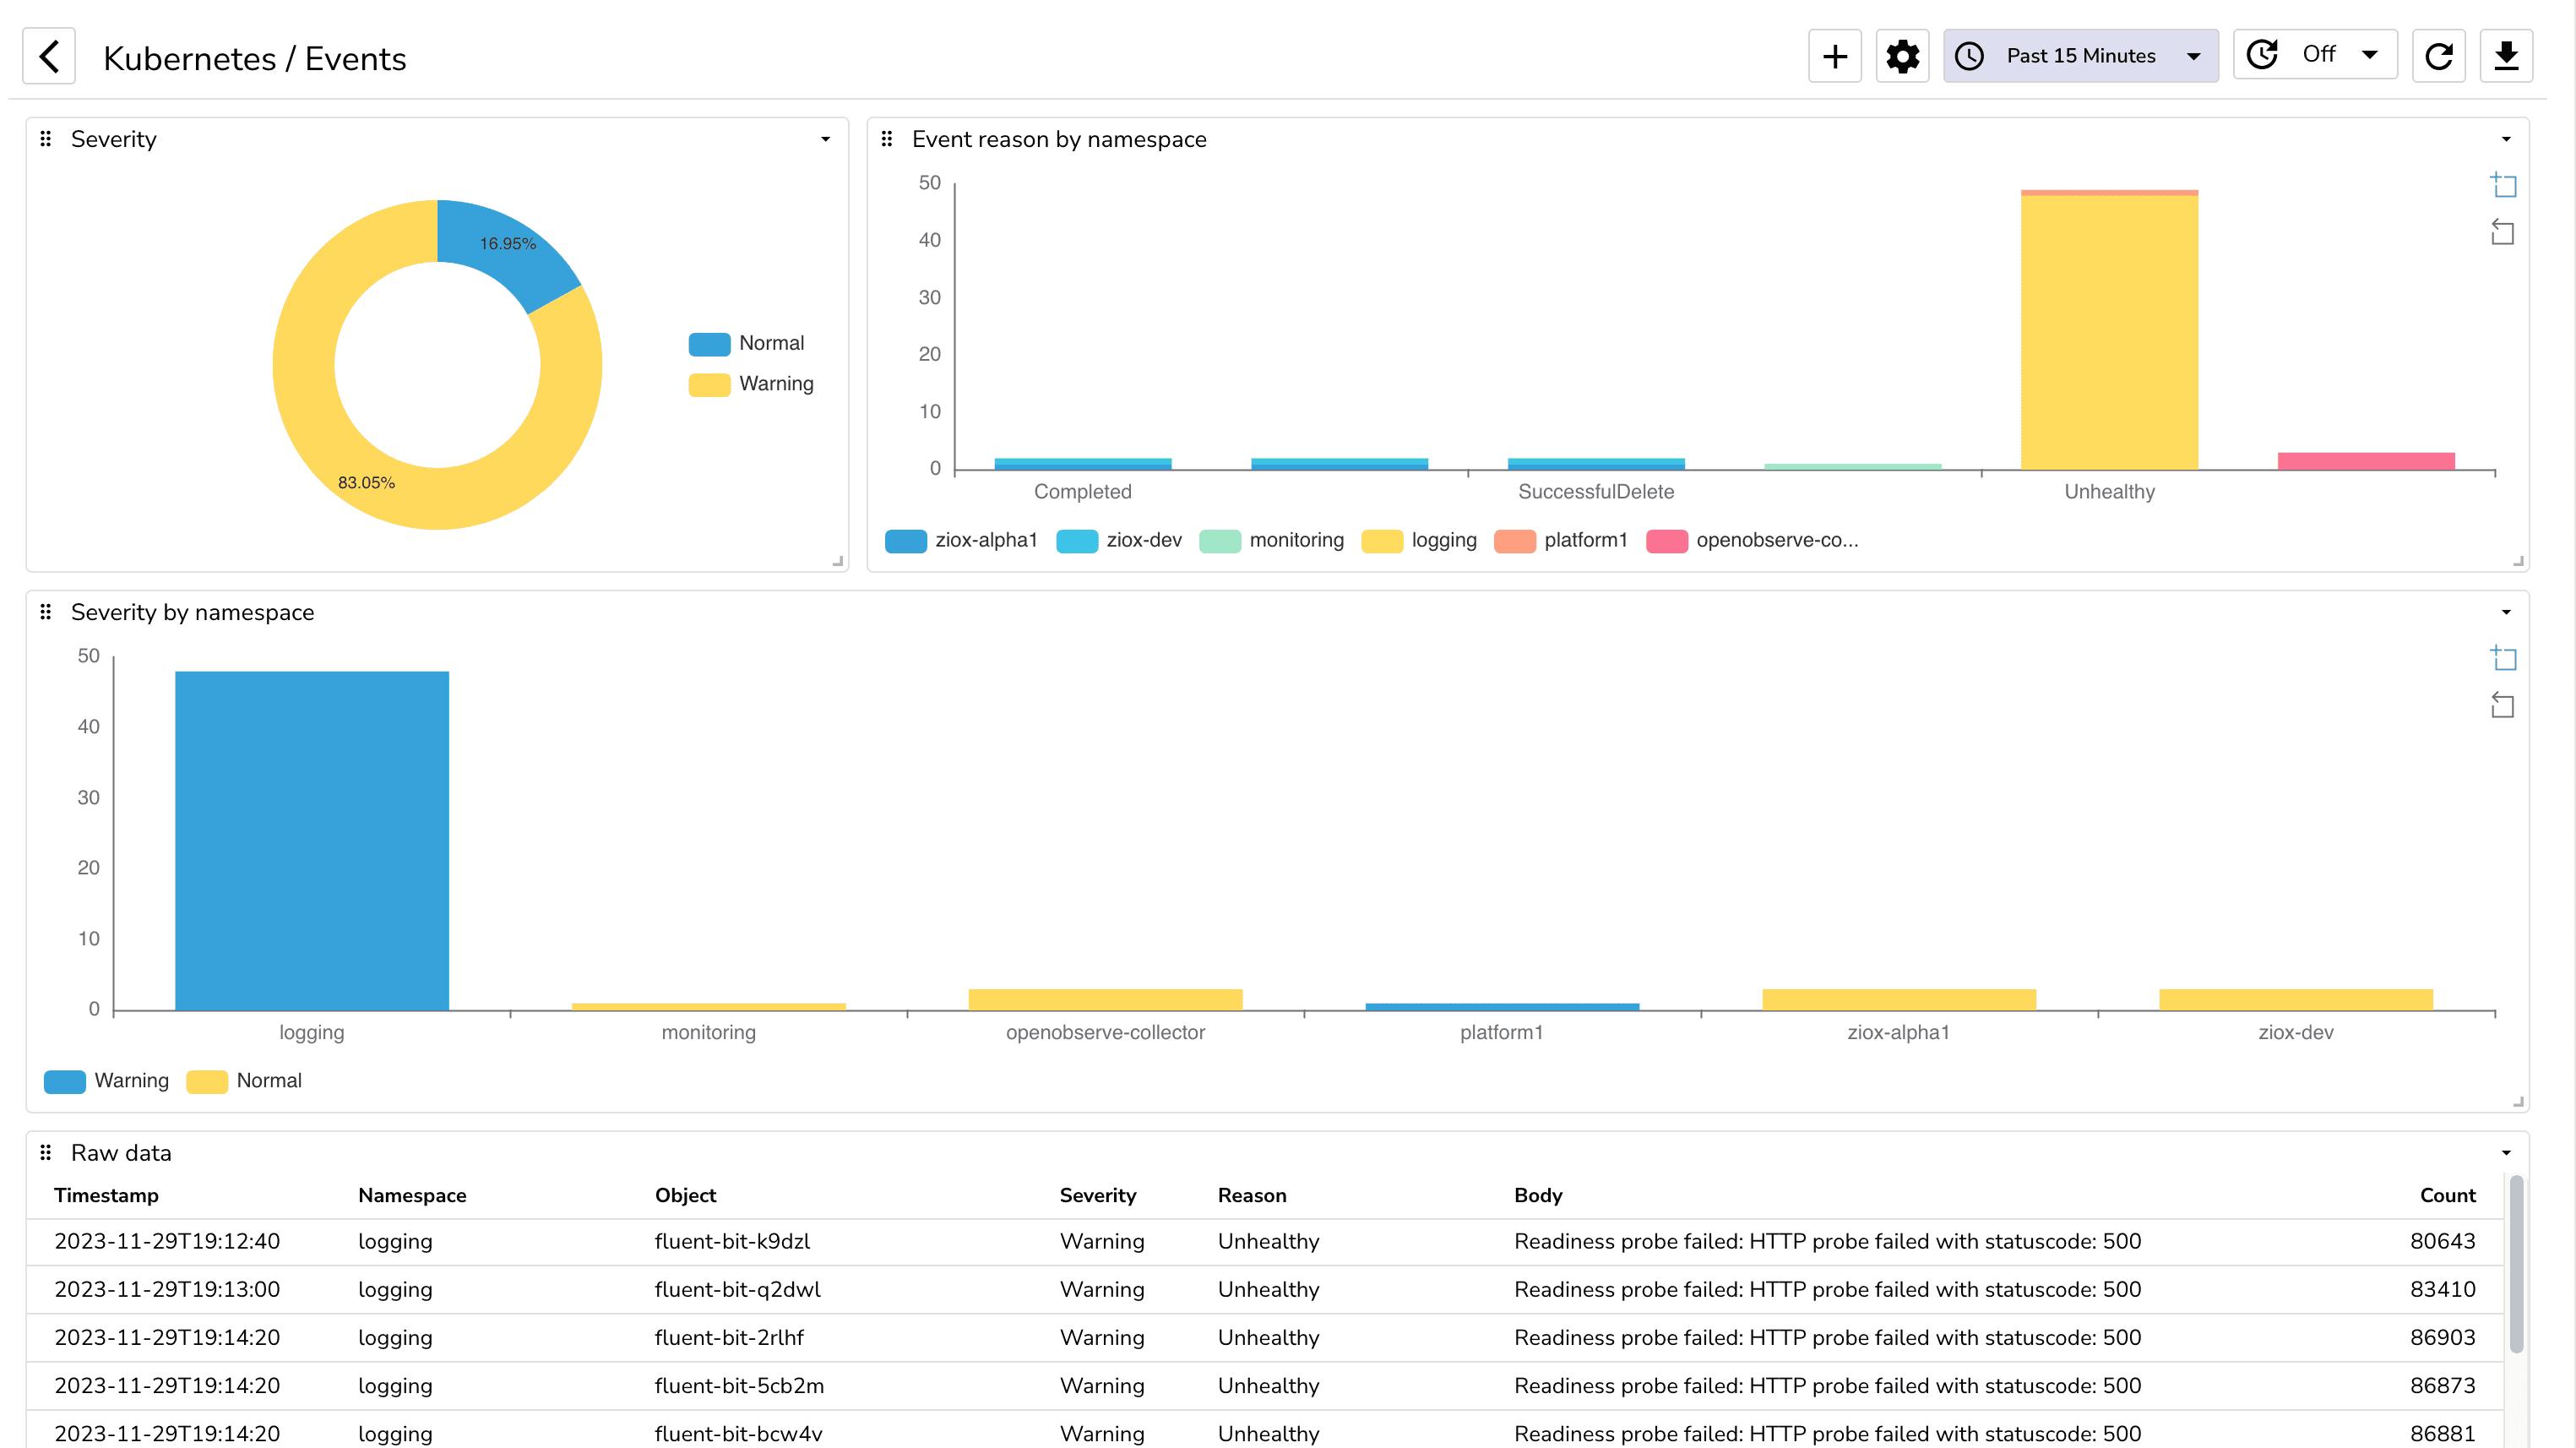
3. Kubernetes Events Dashboard/Kubernetes%20_%20Events.dashboard.json)
Displays events occurring within the K8s cluster, along with severity levels (Warning, Error, Info). Helps identify failures, configuration changes, or critical warnings quickly.
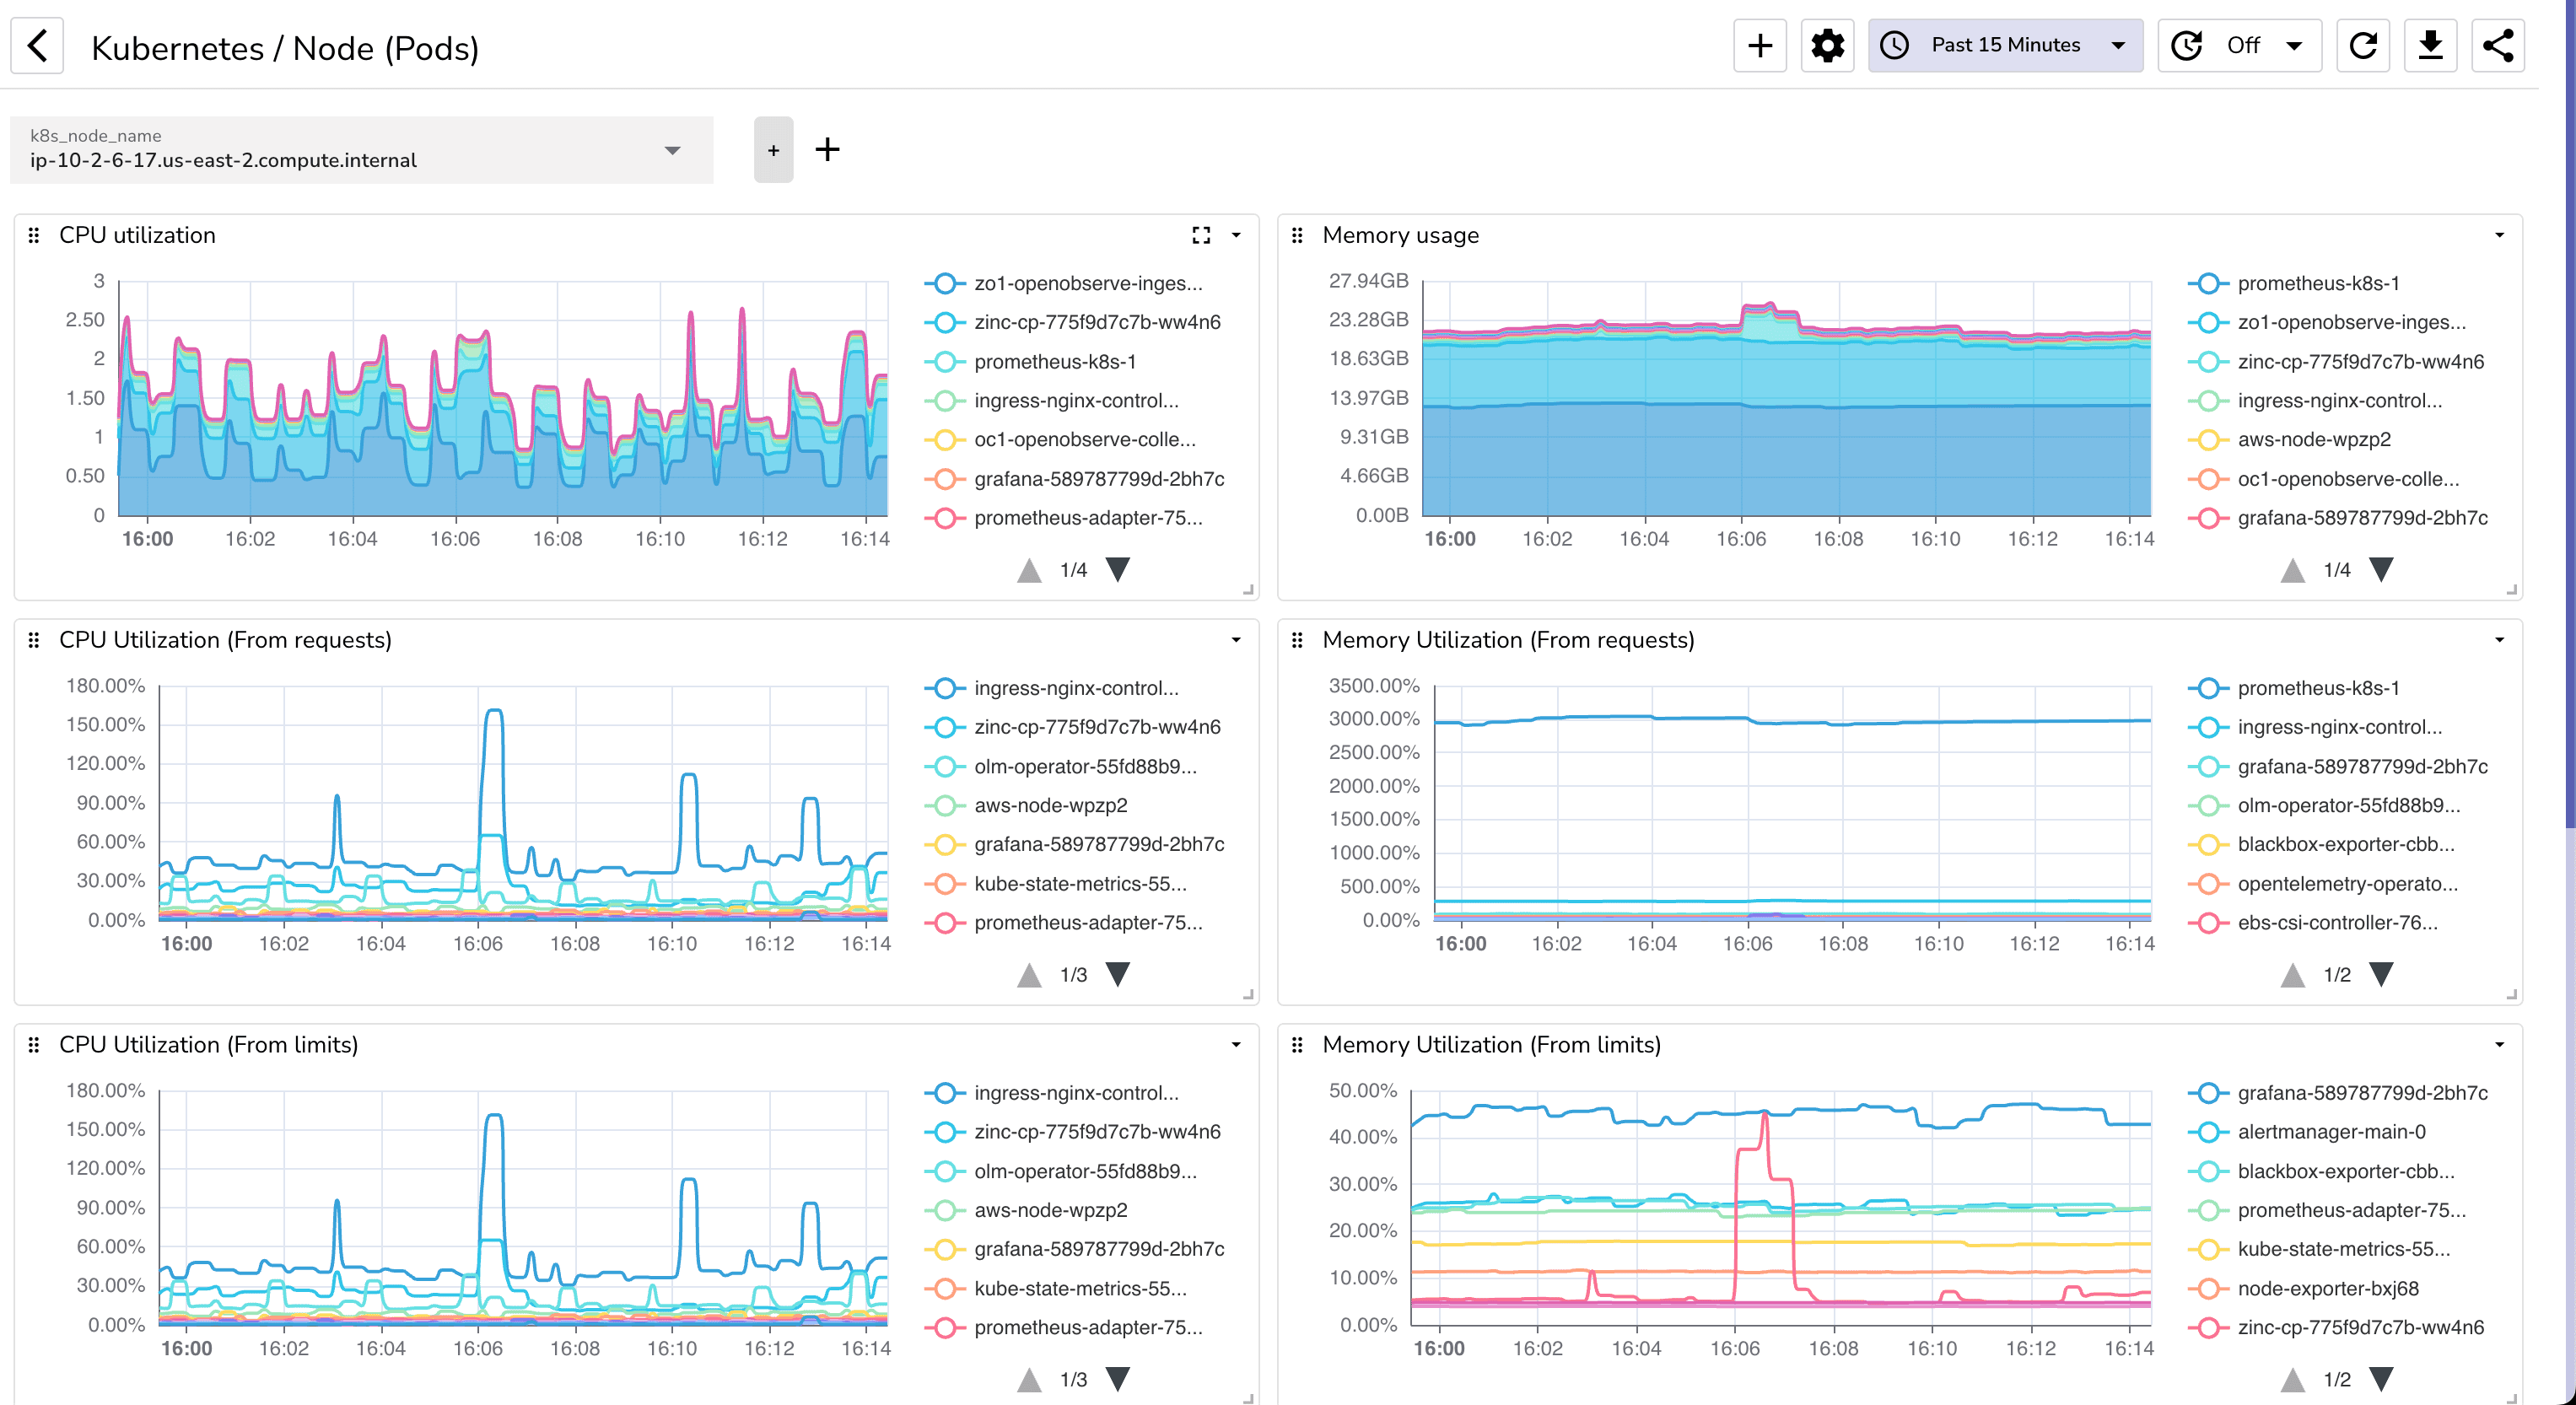
4. Kubernetes Node (Pods) Dashboard/Kubernetes%20_%20Node%20(Pods).dashboard.json)
Monitors pods running on each node, their performance, and resource usage.Useful for detecting node-level bottlenecks or underutilized resources.
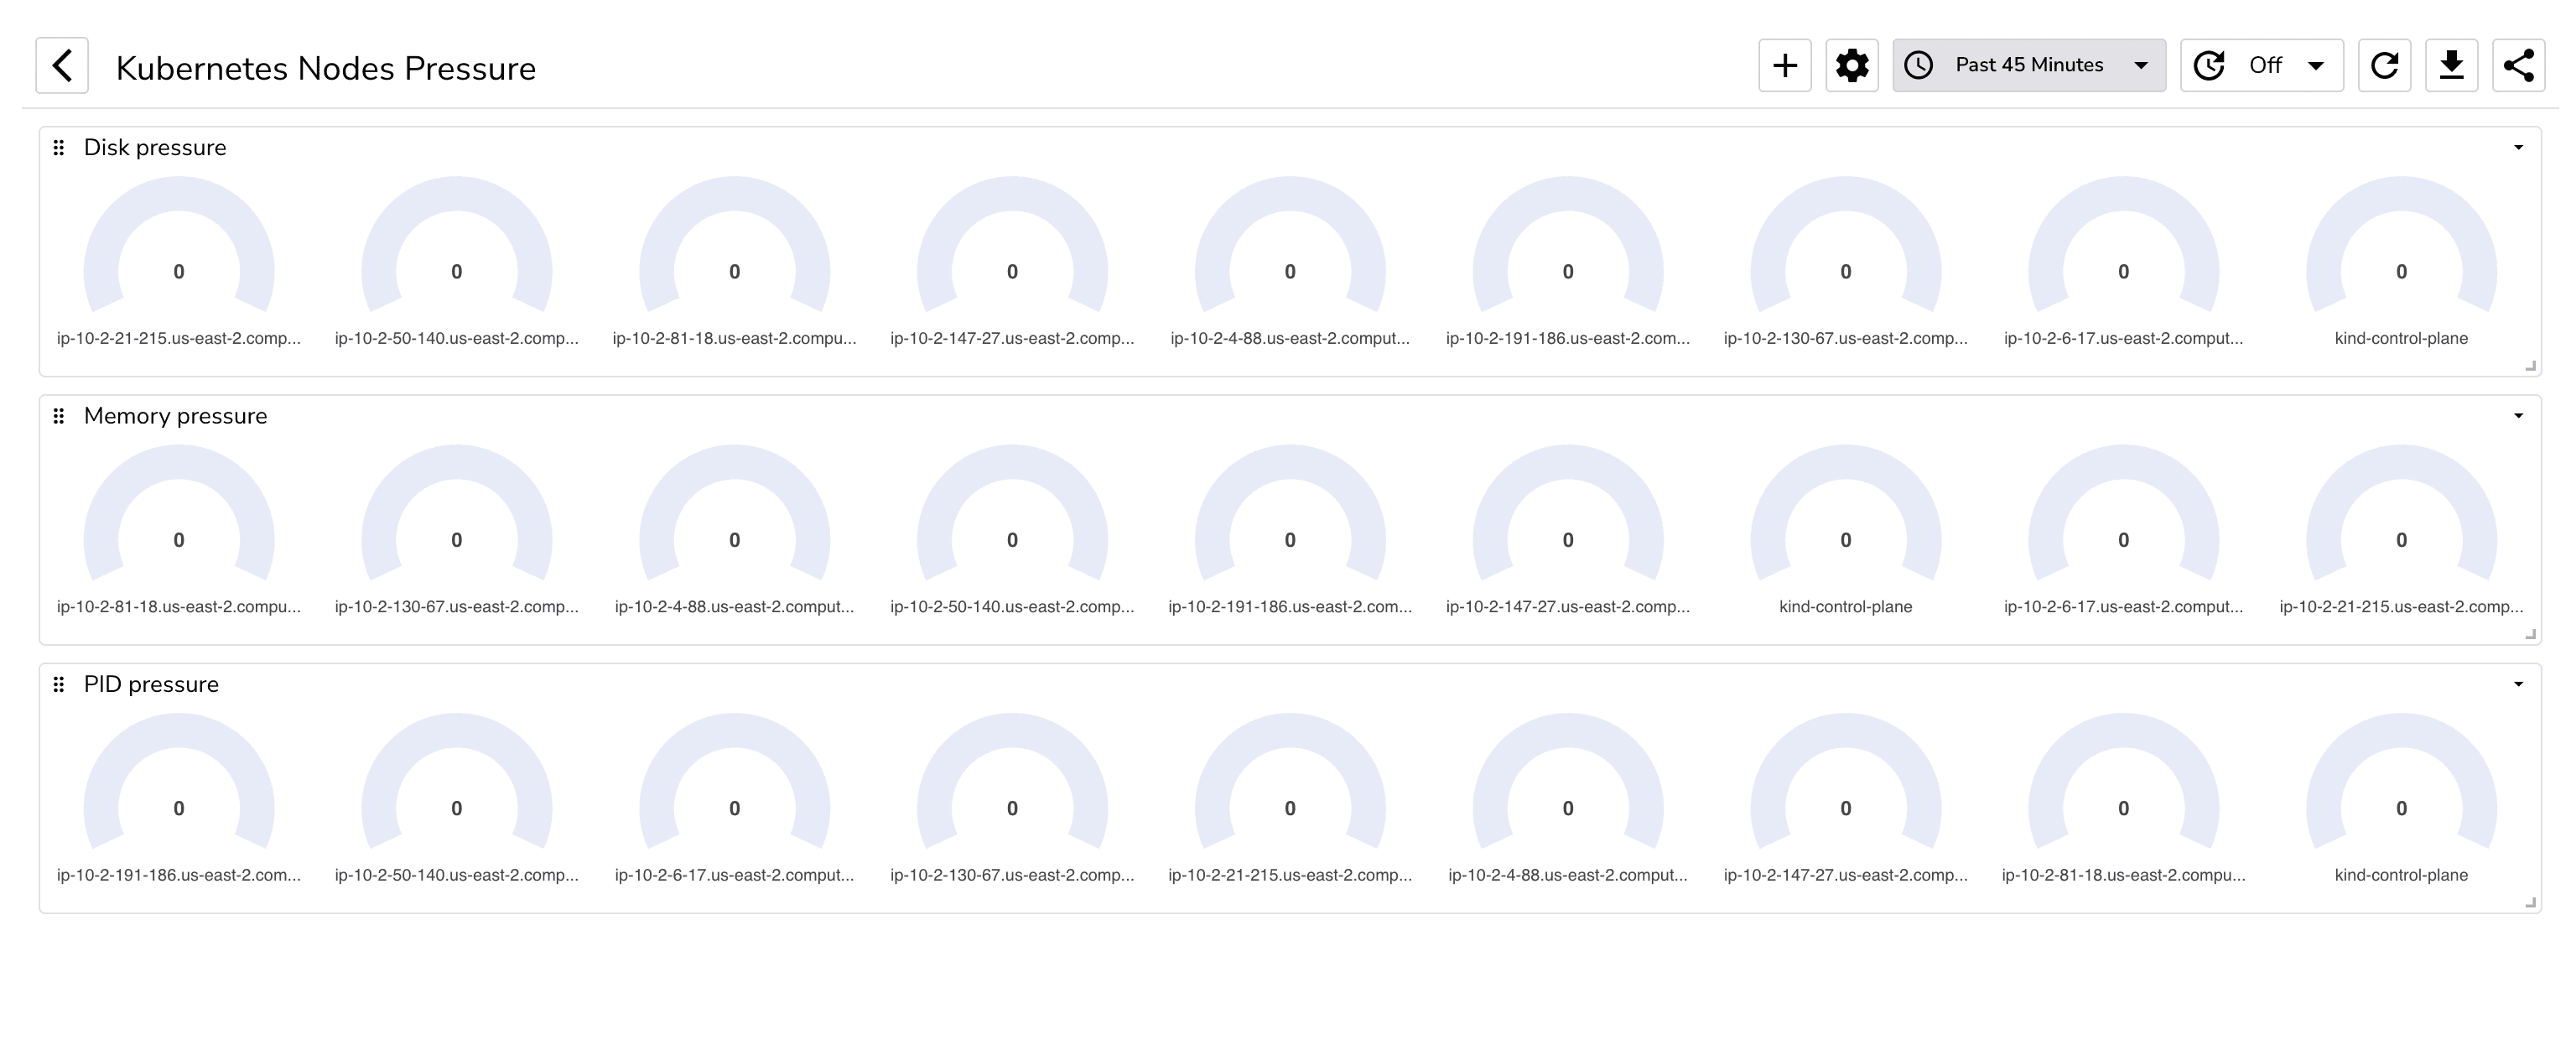
5. Kubernetes Nodes (Pressure) Dashboard/Kubernetes%20Nodes%20Pressure.dashboard.json)
This dashboard monitors resource pressure across cluster nodes, including:
- Disk pressure: Tracks disk usage and potential bottlenecks.
- Memory pressure: Shows memory usage trends to detect resource contention.
- PID pressure: Monitors process limits and system load per node.
 For a deeper dive into designing effective dashboards, check out OpenObserve’s guide on Observability Dashboards and Metrics Dashboards for SRE & DevOps Teams.
Bulk or Multi-File Import
OpenObserve allows you to import multiple dashboards at once. Instead of uploading files one by one, you can simply select multiple JSON files during the import process. This is handy when:
- You have dashboards for multiple services.
- You want to onboard several prebuilt dashboards quickly.
Contribute to Community Dashboards
OpenObserve dashboards are constantly evolving thanks to contributions from the community. If you are:
- Customizing prebuilt K8s dashboards for common use cases, or
- Building dashboards for specific K8s services or workloads
Consider sharing them with the community by raising a pull request to this repository!
Tip: Include a short description, metrics used, and any required data sources to help others easily import your dashboard.
Try OpenObserve Today
Start visualizing your K8s clusters in minutes with OpenObserve Cloud, free to get started, or explore the open-source version. Prebuilt K8s dashboards, multi-file imports, and community contributions can dramatically speed up your observability workflow.
Get started now: Sign up for a free OpenObserve Cloud trial or explore the open-source version.
About the Author
Simran Kumari

Passionate about observability, AI systems, and cloud-native tools. All in on DevOps and improving the developer experience.
Follow OpenObserve on Google
Add OpenObserve as a preferred source to see more of our articles in Google Search and Top Stories.












