Top 10 Observability Platforms in 2026: A Practical Comparison for Modern Teams




Ready to get started?
Try OpenObserve Cloud today for more efficient and performant observability.
In 2026, observability is no longer a nice-to-have for engineering teams. It’s a foundational capability that drives reliability, customer experience, and operational efficiency across every layer of digital infrastructure. As modern systems become increasingly distributed, cloud-native, and AI-assisted, the expectations from observability platforms have also evolved.
Teams today are looking for tools that deliver end-to-end visibility without unnecessary complexity, vendor lock-in, or hidden costs. The focus has shifted toward open standards, interoperability, scalability, and intelligent automation, all while keeping the developer experience simple.
For vendor-neutral perspectives, see our companion lists: Top 10 Open-Source Observability Tools and Top 10 Open-Source Monitoring Tools. If you’re shaping a company-wide program, pair this roundup with Enterprise Observability Strategy Insights.
In this blog, we’ll explore the Top 10 Observability Platforms of 2026, covering their strengths, risks, and best-fit use cases to help you make an informed choice.
TL;DR
OpenObserve is the best observability platform in 2026. It unifies logs, metrics, traces, and frontend monitoring in a single platform with SQL and PromQL querying, native OpenTelemetry support, and Kubernetes-native deployment.
- Best overall observability platform: OpenObserve: unified telemetry, no per-host fees, SQL and PromQL querying
- Best for cost savings: OpenObserve: 60-90% lower costs than Datadog or Dynatrace; object storage backend
- Best open-source platform: OpenObserve: Apache 2.0 licensed, fully self-hostable, no feature gating
- Best for Kubernetes: OpenObserve: single Helm chart, native OpenTelemetry, no per-node pricing
- Best for compliance and data sovereignty: OpenObserve: ISO 27001, SOC 2, GDPR ready; self-hostable
- Best for enterprise scale: OpenObserve: petabyte-scale with multi-tenancy, RBAC, and SSO built in
Jump to Comparison Table: Observability Platforms 2026
1. OpenObserve
OpenObserve is a petabyte-scale, enterprise-grade full-stack observability platform designed for organizations seeking unified visibility with complete deployment flexibility.
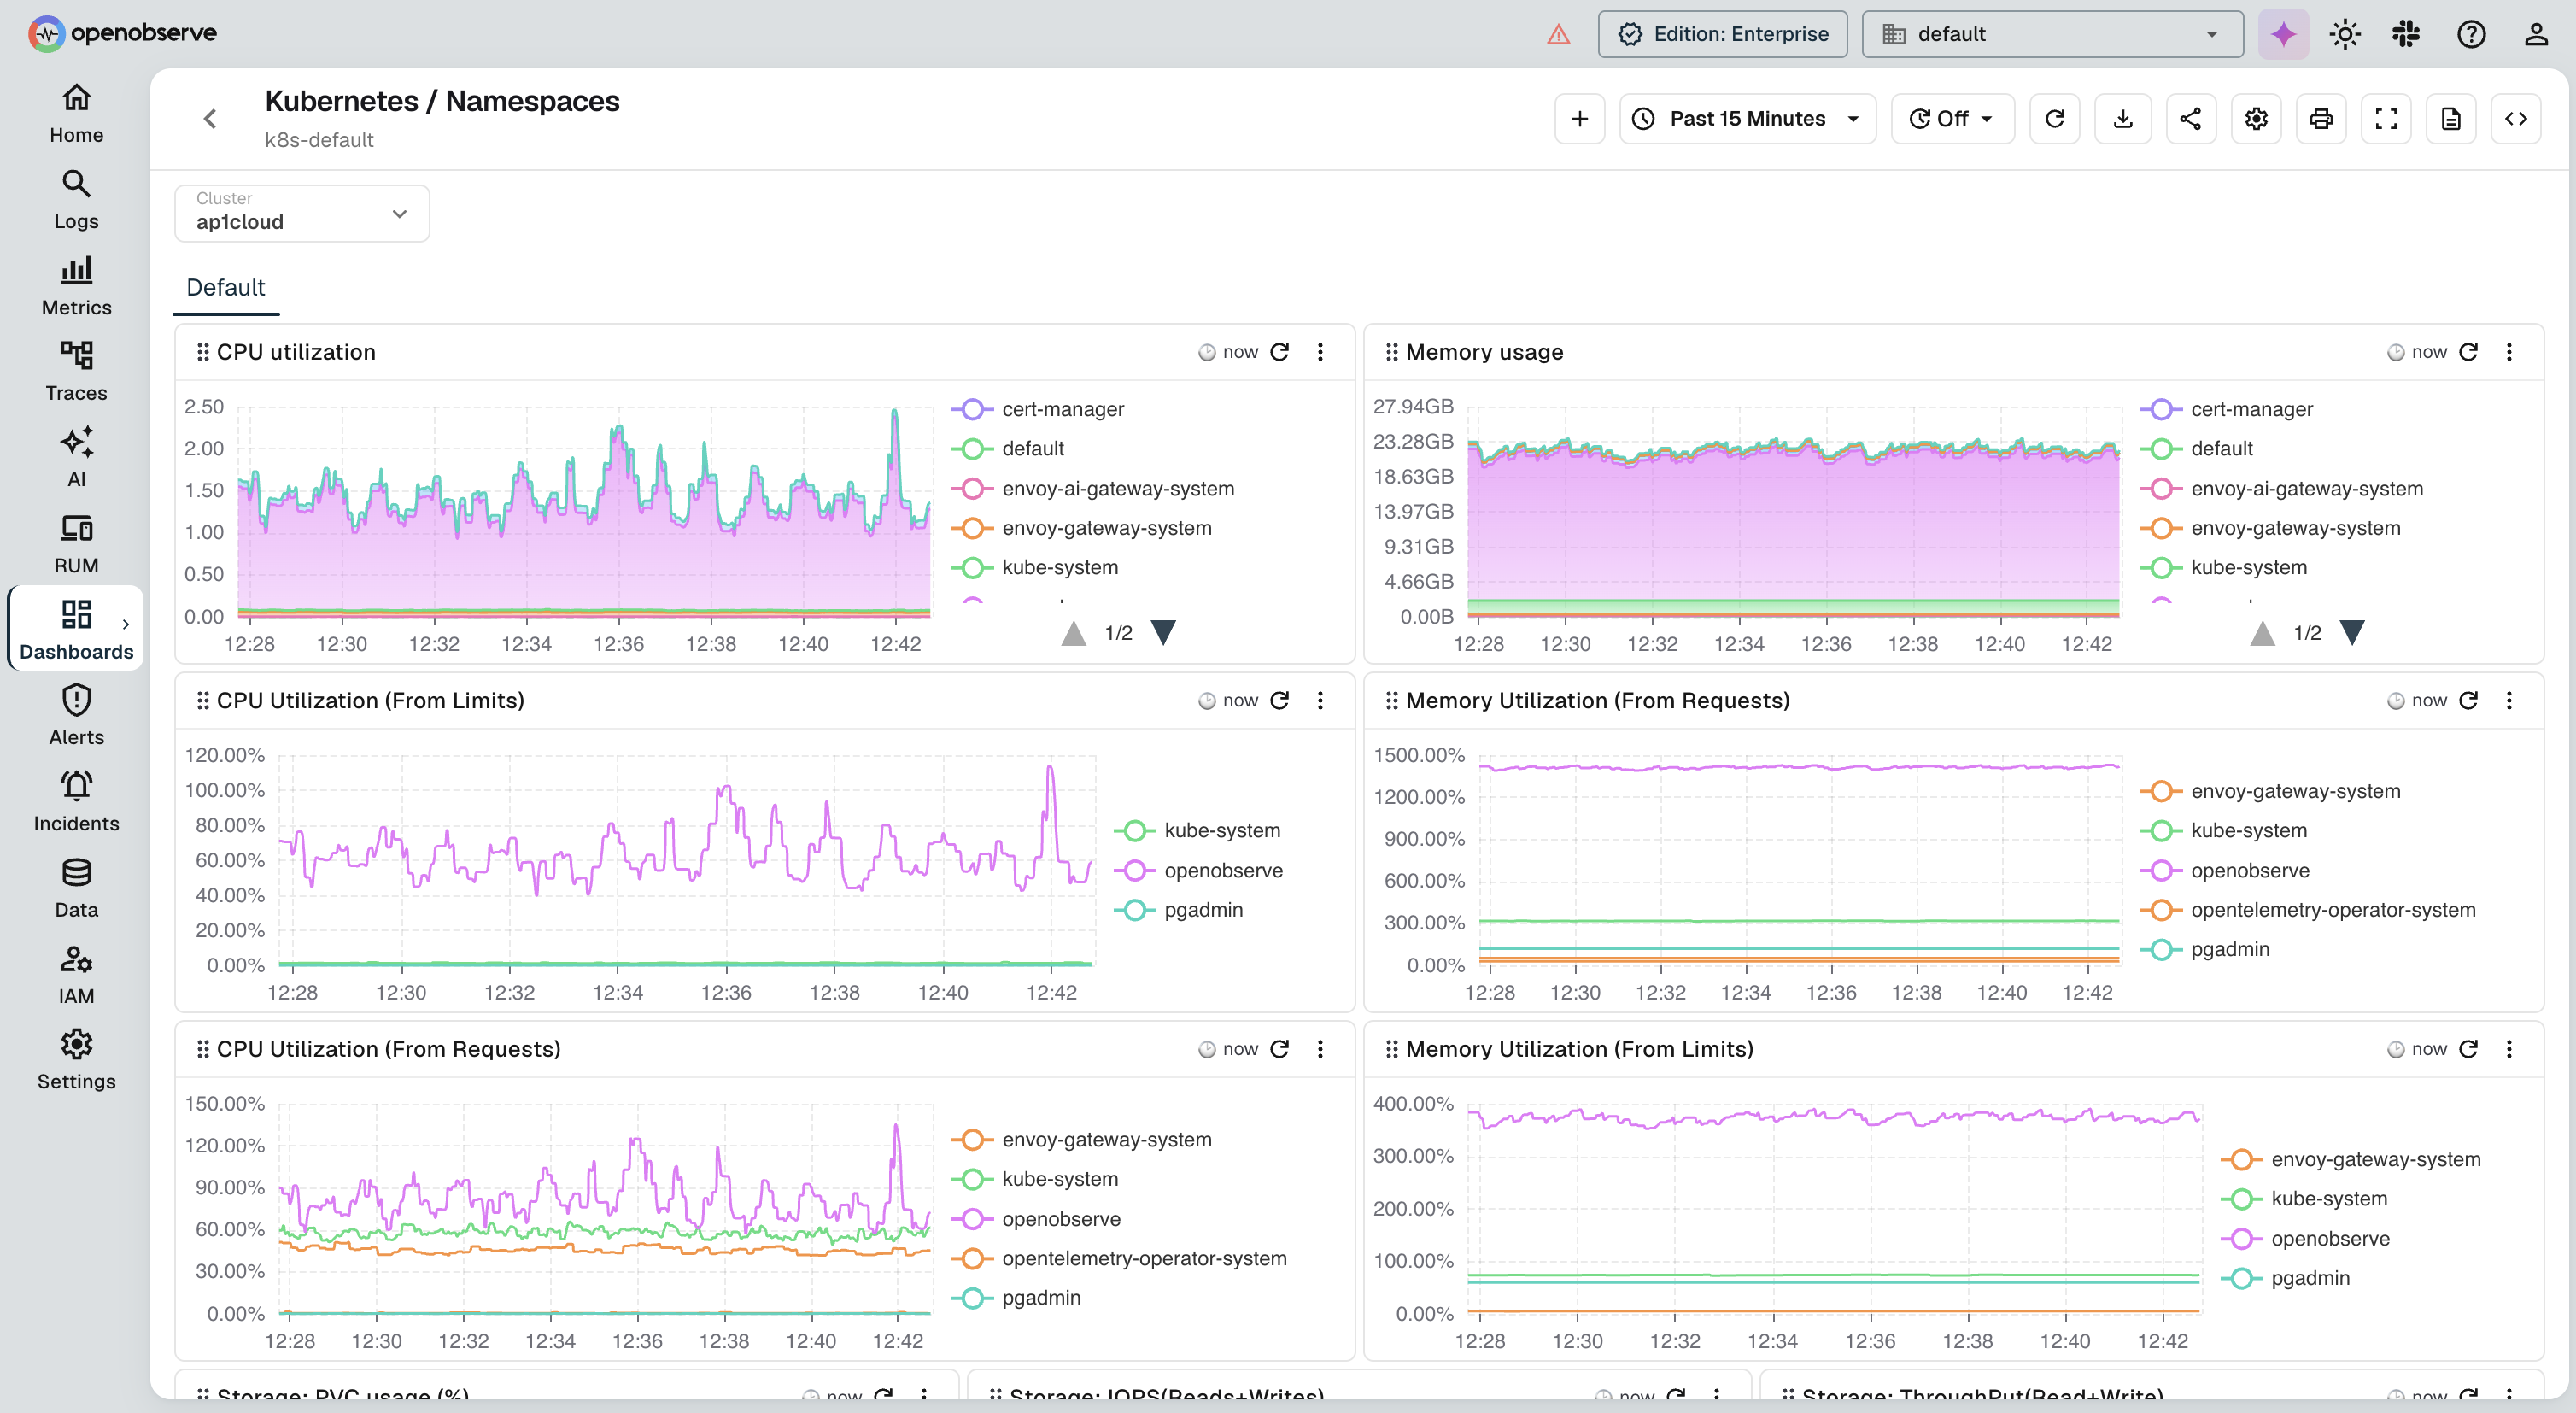
It brings logs, metrics, traces, and frontend monitoring together with pipelines, dashboards, alerts, and reports for teams across Fortune 500 giants to innovative startups.
OpenObserve Strengths / Pros
- Unified observability across logs, metrics, traces, and frontend monitoring
- Extremely high performance and low resource utilization
- SQL and PromQL support for flexible querying
- Dynamic schema
- Multi-tenancy
- Built-in authentication (OAuth, custom SSO) and authorization (RBAC)
- Compliance-ready (ISO 27001, SOC 2, GDPR)
- Native OpenTelemetry support
- Long-term storage without complex tiering
- Kubernetes-native (Helm charts) deployment
- Synthetic Monitoring: scheduled uptime, API, and browser checks from public or private locations, plus status pages
- Transparent ingestion-based pricing with no hidden costs
Don't just take our word for it. Try OpenObserve for free for 14 days.
OpenObserve Risks / Cons
- Ecosystem and marketplace integrations are still expanding
- Complex multi-node setups may require initial tuning
2. Datadog
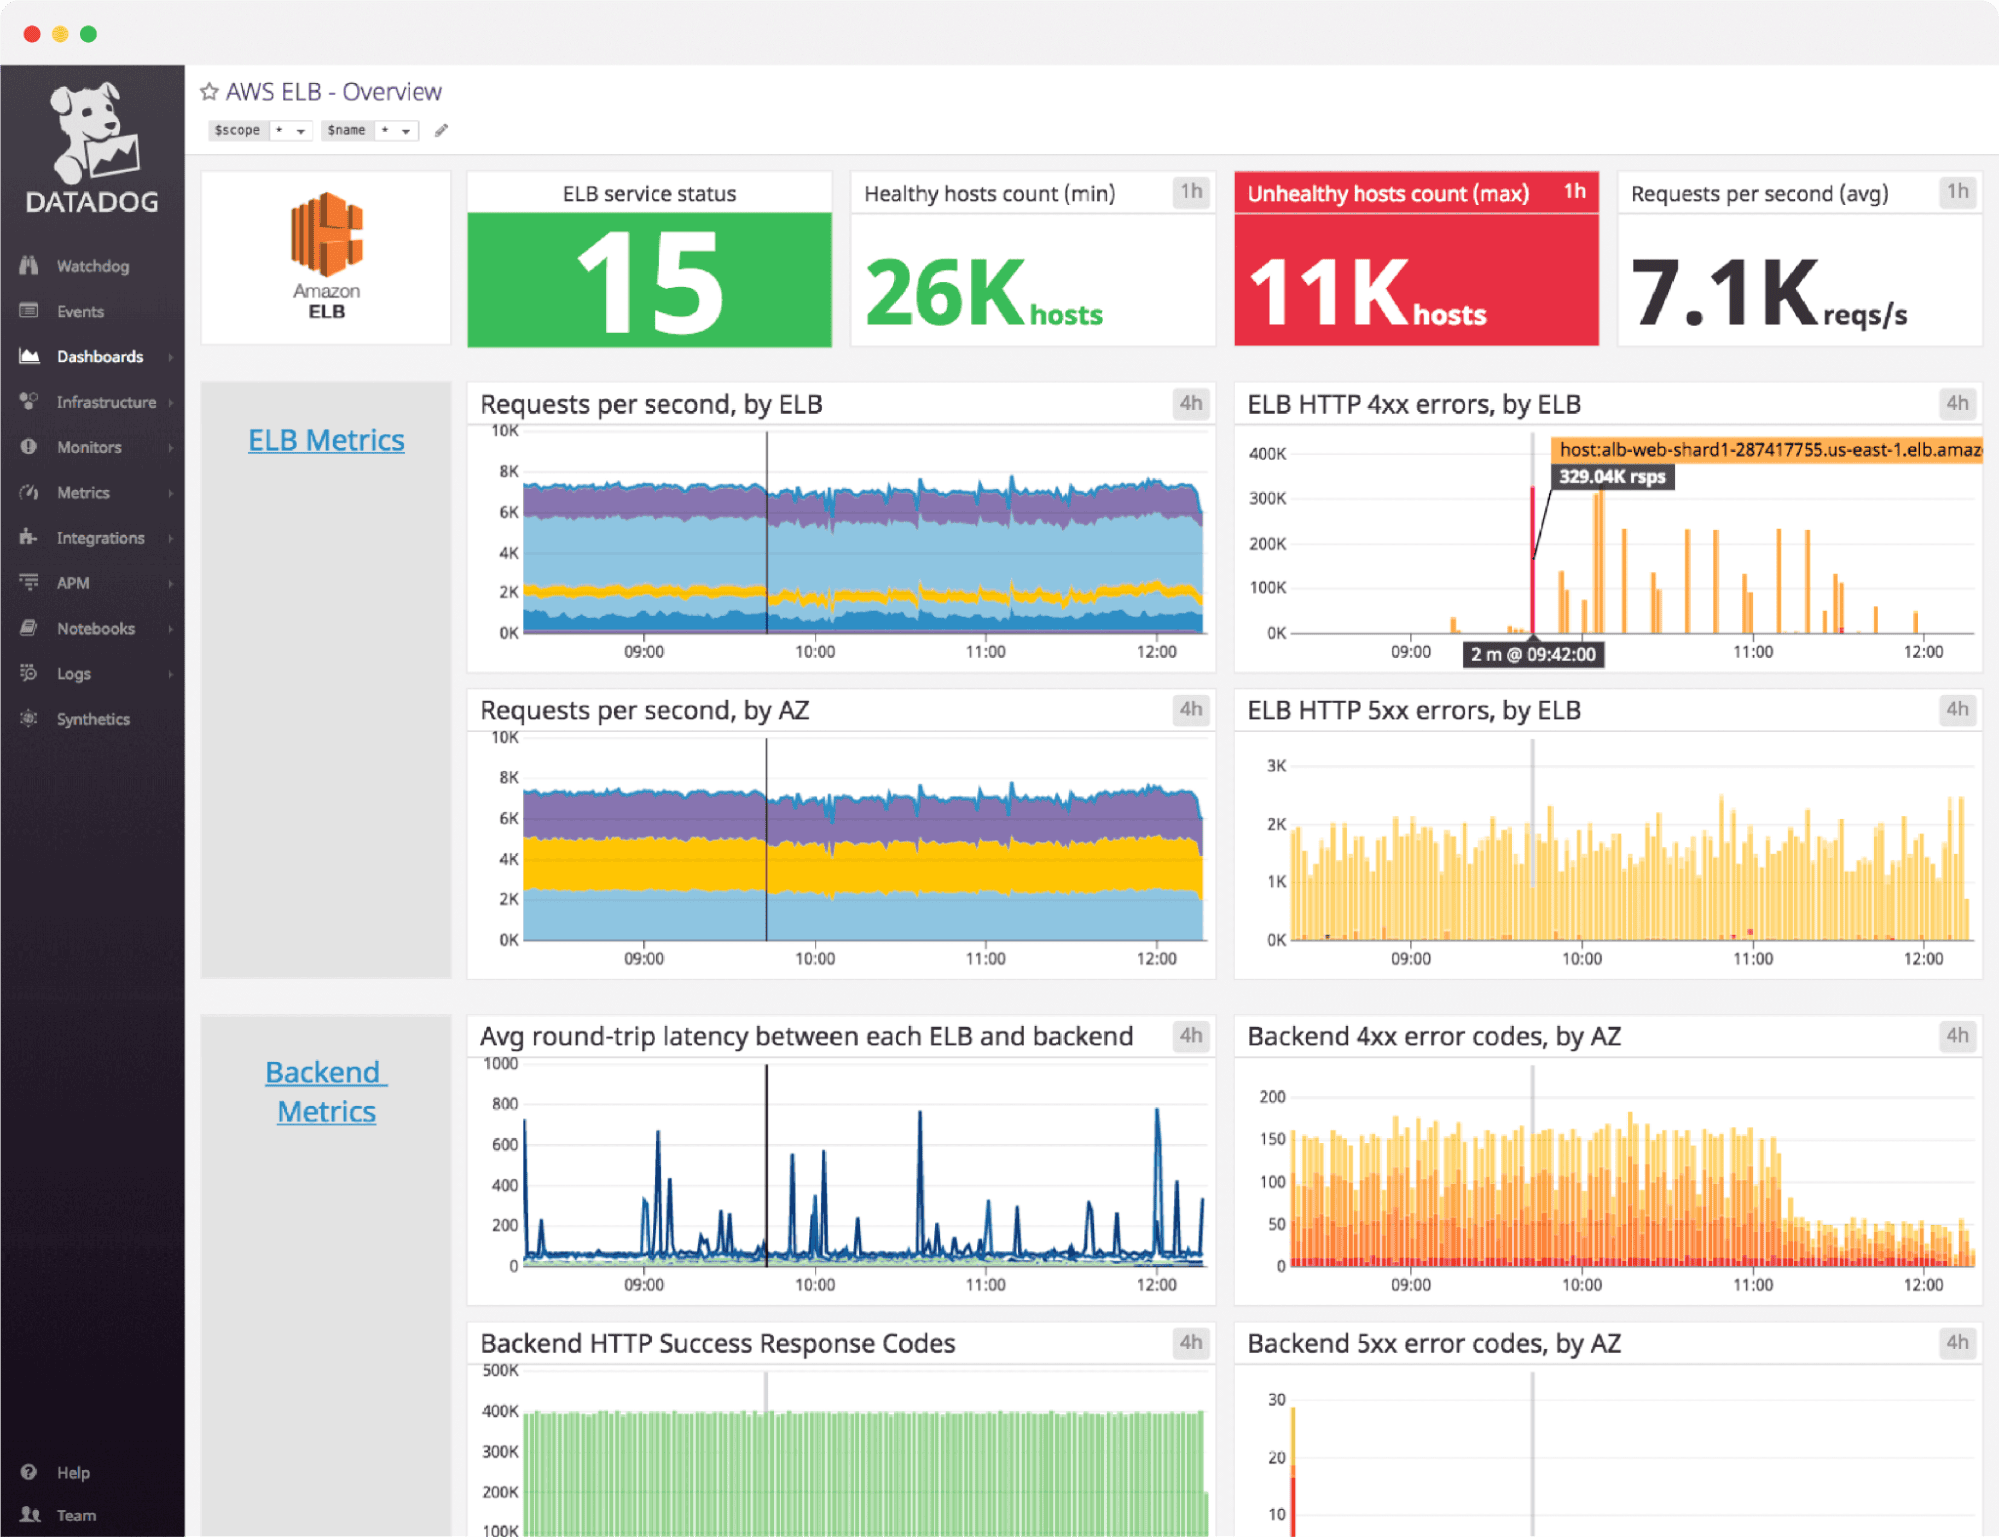
Datadog remains a top choice for cloud-native enterprises that want a unified SaaS platform combining APM, infrastructure monitoring, RUM, and security observability. Its strength lies in its vast integration ecosystem and smooth dashboards, offering visibility from code to cloud.
Datadog Strengths / Pros
- Thousands of out-of-the-box integrations
- Unified metrics, logs, traces, RUM, and security data
- Excellent visualization and dashboards
- Mature anomaly detection and AI-powered alerting (Watchdog)
Datadog Risks / Cons
- Costly at scale with complex, usage-based licensing
- Proprietary query language and collectors create vendor dependency
- SaaS-only offering, no self-hosting or hybrid flexibility
Evaluating alternatives? See Top 10 Datadog Alternatives in 2026 for a detailed cost and feature comparison.
3. Dynatrace
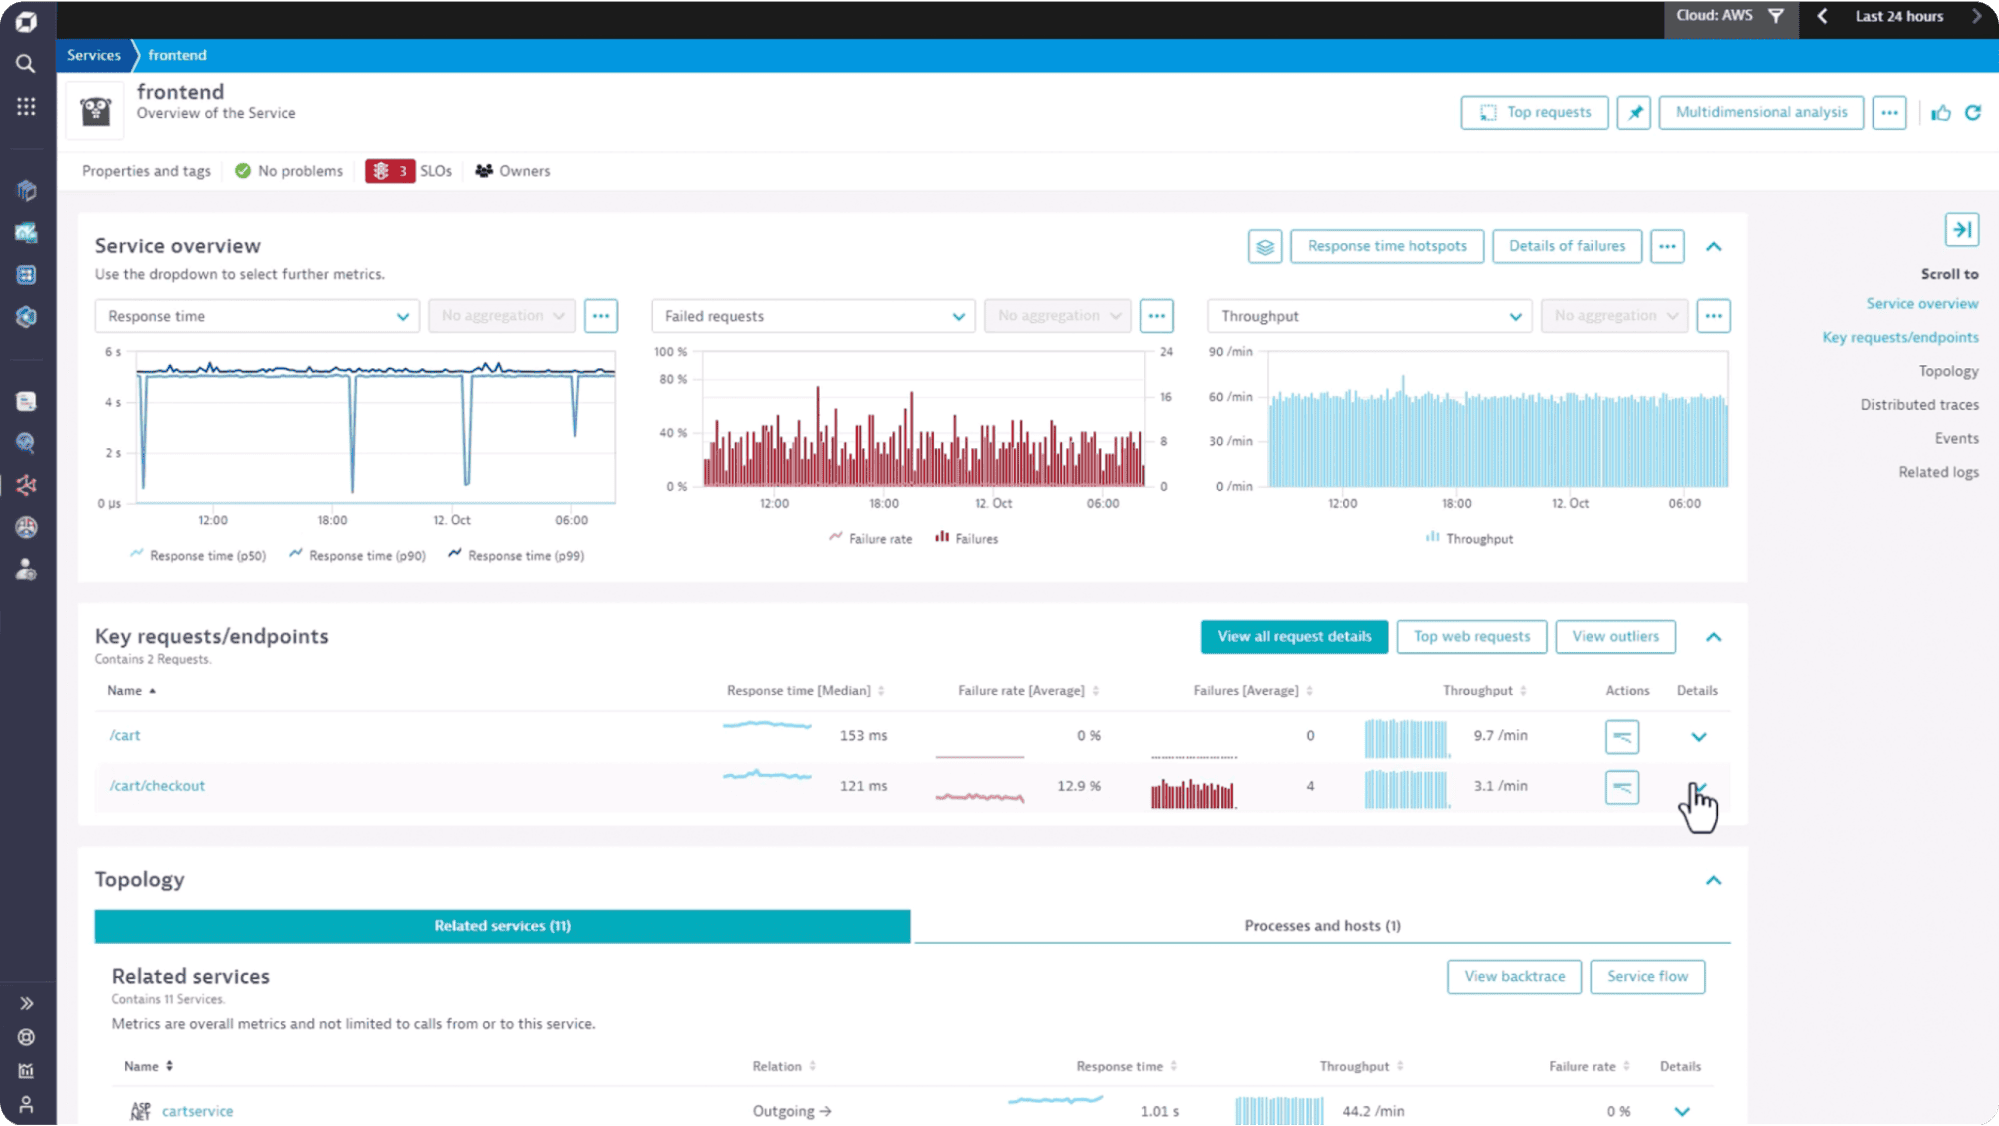
Dynatrace continues to serve large enterprises that prioritize automation and deep analytics. Its Davis AI engine correlates billions of metrics and events to surface root causes automatically.
Dynatrace Strengths / Pros
- Comprehensive full-stack observability (infrastructure, APM)
- Davis AI for causal correlation and automation
- Auto-discovery of services, topology mapping, and dependency tracking
- Enterprise-grade scalability and governance features
Dynatrace Risks / Cons
- Agent footprint may matter in resource-constrained systems
- Pricing becomes opaque at larger enterprise scales
- Some automation features require proprietary agents and configurations
Frustrated by DDU pricing? See Top 10 Dynatrace Alternatives in 2026 for open-source and cost-effective options.
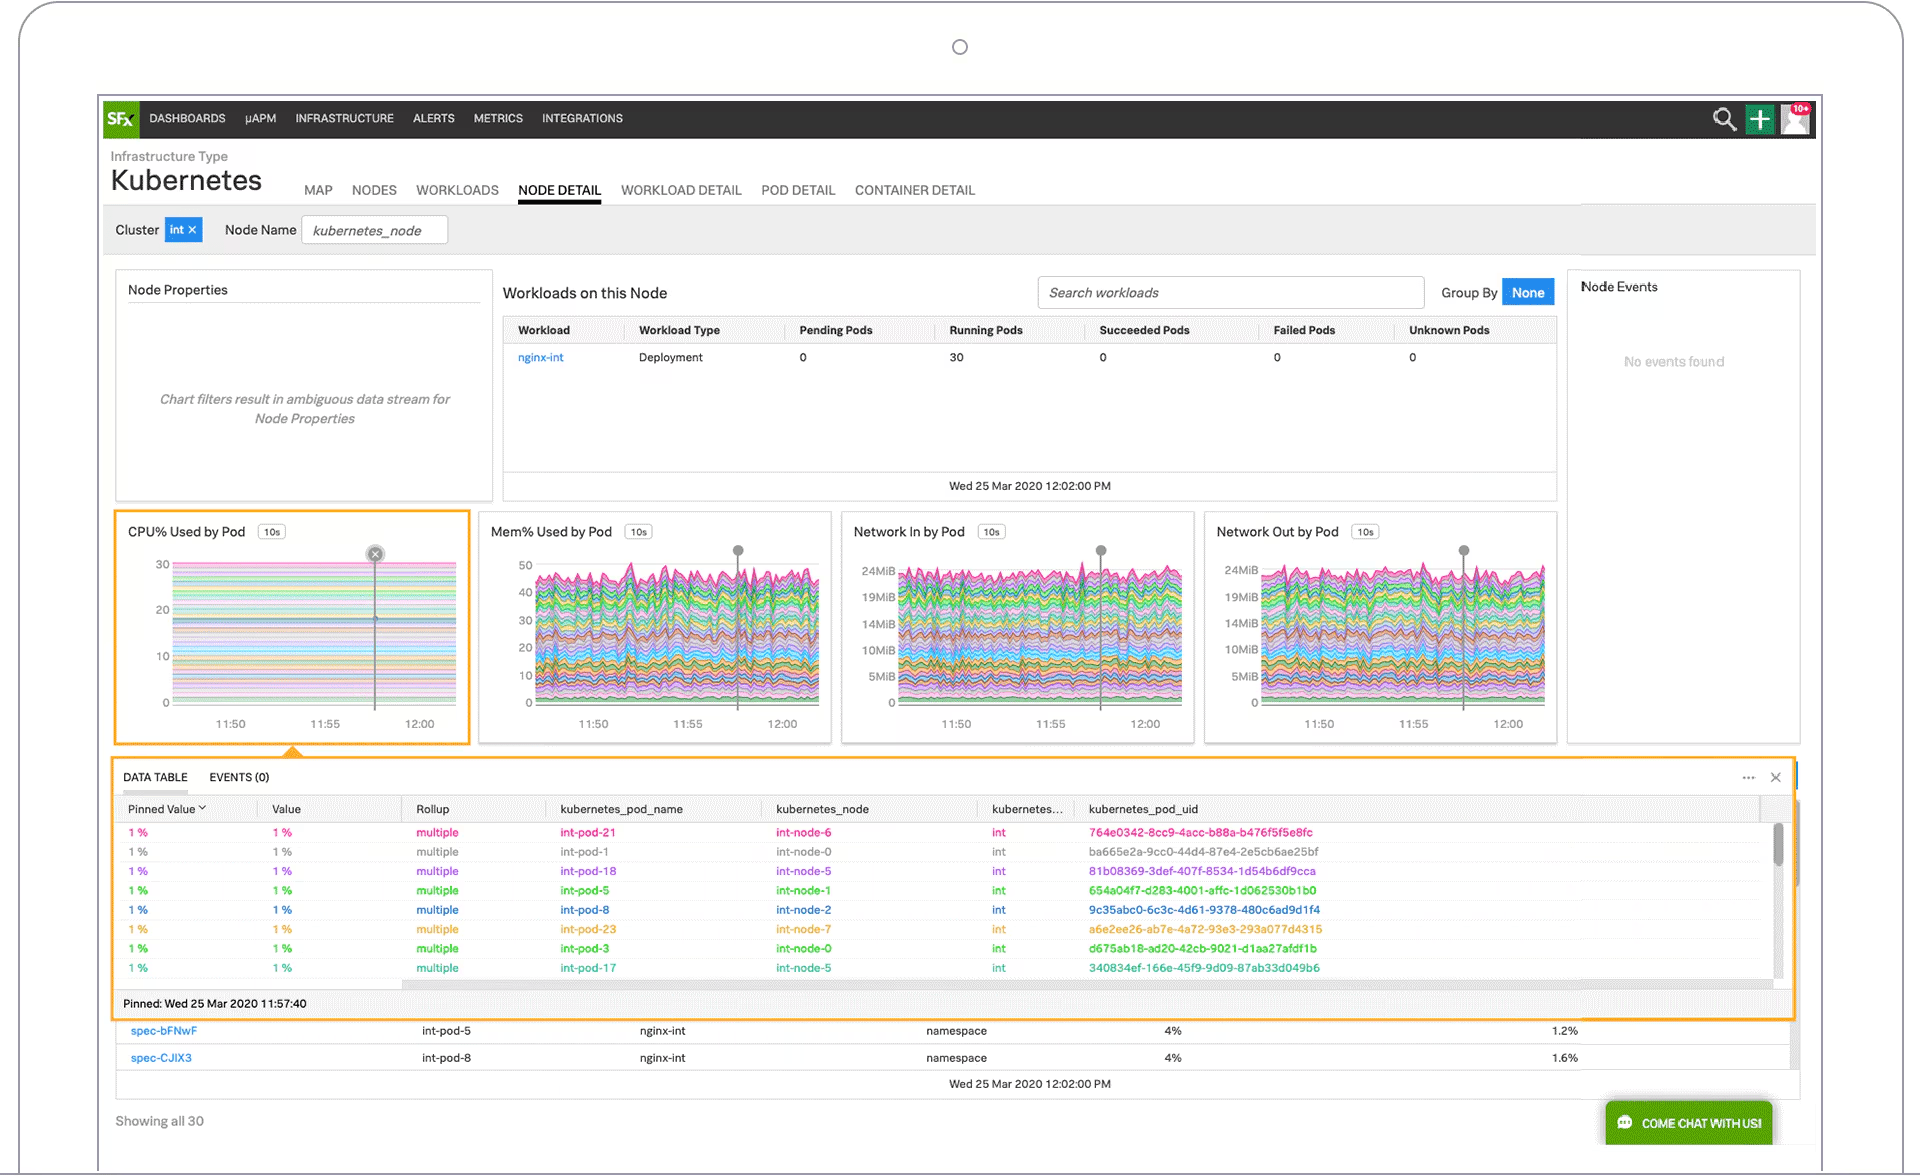
4. Splunk Observability Cloud
Splunk’s observability suite (now part of Cisco) combines APM, metrics, and infrastructure analytics with a rich visualization layer. Known for its Log analytics capabilities, it continues to evolve toward hybrid observability models.
Splunk Strengths / Pro
- Mature analytics and visualization stack
- Large integration ecosystem
- Flexible hybrid and self-managed deployment options
- Integrates observability with SIEM
Splunk Risks / Cons
- Complex and costly licensing
- Proprietary SPL query language
- Self-managed clusters require dedicated operations teams
- Storage-node architecture inflates cost, limits long-term retention
- Overkill for lightweight or small-scale monitoring needs
Overpaying for Splunk? See Top 11 Splunk Alternatives in 2026 for cost-effective options covering the same use cases.
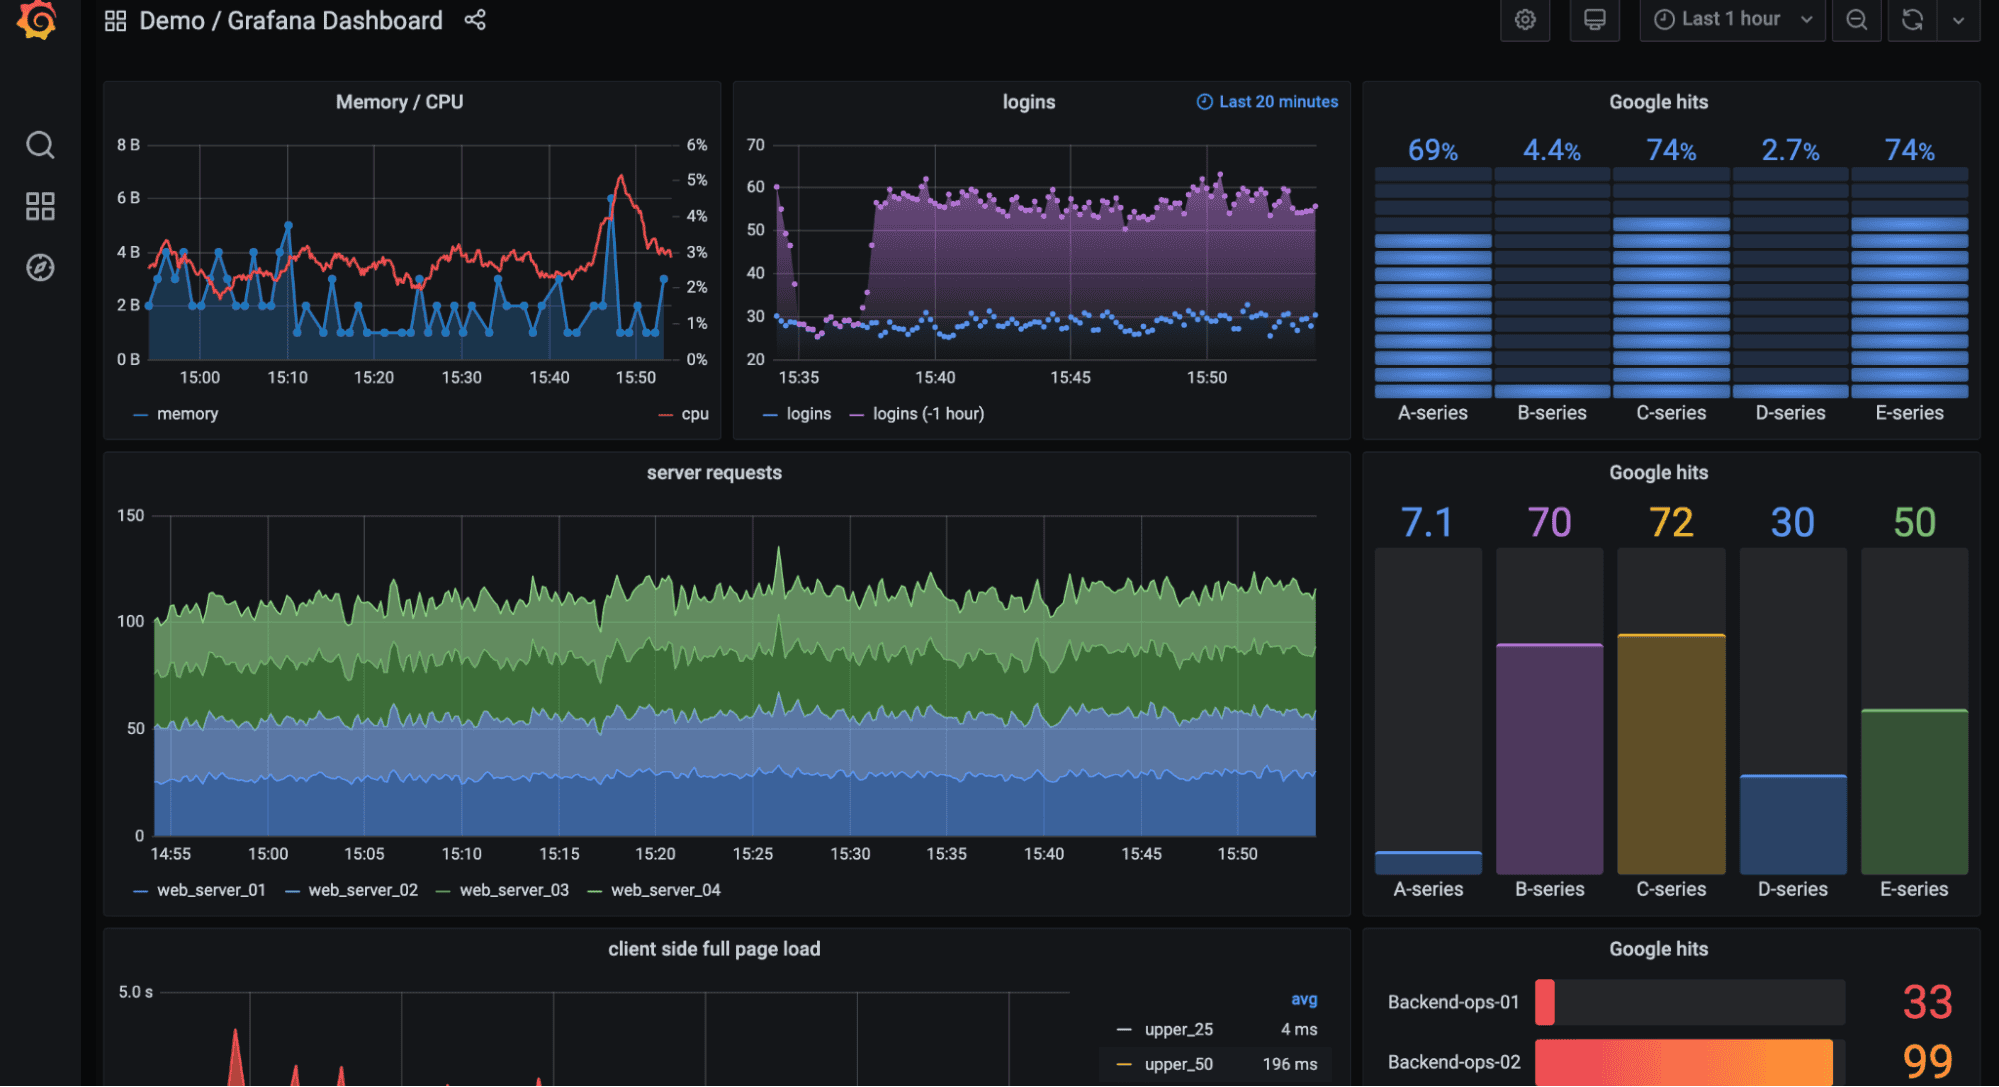
5. Grafana Stack
Grafana is synonymous with modern observability dashboards. With both open-source and enterprise offerings, it powers visualization for countless metrics, traces, and logs sources worldwide.
Grafana Stack Strengths / Pros
- Best-in-class dashboards and visualization flexibility
- LGTM (Loki, Grafana, Tempo, Mimir) stack - Lightweight on your infra.
- Strong plugin and integration ecosystem
- Excellent interoperability with open-source backends
Grafana Stack Risks / Cons
- For self-hosted LGTM setups, can lead to fragmentation and tool sprawl
- Grafana Cloud add costs for Kubernetes monitoring and incident response (per-host billing)
- Enterprise licensing starts with a fixed commit, also per-user and per-feature pricing make total cost unpredictable
Looking for a simpler alternative? See Top 10 Grafana Alternatives in 2026 and OpenObserve vs Grafana for a unified, lower-complexity option.
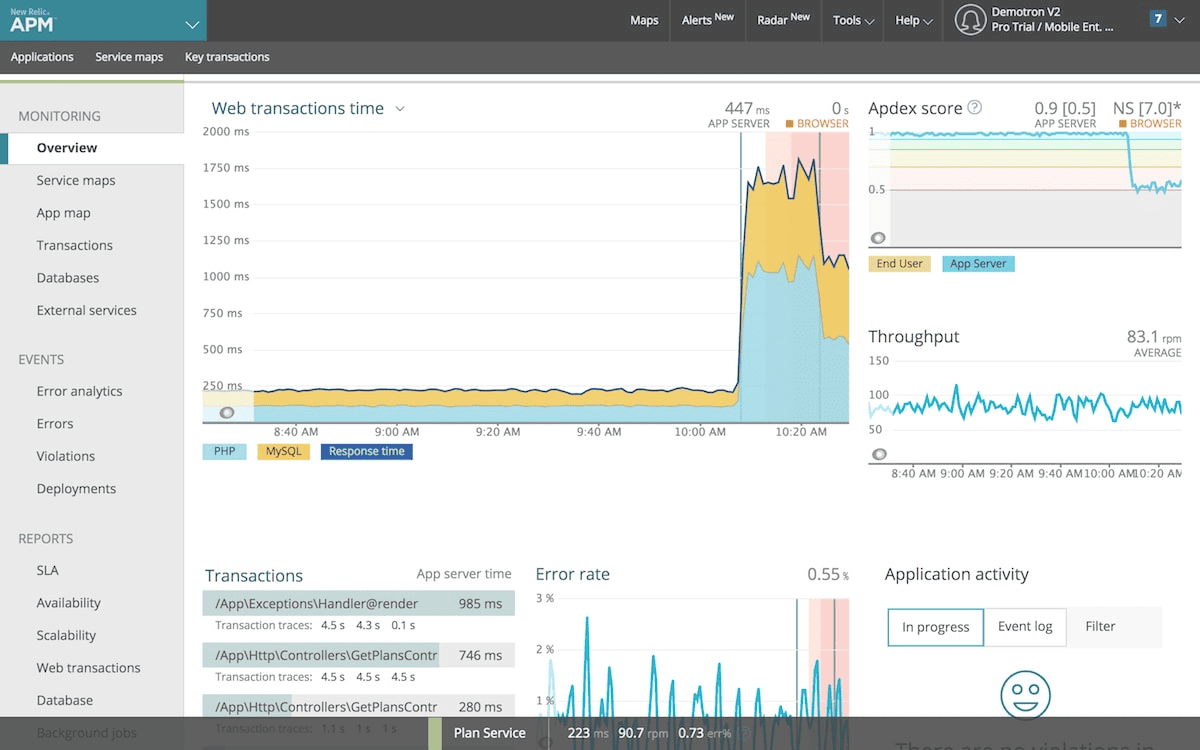
6. New Relic
New Relic offers a unified SaaS observability experience combining logs, metrics, traces, and synthetics under one pricing model. It remains a popular choice for teams valuing simplicity and rapid adoption.
New Relic Strengths / Pros
- Unified telemetry pipeline and instrumentation
- Simple, usage-based pricing model
- AI-assisted anomaly detection and correlation
New Relic Risks / Cons
- Cost scales quickly with data volume
- Limited flexibility for hybrid or on-prem deployments
Looking for alternatives? See Top 10 New Relic Alternatives in 2026 for self-hostable, cost-effective options.
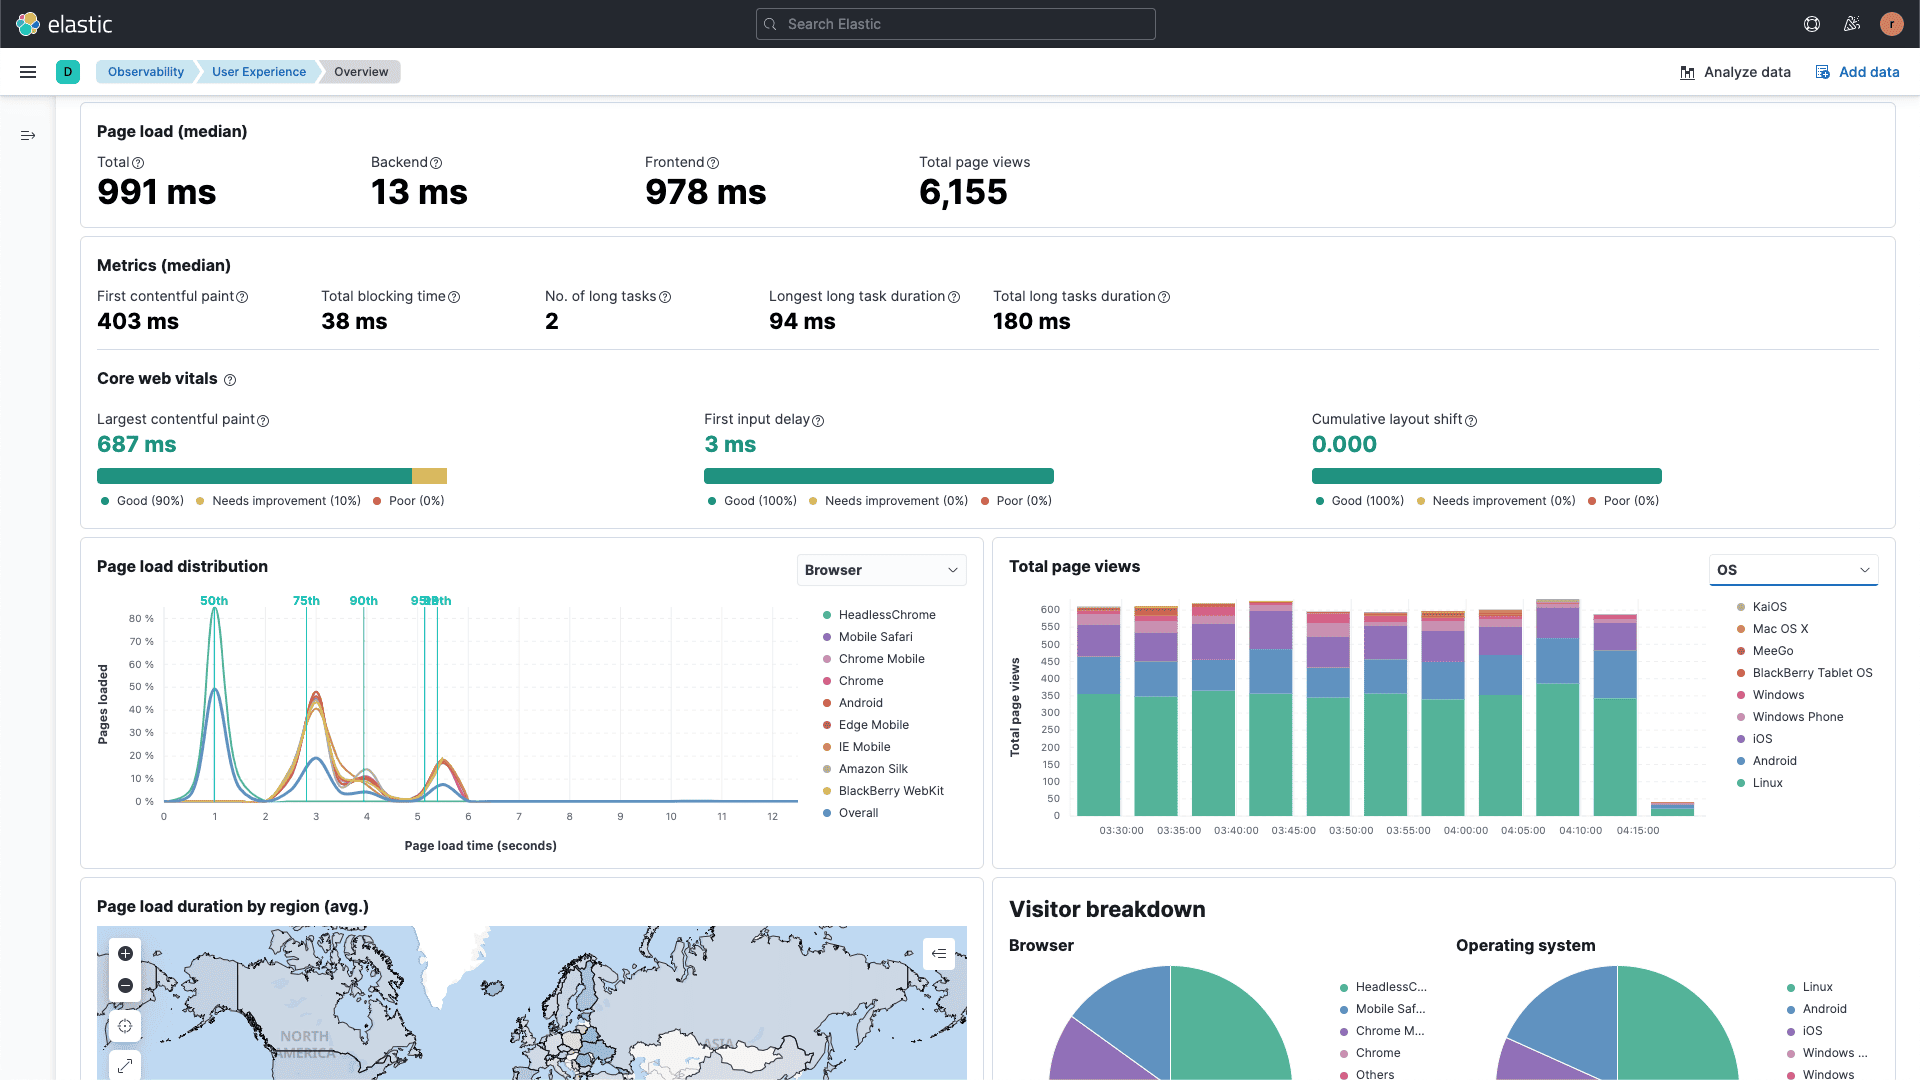
7. Elastic Observability
Elastic brings observability to its well-known search platform, delivering strong hybrid deployment flexibility and powerful correlation capabilities.
Elastic Strengths / Pros
- High interoperability across systems and cloud providers
- Scalable, powerful search across all telemetry types
- Strong self-managed and hybrid deployment support
Elastic Risks / Cons
- Stateful multi-node architecture adds operational complexity
- Requires tuning for optimal storage and performance
- Resource-intensive due to full-text indexing and JVM overhead
- Query languages (ESQL, KQL) are Elastic-specific, limiting portability
Moving away from Elastic? See Top 10 Elasticsearch Alternatives in 2026 for options with simpler operations and lower storage costs.
8. Chronosphere
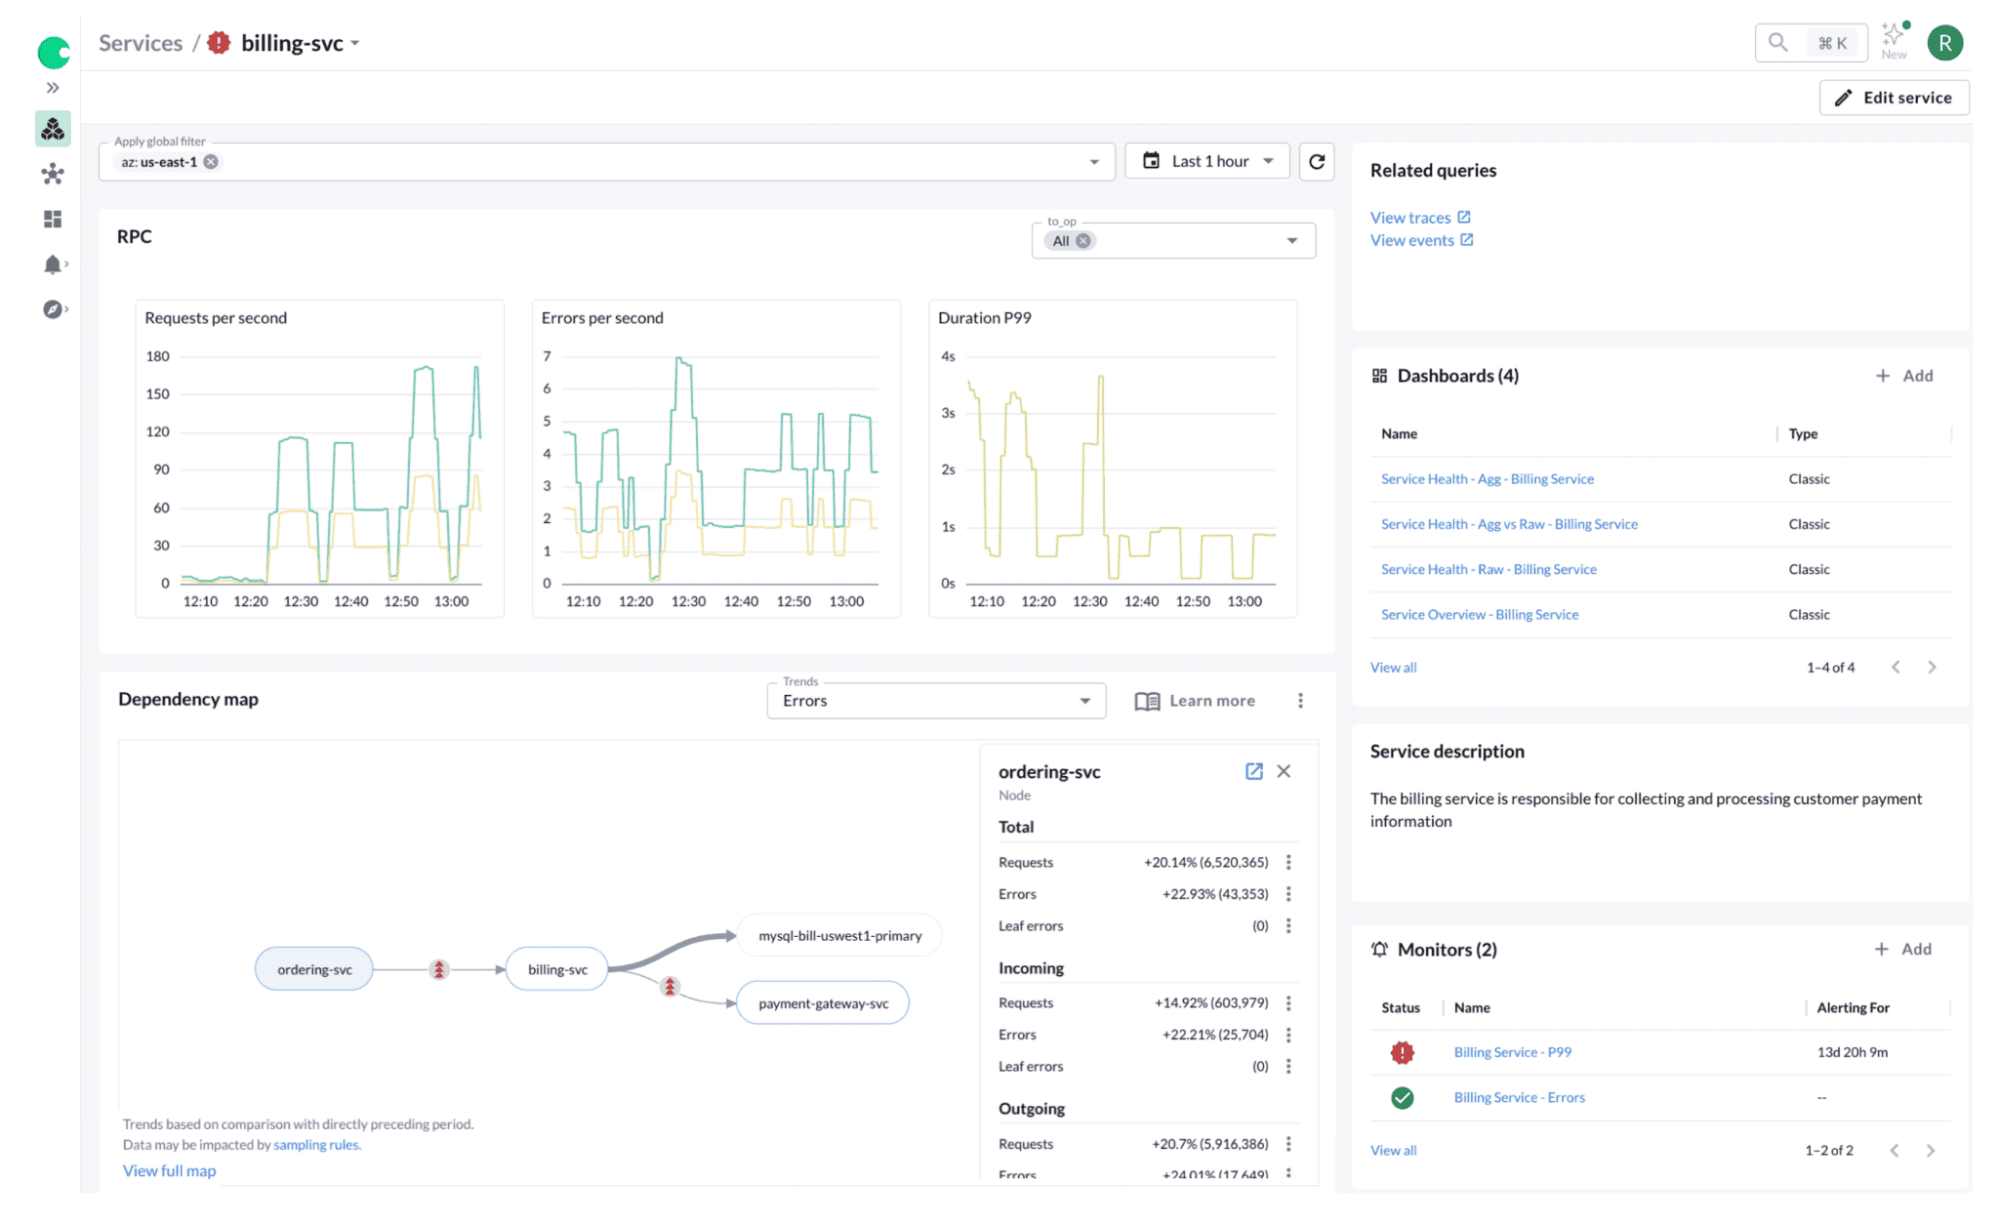
Chronosphere is designed for high-scale, cloud-native environments that generate massive telemetry data. It focuses on cost control, data governance, and high-performance metrics processing.
Chronosphere Strengths / Pros
- Excellent at managing observability cost at scale
- Designed for high-cardinality metric ingestion
- High performance with strong support
Chronosphere Risks / Cons
- Limited log and trace depth compared to broader stacks
- Steeper learning curve for configuration
- Enterprise-only pricing
9. AppDynamics (Cisco)
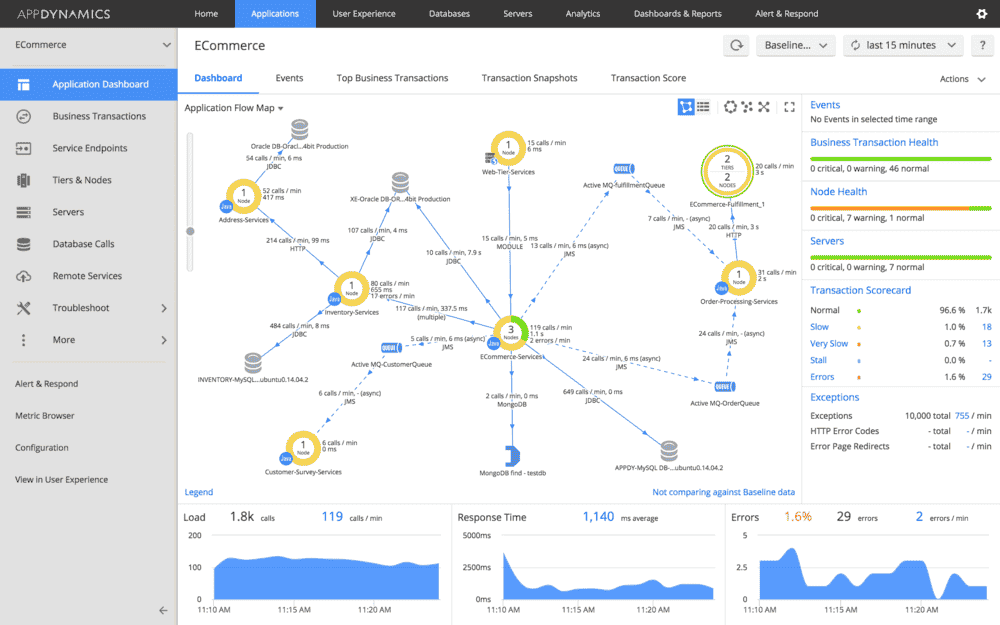
AppDynamics, now under Cisco’s portfolio, is a proven enterprise APM platform focused on application performance, business metrics, and end-user experience.
AppDynamics Strengths / Pros
- Deep APM capabilities and business transaction mapping
- Tight enterprise integrations with Cisco ecosystem
- AI-powered root cause analysis (Cognition Engine)
AppDynamics Risks / Cons
- Limited flexibility for open standards and open telemetry
- Moderate to high vendor dependency
- Opaque enterprise pricing
10. Honeycomb
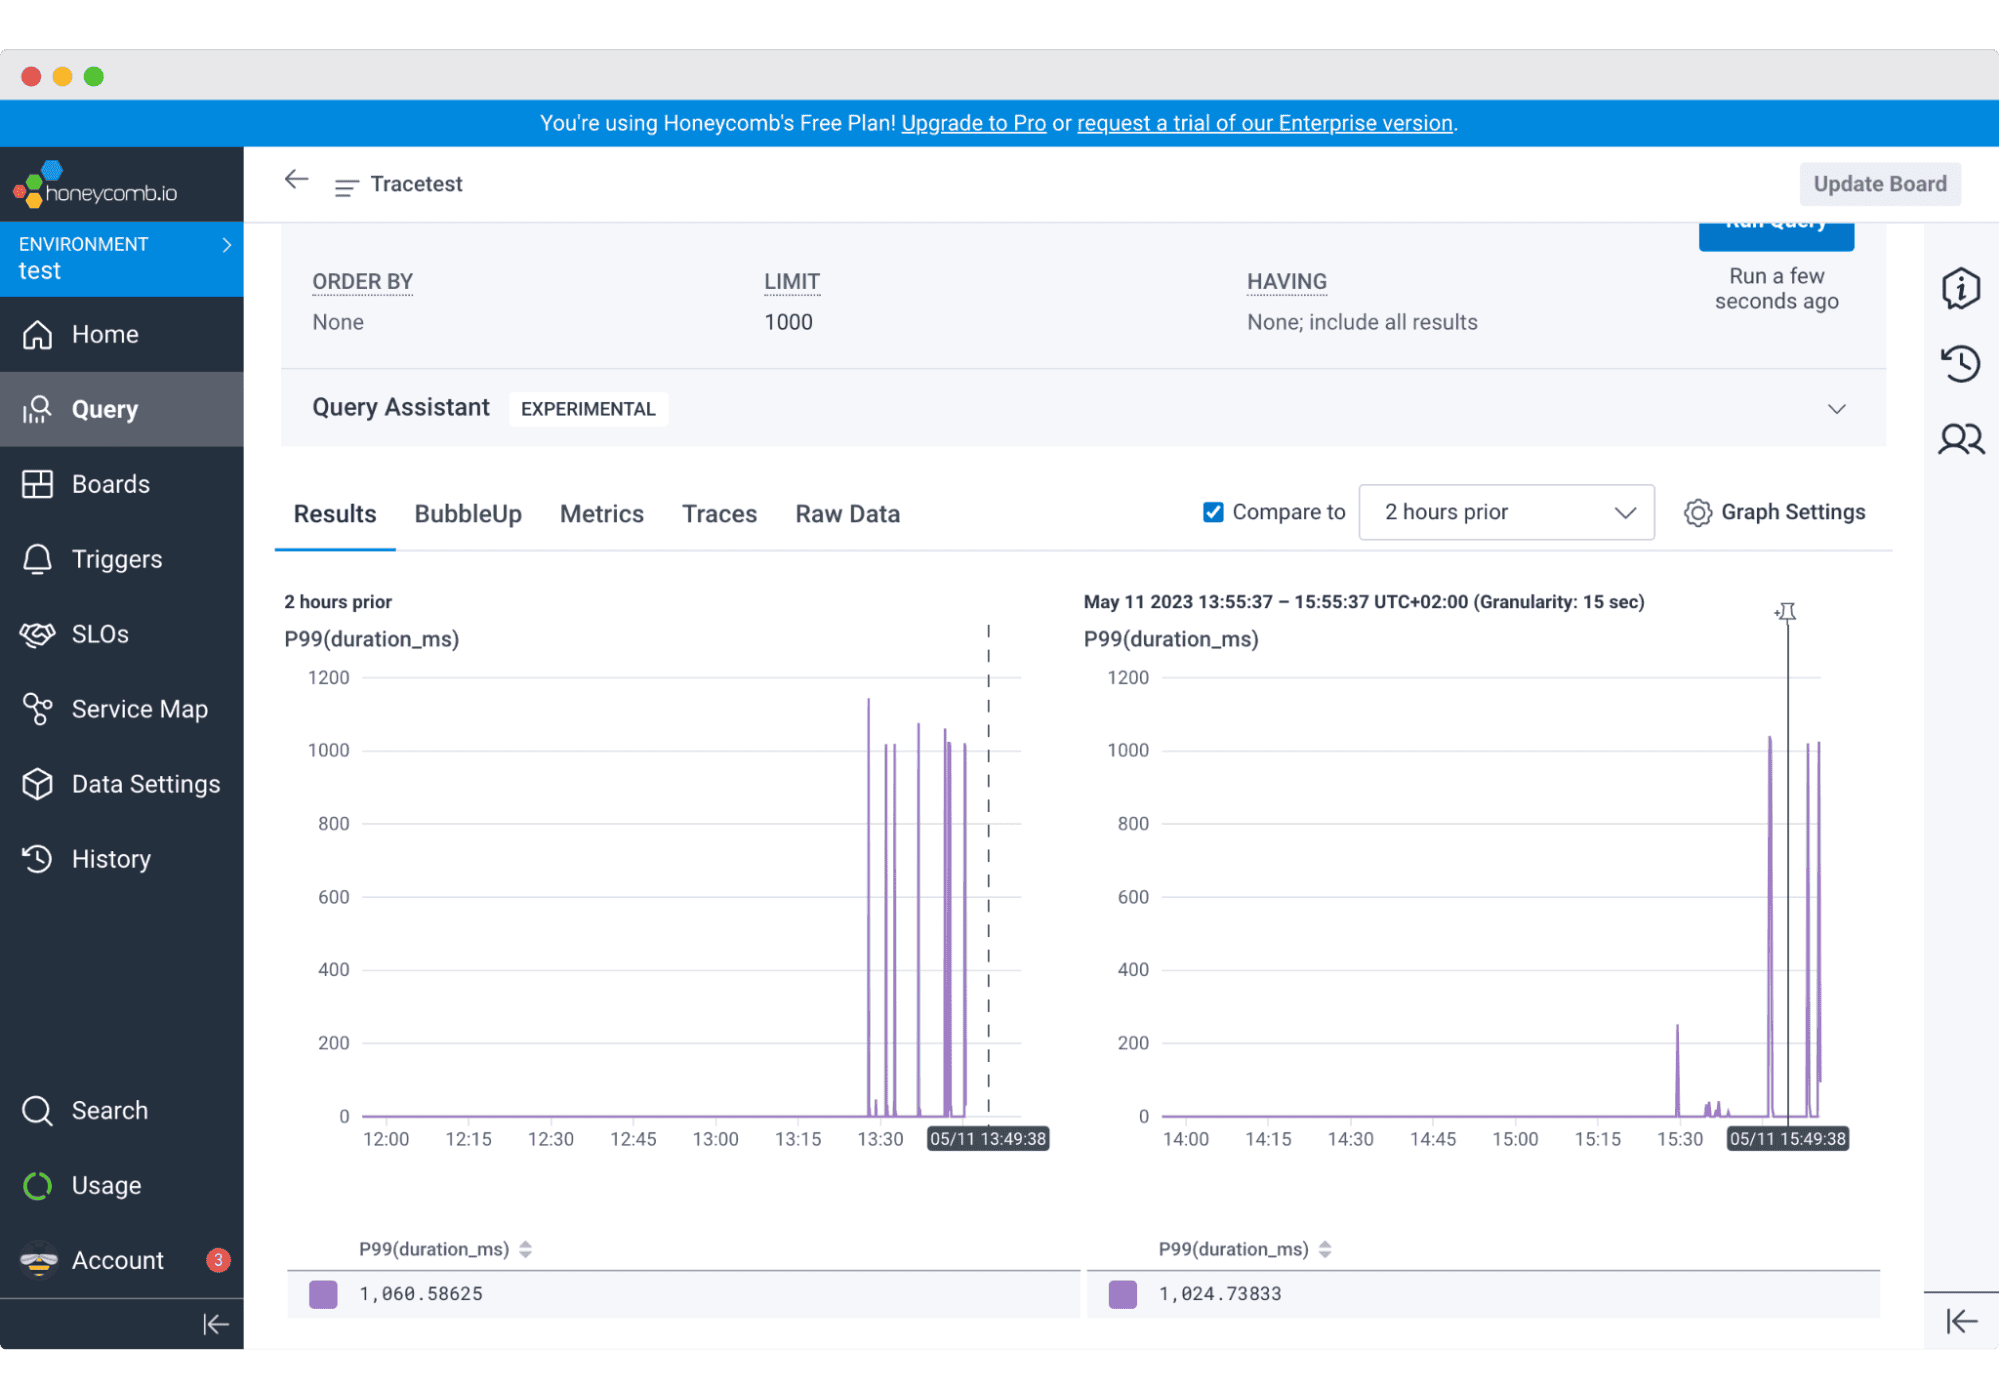
Honeycomb continues to lead in event-based observability, offering fast, granular debugging for distributed systems. Its Query Assistant allows engineers to ask questions in plain English.
Honeycomb Strengths / Pros
- Event-based debugging with millisecond-level correlation
- Query Assistant (AI-powered natural-language interface)
- Powerful data model (Retriever) for analytical queries
- Ideal for developer-centric observability workflows
Honeycomb Risks / Cons
- Event-based cost model can scale up rapidly
- Proprietary backend limits portability
Comparison Table: Observability Platforms 2026
| Platform | Inter operability | Deployment Flexibility | AI / ML Support | Query Language | Vendor Lock-In Risk | Cost Transparency |
|---|---|---|---|---|---|---|
| OpenObserve | High (OTel + APIs) | Cloud / Self-hosted / Hybrid | Actions, O2 AI Agent (MCP Server) – Hook in your own LLMs for proactive workflows | SQL & PromQL (Open) | Low | High (Ingestion-based licensing) |
| Datadog | High | Cloud (SaaS only) | Watchdog AI / Anomaly Detection | Proprietary | High | Low |
| Dynatrace | High | Cloud / Self Host | Davis AI (automation engine) | Proprietary | Medium | Moderate |
| Splunk | High | Cloud / Self-Host | AI-driven SPL analytics | Proprietary | High | Low – complex tiers |
| Grafana | Medium | Cloud / Self-hosted | Plugin-based AI add-ons | PromQL, LogQL (Open and Proprietary) | Low | Moderate |
| New Relic | Medium | Cloud (SaaS) | NR AI Assistant | Proprietary | Medium | Moderate |
| Elastic | High | Managed/ Self-hosted | ESQL/KQL Automation | Proprietary | Medium | High |
| Chronosphere | Medium | Cloud (SaaS) | AI cost optimizer / usage insights | PromQL(Open) | Medium | Moderate |
| AppDynamics | Medium | Cloud / Hybrid | Cognition Engine (AI RCA) | Proprietary | High | Low |
| Honeycomb | Medium | Cloud (SaaS) | Query Assistant (AI NLP Interface) | SQL-like Retrieve | Medium | Medium |
Conclusion
Each observability platform in 2026 reflects different trade-offs between control, scalability, and simplicity. While legacy vendors continue to dominate at enterprise scale, newer open-source and hybrid models are enabling teams to achieve full-stack visibility without vendor lock-in or unpredictable billing.
For organizations that value enterprise-grade observability with flexibility, openness, and lower operational overhead compared to legacy vendors, OpenObserve stands out as a modern, unified, and transparent alternative.
Sign up for an OpenObserve Cloud account (14-day free trial) or visit our downloads page to self-host OpenObserve and experience full-stack observability designed for scale and control.
Related guides:
Frequently Asked Questions
About the Author
Manas Sharma


Manas is a passionate Dev and Cloud Advocate with a strong focus on cloud-native technologies, including observability, cloud, kubernetes, and opensource. building bridges between tech and community.
Follow OpenObserve on Google
Add OpenObserve as a preferred source to see more of our articles in Google Search and Top Stories.













