OpenObserve vs Dash0: Why Teams Choose OpenObserve (2026)




Ready to get started?
Try OpenObserve Cloud today for more efficient and performant observability.
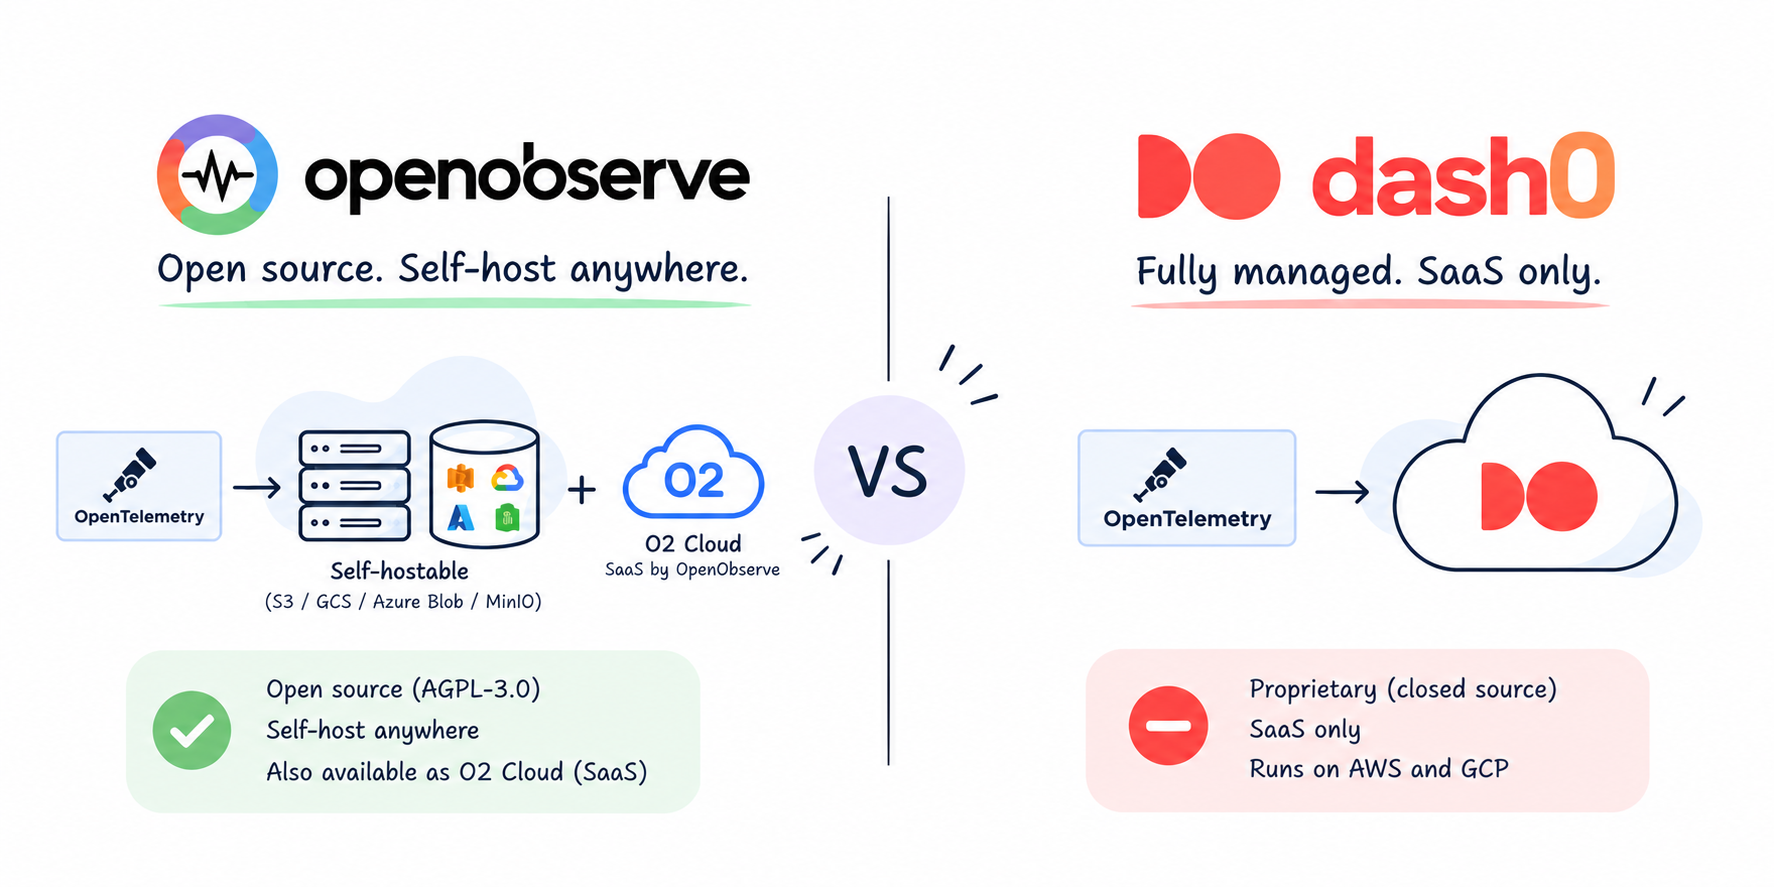
TL;DR
Choose OpenObserve. It costs less for the log and span workloads most teams run, it is ISO 27001 certified today, it deploys wherever you need it, and it includes continuous profiling, incident management, and an AI SRE agent in the same platform as your telemetry. Dash0 is a capable SaaS product, and the section on where it leads below names the two areas where it's ahead today.
- Cost: OpenObserve Cloud bills $0.50 per GB ingested and $0.01 per GB queried. Dash0 bills per record and per metric point, and adds per-seat and per-credit AI fees. OpenObserve is cheaper for logs and spans below about 1.2 KB per record.
- Compliance: ISO 27001 certified, SOC 2 Type II, GDPR compliant, and a HIPAA BAA.
- Data ownership: self-host it, or bring your own bucket so telemetry stays in your cloud account. Dash0 is SaaS only.
- Incidents and AI: related alerts are grouped into incidents with AI root cause analysis, and the SRE Agent answers questions across your logs, metrics, and traces.
- Profiling: CPU, memory, and lock profiles from Java, Go, Rust, and eBPF, alongside logs, metrics, and traces.
- Breadth: dashboards, alerts, pipelines, RUM, synthetics, SLOs, anomaly detection, an MCP server, LLM observability, and database monitoring on one per-GB bill.
OpenObserve vs Dash0: Feature-by-Feature Comparison
| Feature | OpenObserve | Dash0 |
|---|---|---|
| Core signals | ||
| Logs, metrics, traces | ✅ Over OTLP, queried with SQL and PromQL | ✅ Over OTLP, queried with SQL and PromQL |
| Dashboards | ✅ Built in, can be generated through the SRE Agent | ✅ Perses-based, dashboards as code |
| Alerts | ✅ Real-time and scheduled, on SQL or PromQL | ✅ PromQL check rules |
| Pipelines | ✅ Real-time and scheduled VRL pipelines: parse, enrich, redact, route | SignalControl: filter, sample, convert, aggregate before storage |
| Continuous profiling | ✅ CPU, memory, and locks from Java, Go, Rust, and eBPF | ✅ CPU, memory, and GPU/CUDA |
| Digital experience | ||
| Real User Monitoring | ✅ Built in, with session replay | ✅ Web events, billed per signal |
| Synthetic monitoring | ✅ Beta: HTTP, TCP, TLS, SSH, and Playwright browser checks | ✅ API checks, billed per run |
| Reliability and AI | ||
| Incident management | ✅ Related alerts grouped into incidents, with AI root cause analysis | Investigations through Agent0 |
| SLOs | ✅ Multi-window burn-rate alerting | Private Beta, enabled per organization |
| Anomaly detection | ✅ Built into alerting | Through Agent0 |
| AI SRE agent | ✅ SRE Agent: root cause analysis, queries, dashboards, alerts | ✅ Agent0: root cause analysis and fix pull requests, $0.60 per credit |
| AI assistant | ✅ Plain English to SQL, PromQL, and VRL | ✅ Through Agent0 |
| MCP server | ✅ stdio or SSE, RBAC-scoped, audit-logged, self-hostable | ✅ Remote, cloud-hosted, OAuth 2.0 |
| LLM observability | ✅ Model calls, token usage, and latency | ✅ LLM and agent monitoring |
| AI coding insights | ✗ | ✅ AI SDLC Insights, $10 per user per month |
| Infrastructure and data | ||
| Database monitoring | ✅ PostgreSQL, MySQL, SQL Server, and more, with query-level latency | ✅ PostgreSQL, MySQL, Cloud SQL integrations |
| Bring your own bucket | ✅ AWS S3, Azure Blob, or Google Cloud Storage | ✗ |
| Deployment | Self-hosted single binary, Kubernetes HA, or Cloud | SaaS only, on AWS and GCP |
| Open source | ✅ AGPL-3.0 | ✗ |
| Pricing | $0.50 per GB ingested, $0.01 per GB queried, unlimited users | Per record and per metric point, plus AI add-ons |
Cost: OpenObserve bills bytes, Dash0 bills records
Dash0 meters per record. Its published pricing is $0.06 per million spans or log records for ingestion plus $0.54 per million for 30-day storage, and $0.02 plus $0.18 per million metric points for ingestion and 13-month storage. It also charges $10 per user per month for AI SDLC Insights and $0.60 per Agent0 credit.
OpenObserve Cloud bills per GB: $0.50 per GB ingested and $0.01 per GB queried. Logs and traces keep 30 days by default, metrics keep 15 months, and both are included in the ingestion price. Users are unlimited on every plan, so there is no per-seat line item (pricing).
Per-record and per-byte pricing meet at a fixed record size. For logs and spans on 30-day retention, OpenObserve's ingestion cost per million records is $0.50 multiplied by the average record size in KB, divided by 1,000. That equals Dash0's $0.60 per million at about 1.2 KB per record. Below that size OpenObserve costs less, and the gap widens as records get smaller. Above it, Dash0's per-record price is lower, before query fees and add-ons. Most log and span records are well under 1.2 KB, but measure your own average, because that one number decides which bill is lower for logs and spans.
On that 500 GB/day example, Dash0 comes to about $985 a day and OpenObserve Cloud to $250 a day, before Dash0's per-seat and Agent0 fees. The chart assumes about 0.5 KB per log record, 0.4 KB per span, and 25 bytes per metric point, so plug in your own record sizes before you rely on the figure.
Retention: longer history without a surprise bill
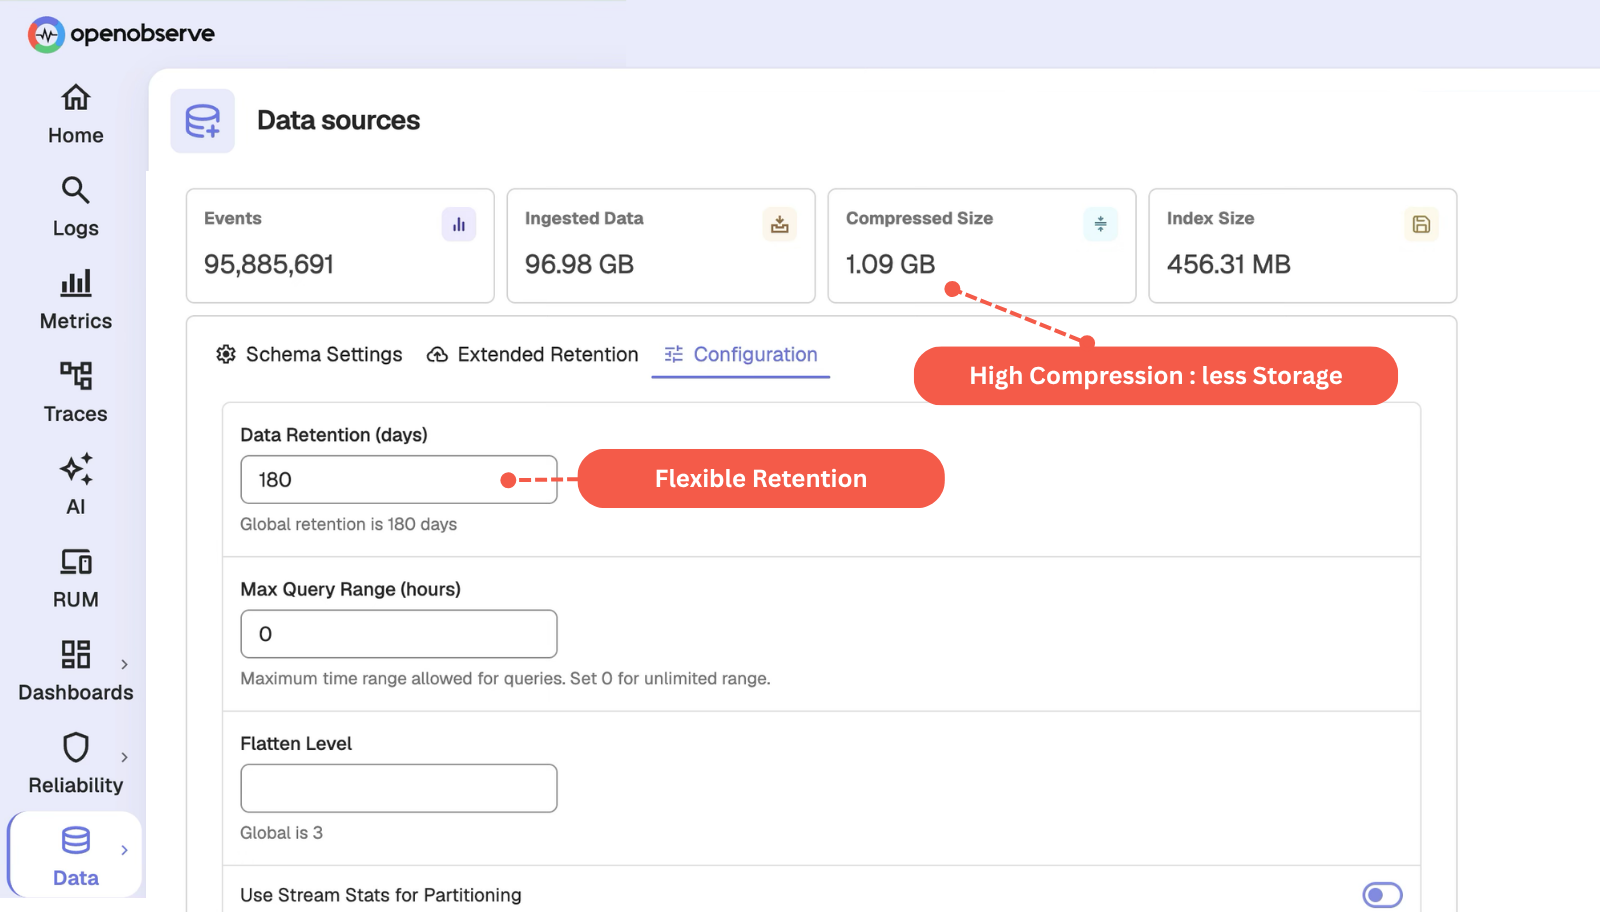
Dash0 keeps logs and spans for 30 days by default, with paid retention classes up to 390 days. OpenObserve keeps logs and traces for 30 days by default, extends non-metrics data for $0.02 per GB per additional 30-day period, and keeps metrics for 15 months at no extra charge.
Retention is also configurable per stream. Extended retention keeps the exact time range of an incident for up to 10 years, so the evidence from last quarter's outage is still searchable when the postmortem is written. The default for the whole platform is set with ZO_COMPACT_DATA_RETENTION_DAYS, documented in the environment variables reference.
Compliance: certified today
Both platforms meet the requirements that most enterprise reviews start with: SOC 2 Type II, GDPR, and a BAA for HIPAA workloads. OpenObserve is also ISO 27001 certified now. Dash0 expects ISO 27001 in Q1 2027 and lists PCI DSS as in progress (Dash0's public security information). A current ISO 27001 certificate, which many vendor reviews require, is already in hand with OpenObserve.
Teams have used OpenObserve to meet these requirements in practice. Avatar's story covers how it achieved SOC 2 compliance while improving uptime and cutting costs.
Data ownership and deployment
OpenObserve runs as a single binary you download and start, as a high-availability deployment on Kubernetes, or on OpenObserve Cloud. Its data lives in object storage as Parquet files, on Amazon S3, Google Cloud Storage, Azure Blob, MinIO, or RustFS, as the architecture guide explains.
Bring your own bucket connects your own AWS S3, Azure Blob, or Google Cloud Storage bucket. The telemetry stays in your cloud account, under your access controls, and you pay your cloud provider for the storage. OpenObserve is open source under AGPL-3.0, so you can read the code and keep running it yourself. The move from Apache to AGPL explains why the project made that change.
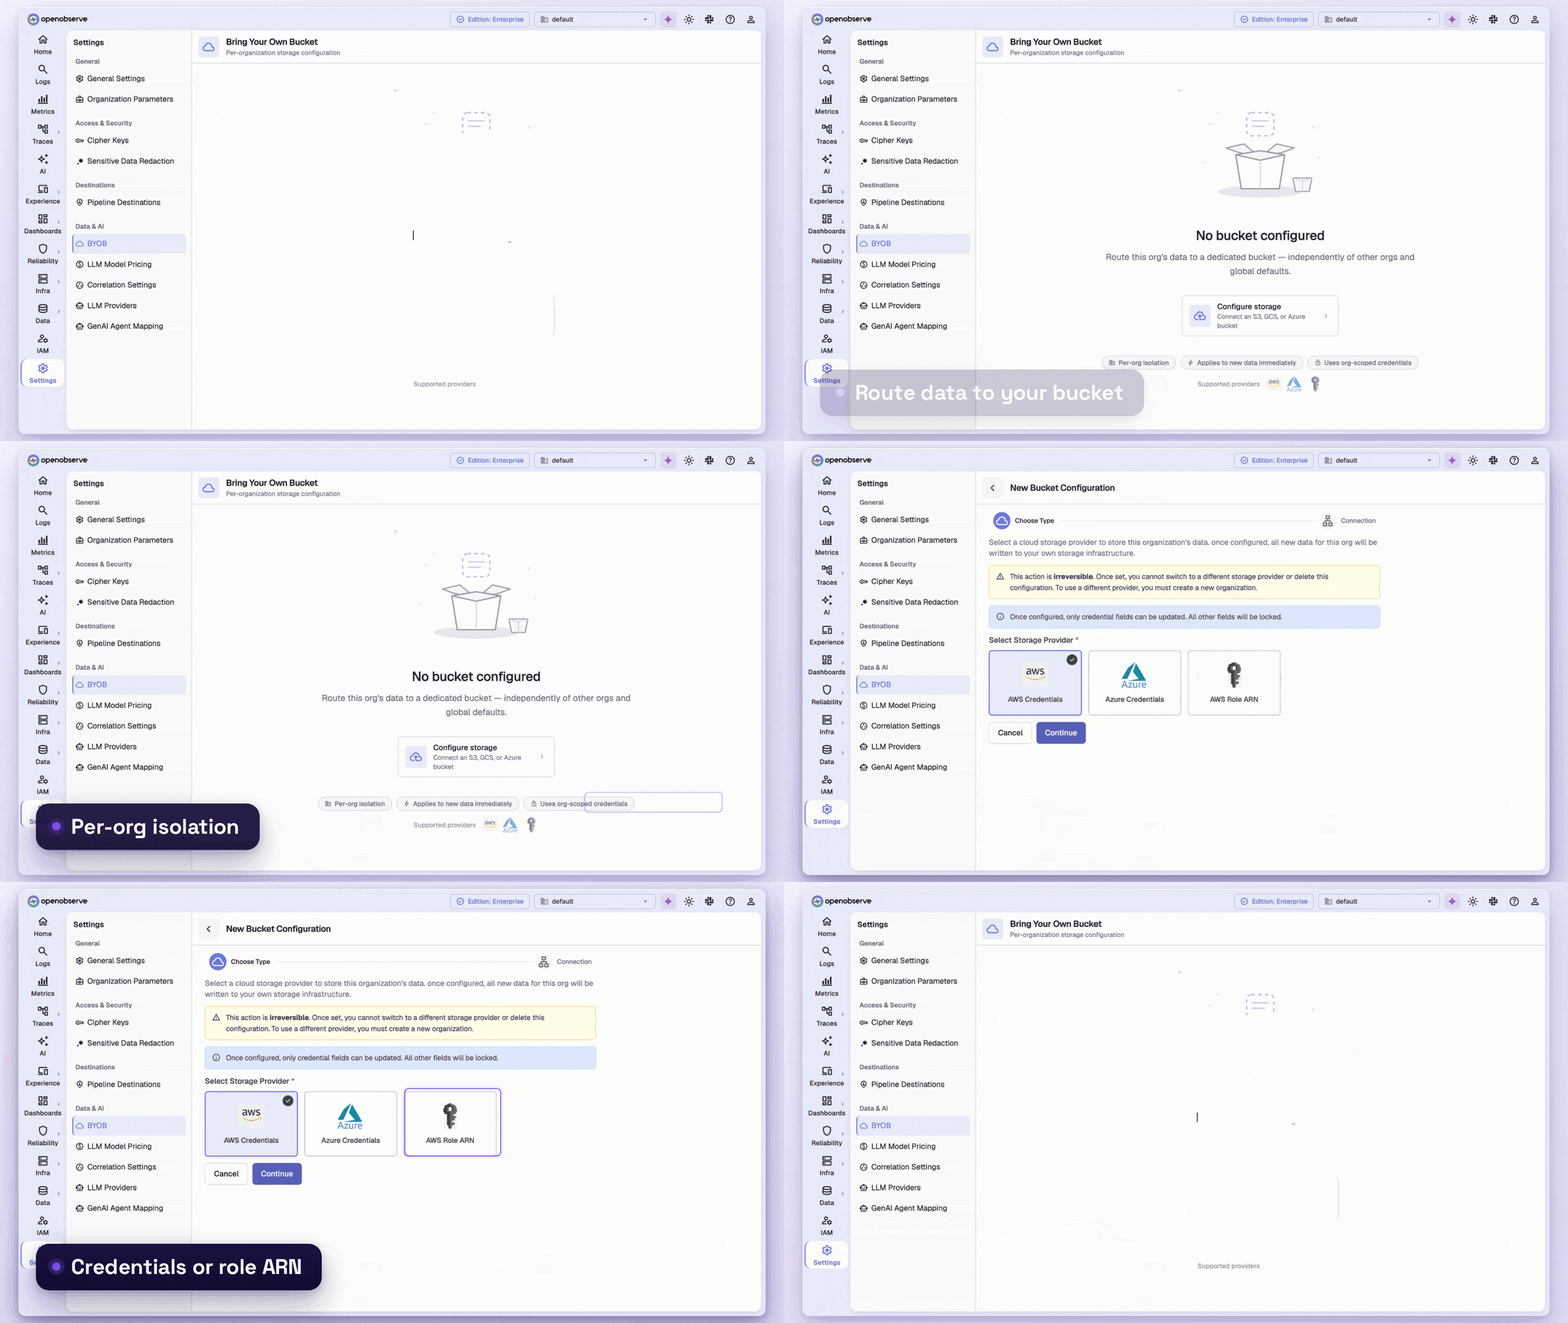
Dash0 is SaaS only, running on AWS and GCP, with no self-hosted or on-premises option (Dash0's public security information). It does let EU customers pin telemetry storage to the EU. On OpenObserve, you decide where your data lives, either by self-hosting or by bringing your own bucket.
AI-driven incident response
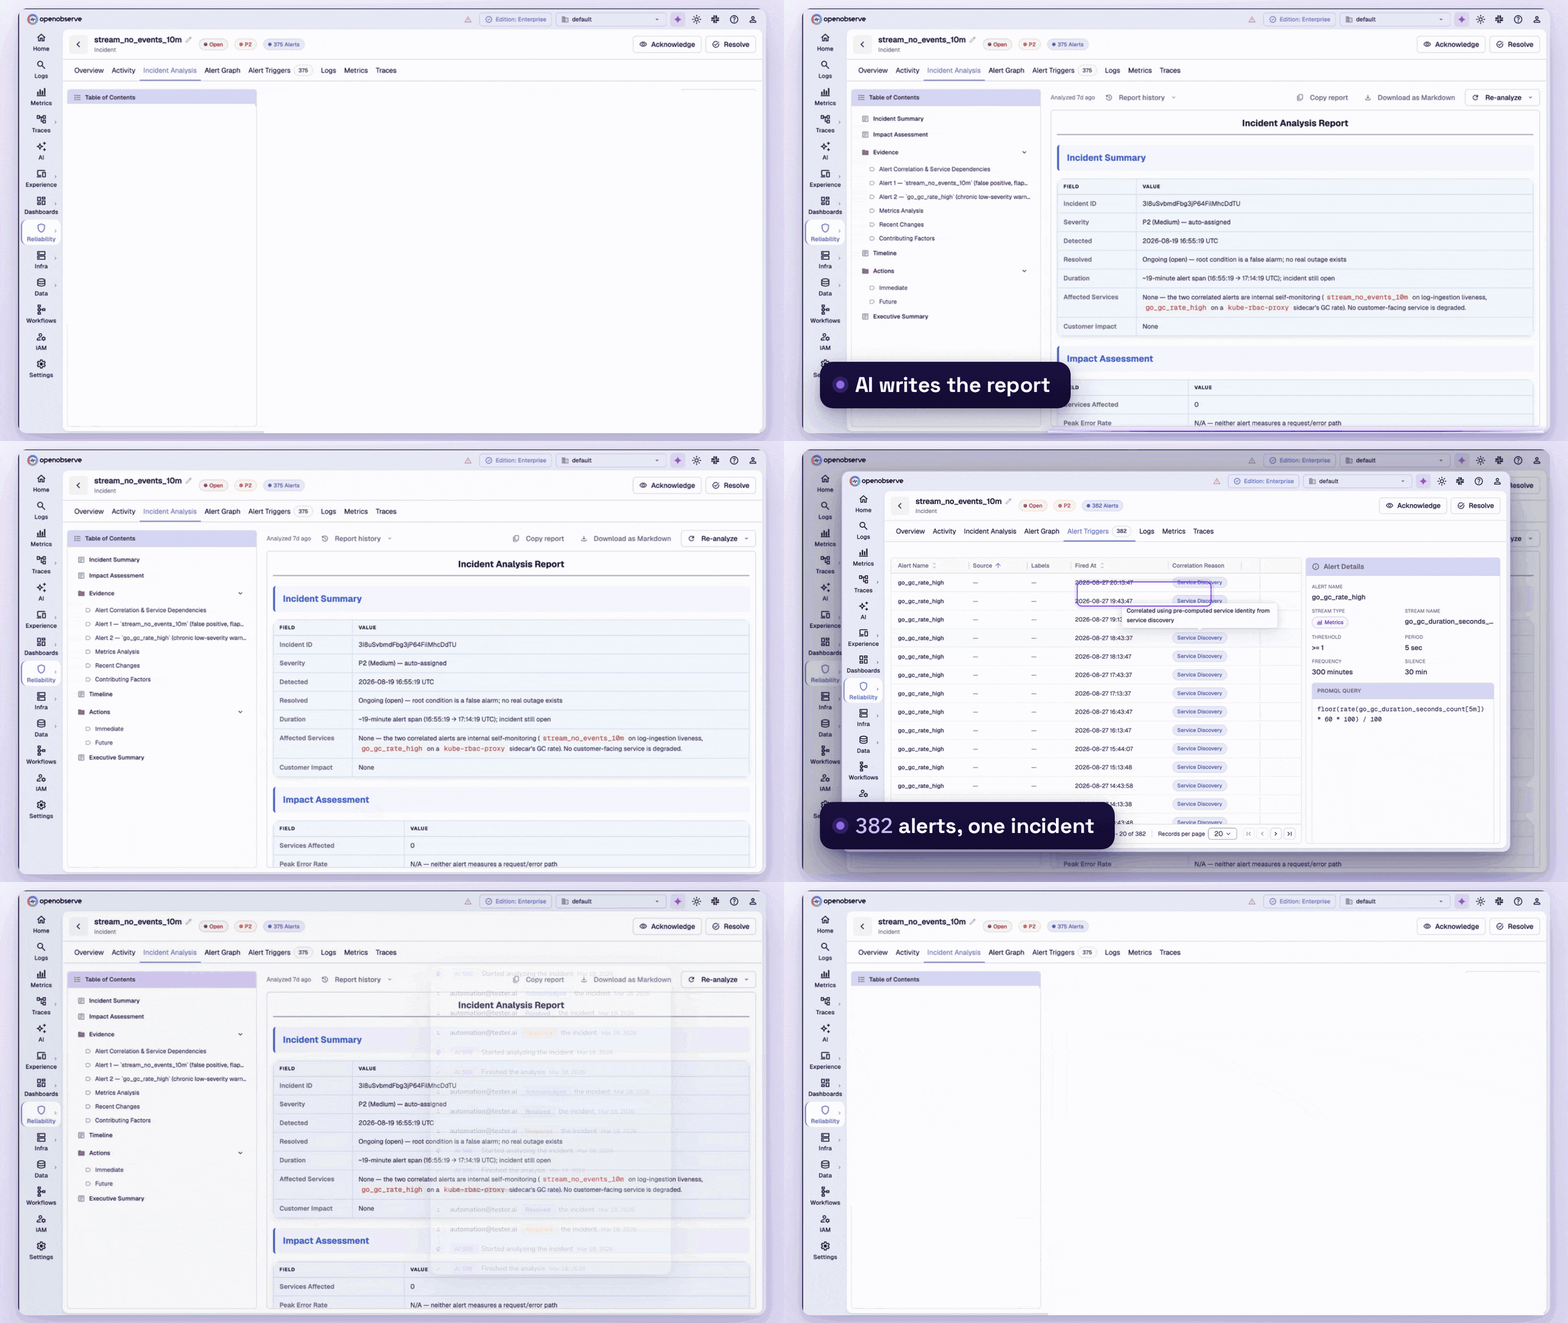
OpenObserve Incident Management groups related alert firings into a single incident, correlates the logs, metrics, and traces involved, and runs AI root cause analysis. It reanalyzes the incident as new evidence arrives. The SRE Agent answers questions in plain English across your telemetry, generates SQL, PromQL, and VRL queries, and creates dashboards and alerts through chat. Teams can also extend it with custom toolsets over MCP, CLI, and skills. The OpenObserve MCP server lets Claude, Cursor, or any MCP client query your telemetry directly, with every agent query scoped by RBAC and recorded in an audit trail. Dash0 also offers a remote MCP server, authenticated with OAuth 2.0. For the workflow in practice, read how AI incident management reduces MTTR.
SLOs and burn-rate alerting
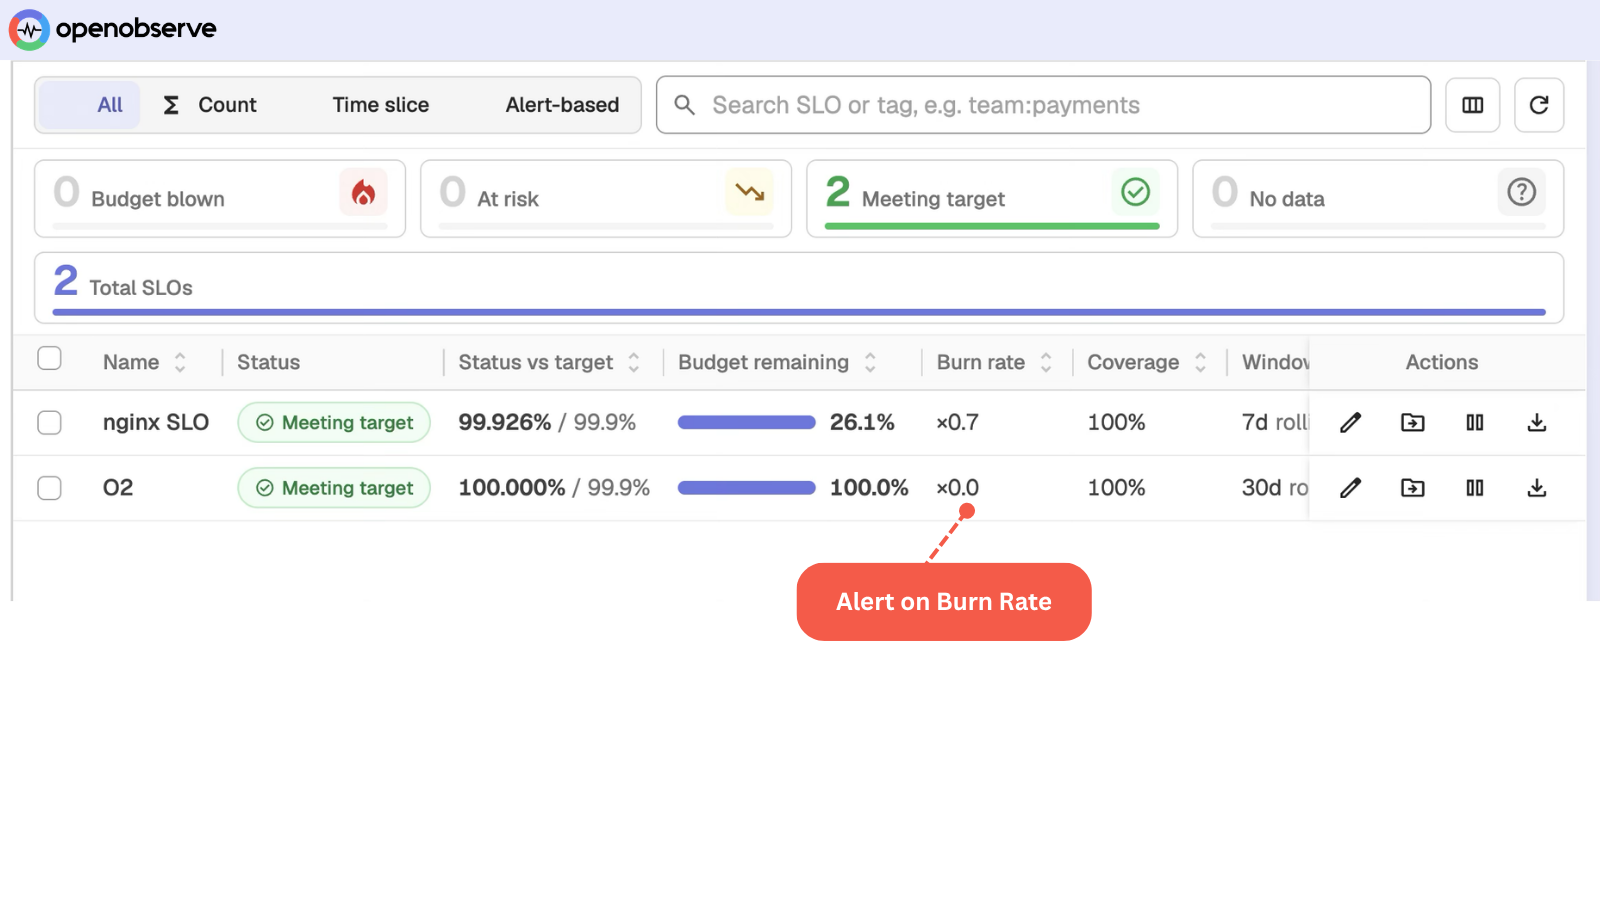
OpenObserve ships SLOs with multi-window burn-rate alerting built in. A burn-rate alert measures how fast an SLO's error budget is being spent, so the page arrives while budget still remains to protect. The SLO alert form suggests fast, mid, and slow configurations, and you can attach several of them to one SLO. The alerting on SLOs guide covers the thresholds, windows, and how alerts behave when an SLO is frozen.
One platform for every signal
OpenObserve ingests logs, metrics, traces, and continuous profiling over OTLP. Profiles come from Java async-profiler, Go and Rust pprof, the OpenTelemetry eBPF profiler, or any OTLP source, and cover CPU, memory, and lock contention. When a trace shows a slow request, you can see which function was burning the CPU in the same platform, without adding a separate profiling vendor.
LLM applications are covered too. The LLM observability guide shows how to trace model calls, token usage, and latency, and anomaly detection watches your signals for unusual behavior. Sensitive fields can be redacted during ingestion, as this guide to sensitive data redaction describes.
Pipelines, RUM, synthetics, and database monitoring
Pipelines process data in real time as it arrives or on a schedule. VRL functions parse any format, enrich events from lookup tables, redact sensitive fields before they reach storage, convert logs to metrics, and route streams to multiple destinations. Dash0's SignalControl handles the reduction side, filtering, sampling, and aggregating telemetry so storage is billed only on what you keep.
Real User Monitoring is built in with session replay, so a slow page view links to the backend traces behind it. Synthetic monitoring, currently in Beta, runs HTTP, TCP, TLS, and SSH checks plus real Playwright browser scripts from multiple regions, and each result lands in a stream you query with SQL and alert on like any other data.
Database monitoring collects PostgreSQL, MySQL, SQL Server, and other database metrics through the OpenTelemetry Collector, with per-query p50, p95, and p99 latency and the wait events behind slow queries. Dashboards and alerts work the same way on database data as on every other signal.
Where Dash0 leads today
Two areas are ahead on Dash0 today, and they matter for an accurate comparison:
- GPU and CUDA profiling. Dash0 offers code-level GPU and CUDA profiling alongside CPU and memory profiling, following its acquisition of Polar Signals. OpenObserve's profiling covers CPU, memory, and locks, and its docs don't describe GPU profiling yet.
- Fix pull requests from investigations. Dash0's Agent0 traces an issue to the offending commit and drafts a fix as a pull request. OpenObserve's SRE Agent produces root cause analysis, but it doesn't open pull requests.
Test it on your own traffic
OpenObserve Cloud includes a 14-day free trial with no credit card required. Point your existing OpenTelemetry Collector at both platforms for a week, then compare query latency, your invoice against your own record sizes, and how each handles a real incident. Migration is straightforward because both platforms are OpenTelemetry-native: add an OTLP exporter for OpenObserve, dual-ship while you check that the data matches, and port your dashboards and alert rules. The getting started guide walks through the first ingest.
Plans and editions
The open source edition of OpenObserve is free to self-host. Self-hosted Enterprise is free for up to 50 GB per day of ingestion, and Enterprise features add SSO, RBAC, audit trails, sensitive data redaction, and the SRE Agent. OpenObserve Cloud is pay-as-you-go at $0.50 per GB ingested, and the Cloud Enterprise plan adds bring-your-own-bucket with infinite retention. AI usage on Cloud draws on a shared free credit pool, then pay-as-you-go (AI credits guide), while self-hosted deployments use your own AI provider key with the SRE Agent. The license and pricing guide has the full details.
Frequently Asked Questions
About the Author
Simran Kumari

Passionate about observability, AI systems, and cloud-native tools. All in on DevOps and improving the developer experience.
Follow OpenObserve on Google
Add OpenObserve as a preferred source to see more of our articles in Google Search and Top Stories.












