Compare the top 10 AIOps platforms in 2026. AI-powered observability tools for autonomous operations, cost optimization, and intelligent incident response.
Discover how OpenObserve built the "Council of Sub Agents" - eight specialized AI agents powered by Claude Code that automate end-to-end testing. Learn how we reduced feature analysis time from 60 minutes to 5 minutes, eliminated 85% of flaky tests, grew test coverage from 380 to 700+ tests, and caught a production bug before customers reported it. This deep dive reveals the architecture, real-world impact, and lessons learned from building an autonomous QA team that doesn't just automate testing - it amplifies quality.
Cloud native was promised to be simple, yet observability has become a massive tax on both budgets and engineering time. Our new CRO, Shani Shoham, shares why he’s joining OpenObserve to break the cycle of expensive complexity and operational toil.
A comprehensive comparison of the top 10 observability platforms in 2026 highlighting their strengths, trade-offs, and use-cases.
A comprehensive comparison of the top 10 open source observability platforms in 2026 highlighting their strengths, trade-offs, and use-cases.
OpenObserve Kubernetes Operator brings observability as code to platform teams. Manage alerts, pipelines, and functions as Kubernetes resources with GitOps workflows.
Automatically extract patterns from millions of logs in seconds. Learn how OpenObserve's log pattern analysis helps SREs reduce incident investigation time from 30 minutes to under 5 minutes.
DataDog vs OpenObserve APM comparison: $120/day LLM charge, SQL trace dashboards, OTel native, service dependency mapping, and 60-90% cost savings with real data.
DataDog vs OpenObserve metrics comparison: PromQL support, high-cardinality handling, custom metrics auto-generation, and 60-90% cost savings with real data.
Traditional monitoring tools fail when you need them most. Learn how Rust-powered observability platforms solve memory safety issues and deliver reliable, high-performance monitoring at 60-90% and lower cost.
Learn how OpenObserve reduces Mean Time to Detect and Mean Time to Resolve through intelligent alert correlation, deduplication, and automated incident creation. Cut through alert fatigue with SLO-based prioritization and Actions automation.
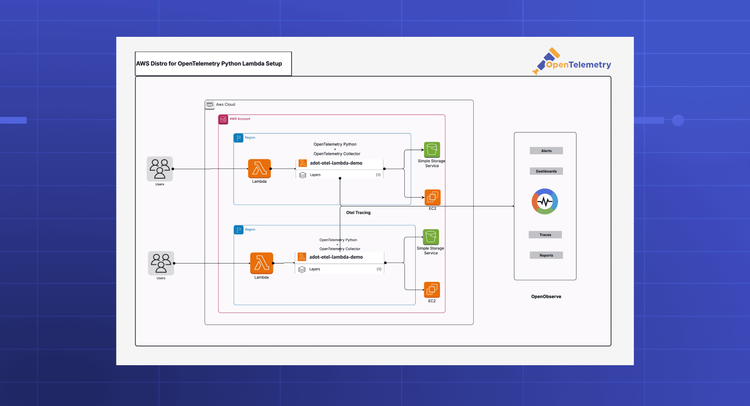
Learn how to implement distributed tracing for AWS Lambda using the AWS Distro for OpenTelemetry (ADOT) layer. This step-by-step guide shows you how to automatically capture traces from AWS SDK calls and send them to OpenObserve without writing any instrumentation code. Get full visibility into your serverless applications with open standards.
Learn how to integrate ServiceNow with OpenObserve to automatically create incidents from alerts. Step-by-step guide covering webhook integration and openobserve actions with deduplication support.
Discover how full-stack observability helps teams correlate telemetry across systems to cut MTTR, reduce data costs, and improve performance.
OpenObserve v0.16.1 delivers meaningful new features including Alert History for debugging monitoring reliability, Pipeline History for execution tracking, and automatic Log Pattern extraction that groups millions of logs into actionable insights. This release brings significant performance improvements with optimized indexing and query execution, alongside UI/UX refinements that enhance readability and usability across the platform. Teams can now better understand their system behavior, reduce alert fatigue through deduplication, and troubleshoot issues faster with comprehensive execution history and diagnostics.
Learn how to scale observability systems to handle Black Friday-level traffic without losing visibility. Discover best practices for ingestion tuning, query optimization, and resilience using OpenObserve.
Explore how OpenObserve’s Sensitive Data Redaction protects PII in observability pipelines. Configure regex-based rules to redact, hash, or drop sensitive data at ingestion or query time for full GDPR and HIPAA compliance.
Learn how to deploy OpenObserve on DigitalOcean with Kubernetes, Spaces, and managed PostgreSQL. Complete production-ready setup guide with Helm configuration.
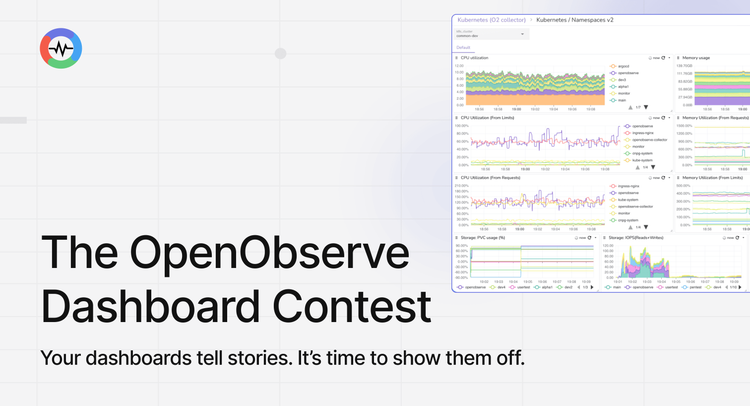
Join the OpenObserve Dashboard Contest and show off your best dashboards. Share your build on LinkedIn with #BuiltWithOpenObserve and #DashboardDrop for a chance to win $300, exclusive swag, and a feature on the OpenObserve blog. Entries close November 21, 2025.
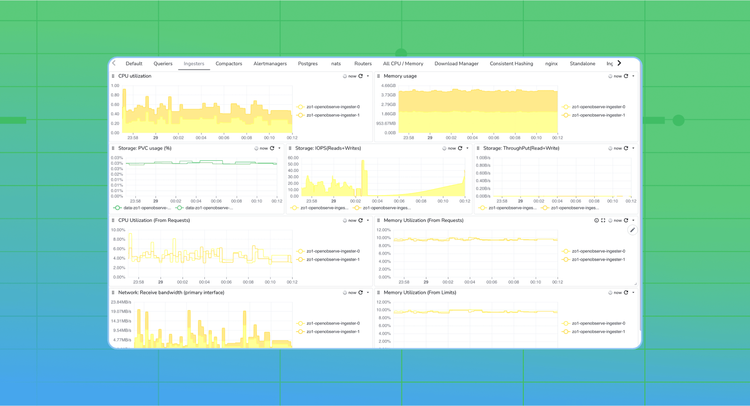
Learn how to effectively monitor your OpenObserve deployment, starting from system health metrics like CPU, memory, and network usage, to OpenObserve’s own internal metrics exposed in Prometheus format. This guide walks through best practices, setup steps, and configuration examples.