Prometheus Metric Types (Counters, Gauges, Histograms, Summaries)




Ready to get started?
Try OpenObserve Cloud today for more efficient and performant observability.
Your application is running in production. How do you know if it's healthy? Is it fast? Are users experiencing errors? How many requests per second is your API handling right now?
These aren't just hypothetical questions ,they're critical to running reliable systems. The answer lies in metrics: numerical measurements that tell the story of your system's behavior over time.
In this comprehensive guide, we'll explore Prometheus metrics from the ground up, understand the four core metric types, learn how to choose the right type for your use case, and discover how to transform these metrics into actionable dashboards using OpenObserve.
What Are Prometheus Metrics?
Prometheus metrics are numerical measurements that describe the behavior, performance, and health of your system over time. They’re designed for real-time monitoring, alerting, and debugging, giving you deep visibility into how your application and infrastructure are behaving.
At their core, Prometheus metrics are lightweight, time-series data points tracked over time with timestamps, designed for efficient, high-performance monitoring.
Every Prometheus metric follows this structure:
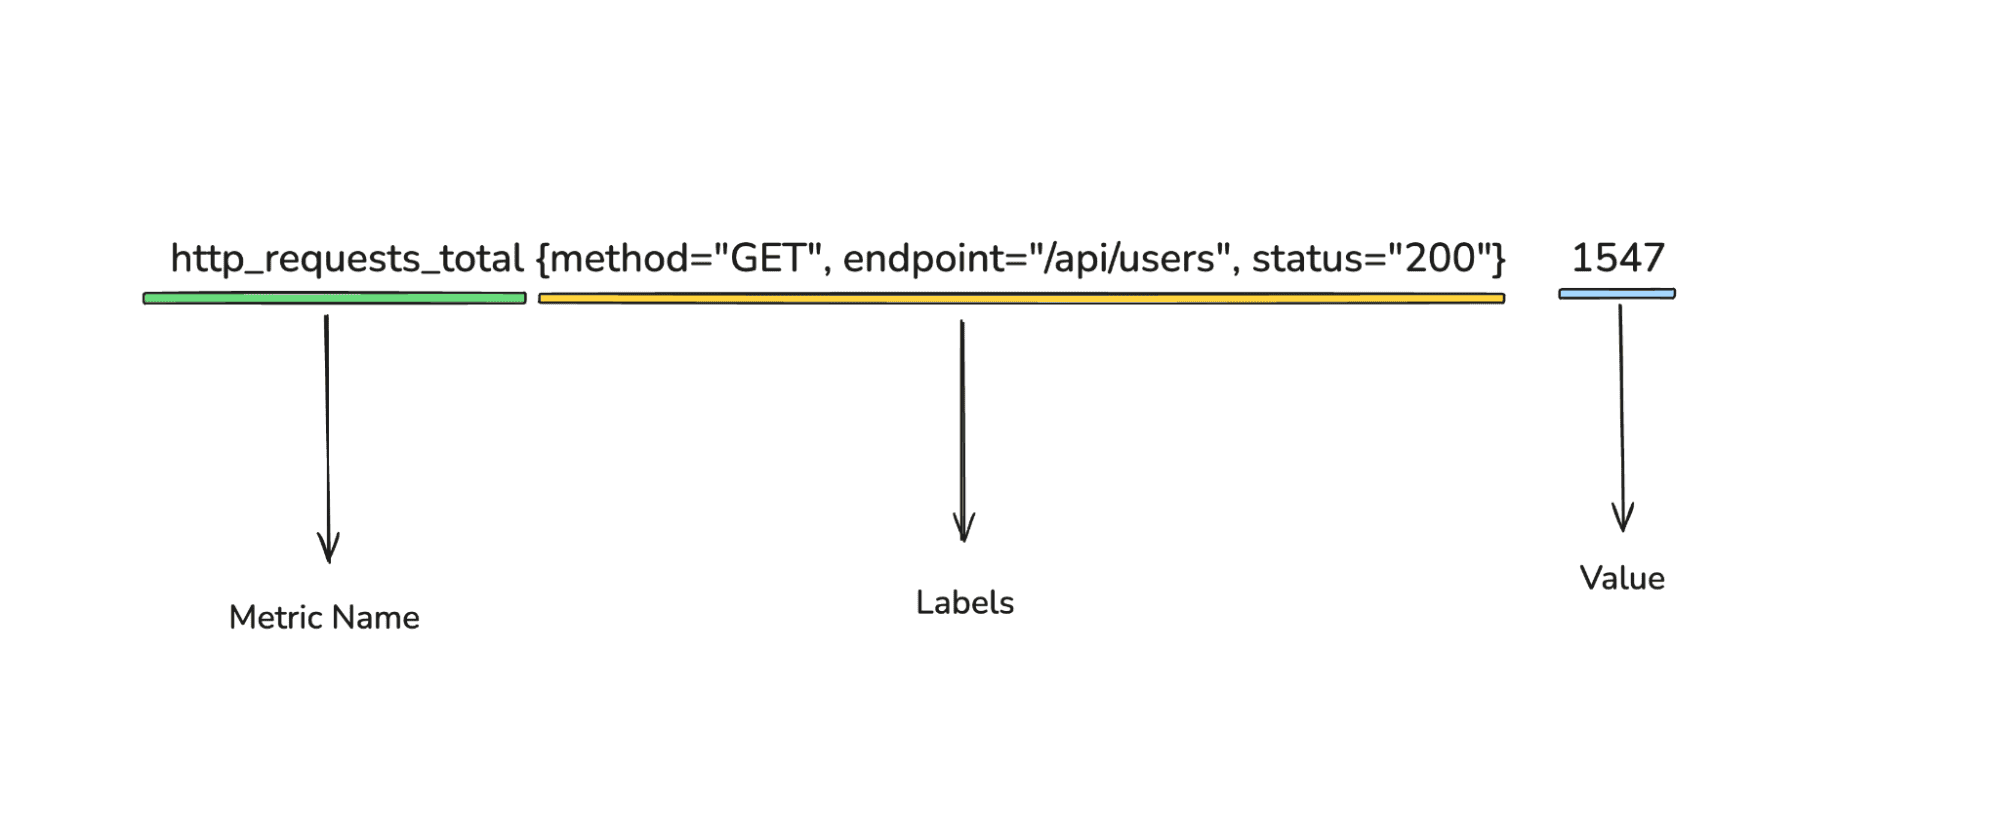
Key components:
- Metric name: What you're measuring (e.g.,
http_requests_total) - Labels: Dimensions that slice your data (e.g., method, endpoint, status)
- Value: The actual measurement
- Timestamp: When it was recorded
The 4 Prometheus Metric Types
Prometheus provides four fundamental metric types, each designed for specific use cases. Understanding these types is essential for effective instrumentation and monitoring.
1. Counter
A Counter is a metric that only increases over time (or resets to zero on restart). It’s perfect for tracking events that happen repeatedly, requests served, errors occurred, jobs processed, GC cycles, and so on.
2. Gauge
A Gauge is a metric type whose value can go up or down. It represents the current value of something in your system memory usage, pod count, queue depth, CPU temperature, etc.
3. Histogram
A Histogram measures the distribution of values by placing each observation into predefined buckets. It tracks:
- the count in each bucket
- the total number of observations
- the sum of all observed values
The most common use case is latency.
How histogram buckets work?
Suppose you define buckets: 0.3s, 0.5s, 0.7s, 1s, 1.2s, +Inf.
- If a request takes 0.25s, all buckets with a boundary ≥ 0.25 get incremented.
- If the next request takes 0.4s, buckets ≥ 0.4 increase again.
4. Summary
A Summary is similar to a histogram but computes quantiles client-side (inside your application). It exposes:
- total count
- total sum
- quantiles like p50, p90, p99
Limitations:
- Summaries cannot be aggregated across multiple instances.
- You lose the bucket-level visibility that histograms provide.
Because of this, Prometheus recommends using histograms over summaries unless you must calculate quantiles in-app and don’t care about aggregation.
Understanding what these metrics are is only the first step. The real value comes when you can query, visualize, and alert on them in a way that helps you answer real questions about your system’s health.
And that’s exactly where OpenObserve (O2) comes in.
Why OpenObserve for Prometheus Metrics?
Prometheus is great at scraping and storing metrics , but developers and SREs need:
- Fast, SQL/PromQL querying
- Unified views across logs, metrics, and traces
- Cost-efficient long-term retention
- Customizable, real-time dashboards
- Flexible alerting
OpenObserve gives you all of that on top of your Prometheus metric data, making it much easier to explore patterns, build dashboards, and set alerts without juggling multiple tools.
For detailed steps on OpenObserve and Prometheus integration check out this guide.
In short: Prometheus collects, OpenObserve powers everything beyond it.
Querying and Visualizing Prometheus Metrics in OpenObserve
Now that we understand the different Prometheus metric types and why OpenObserve is a great place to work with them, let's look at how to actually query and visualize these metrics inside OpenObserve.
You can query and visualize Prometheus metrics using standard SQL or using native PromQL whichever your team prefers.
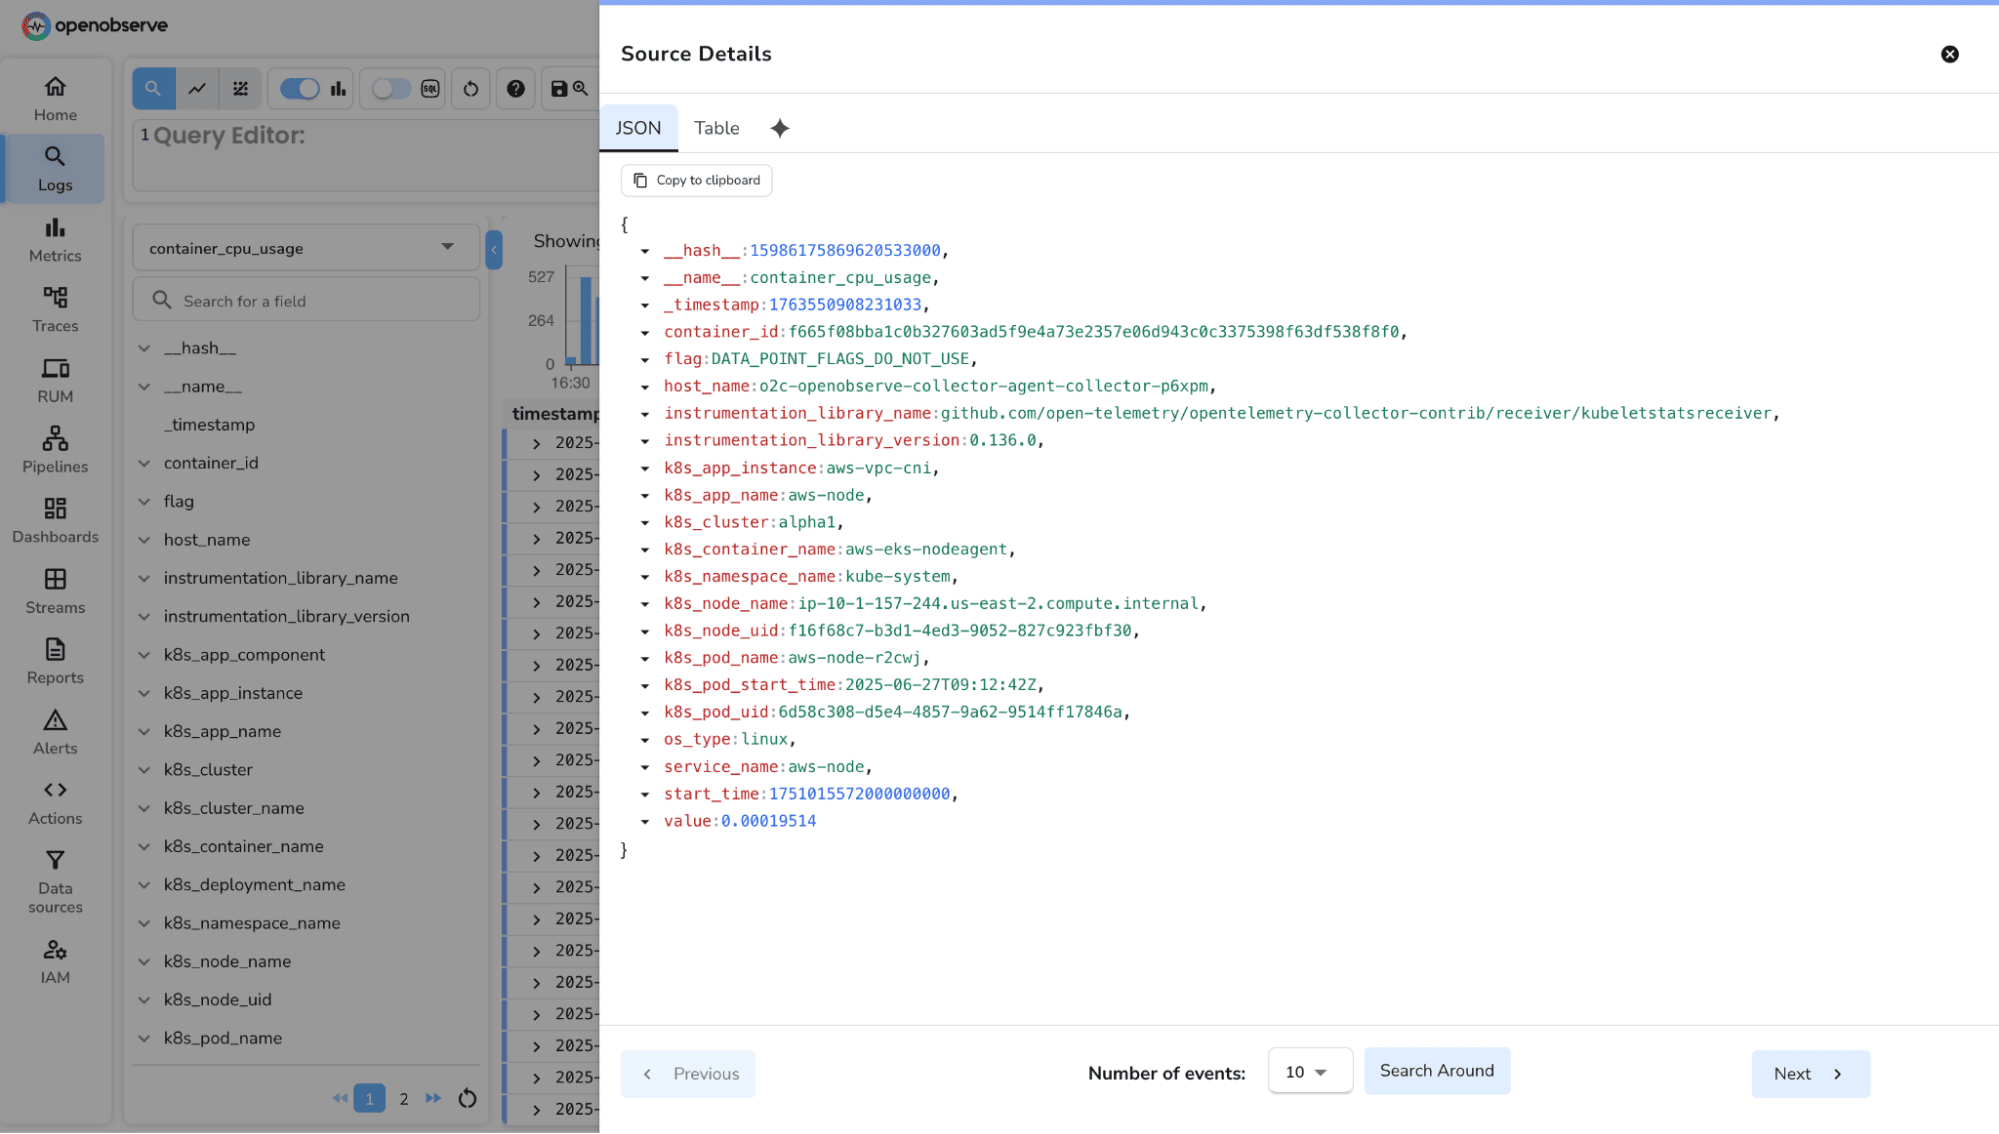
How Prometheus Metrics Look Inside OpenObserve
When Prometheus metrics are ingested into O2, each sample becomes a row with:
metric→ name of the metric (e.g.,http_requests_total)value→ the metric’s numeric valuetimestamp→ time of ingestionlabels→ flattened key–value tags (e.g.,method,status,service,job)type→ counter, gauge, histogram_bucket, etc.
Common Visualizations for Counter Metrics
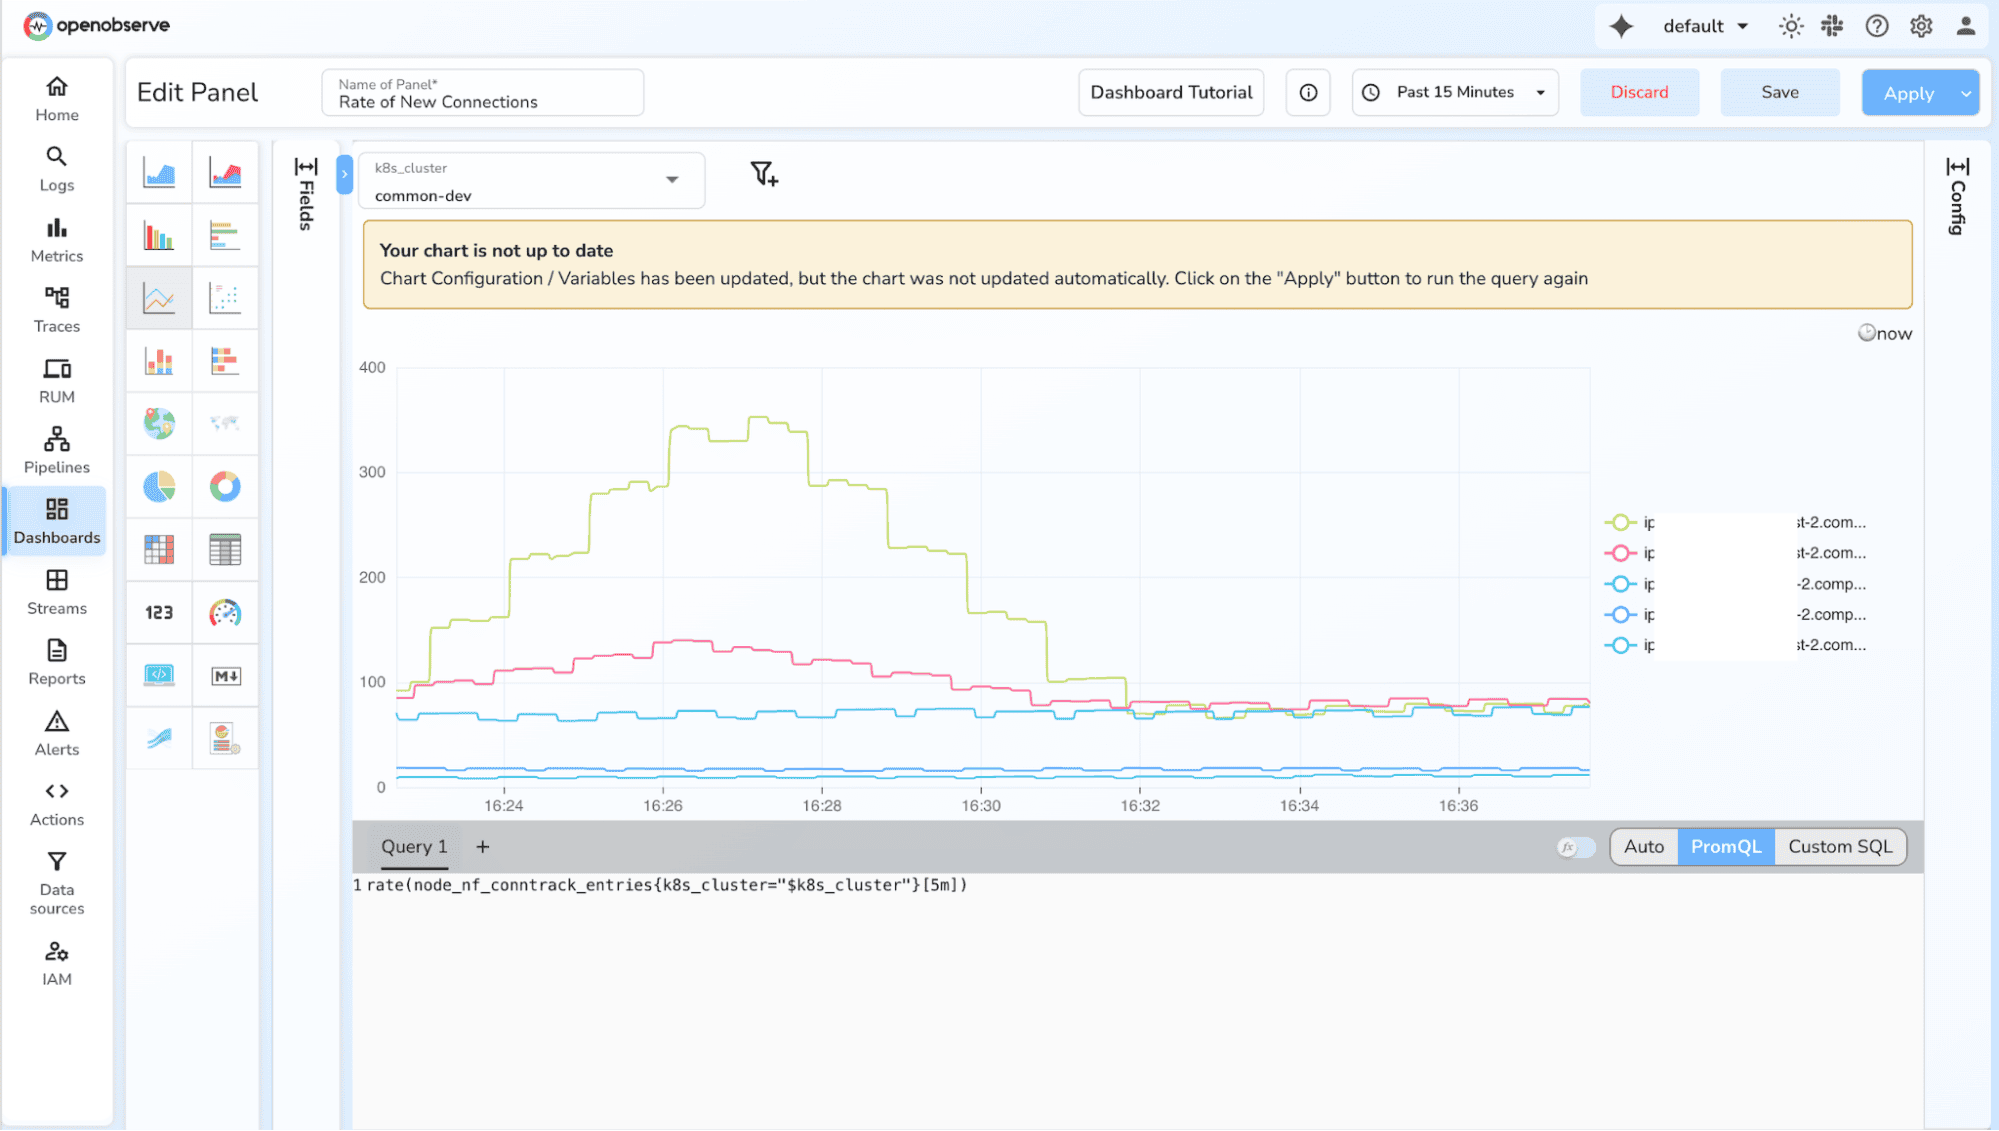
1. Rate (per-second speed of increase)
- Understand request throughput or event velocity
- Example Query:
rate(http_requests_total[1m])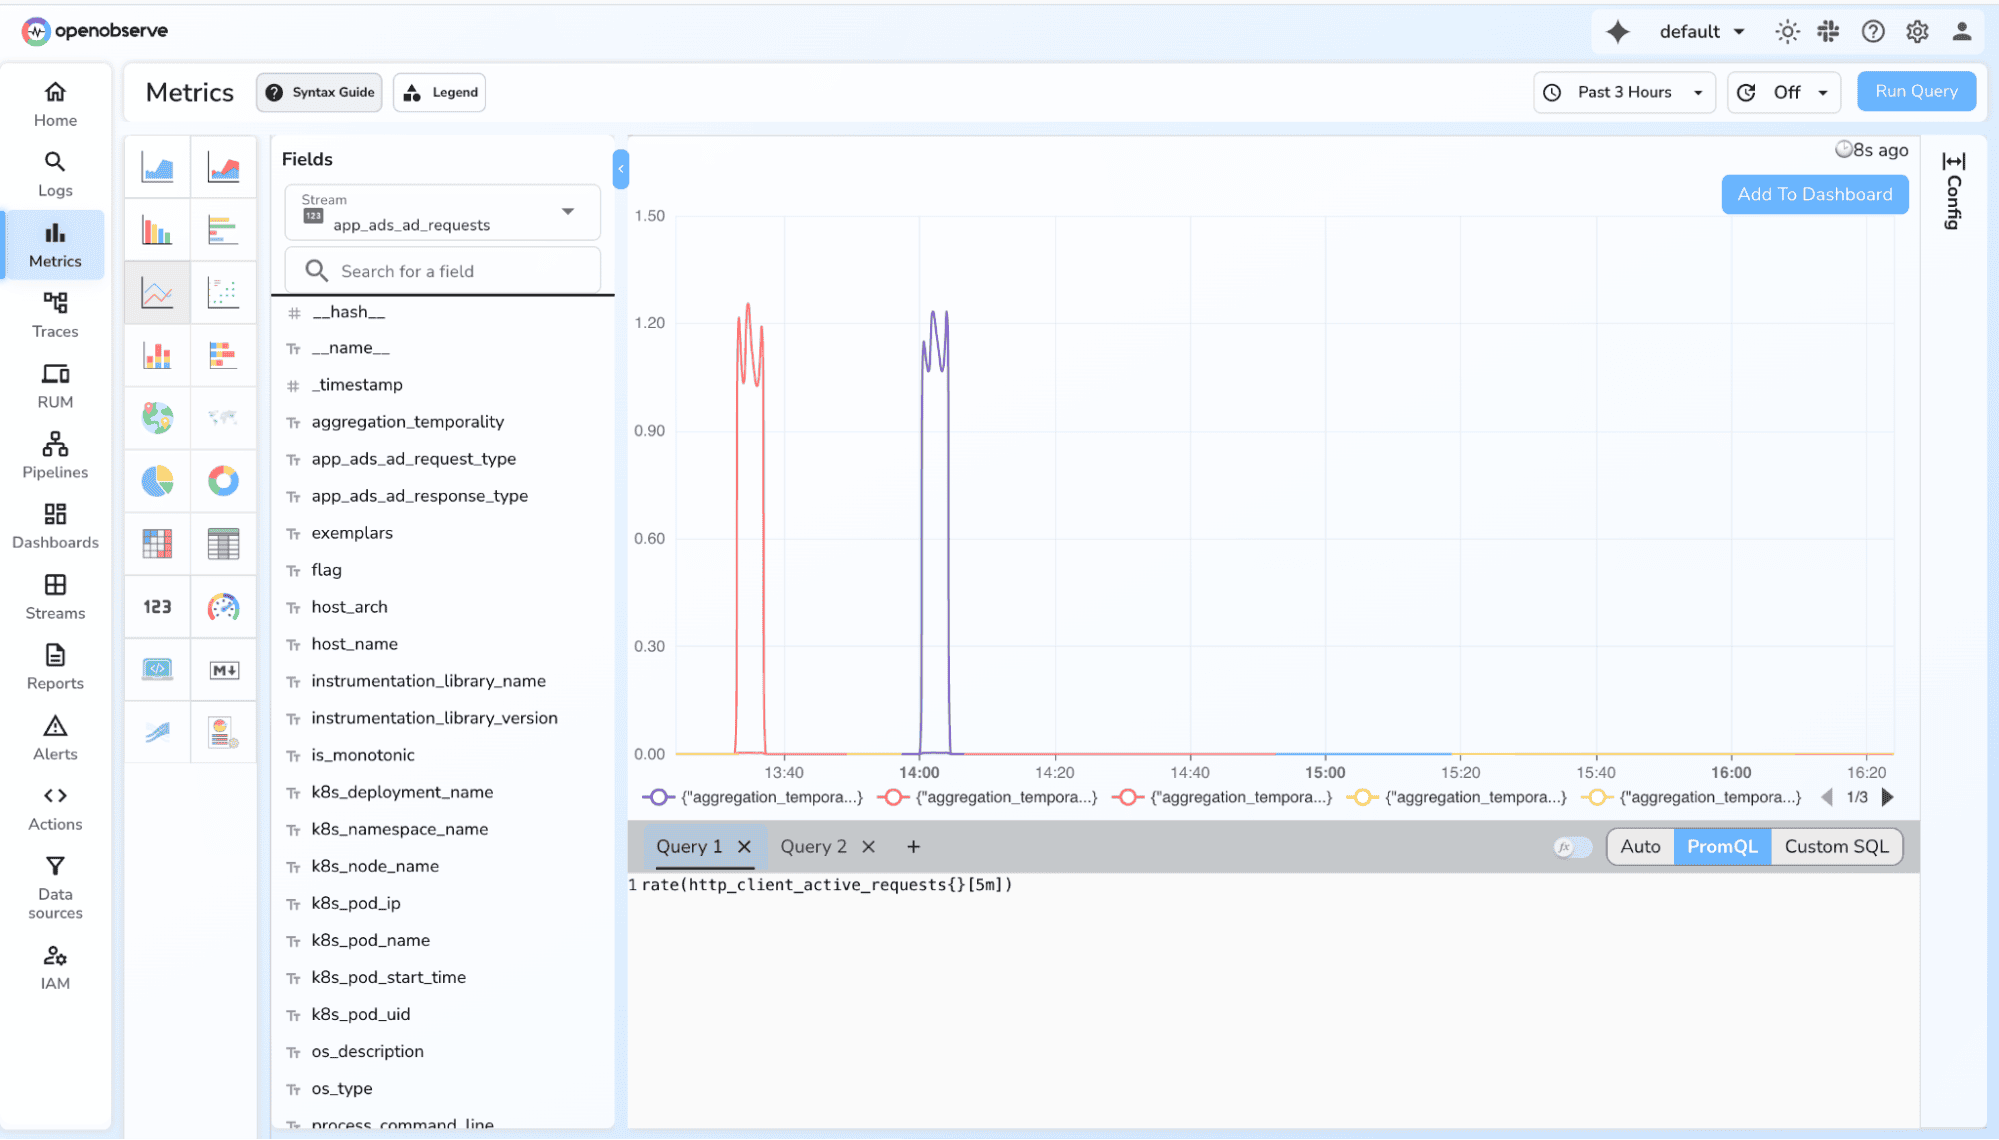
2. Increase over a window
- How many events happened in the last X minutes (restart-safe)
- Example Query:
increase(http_requests_total[5m])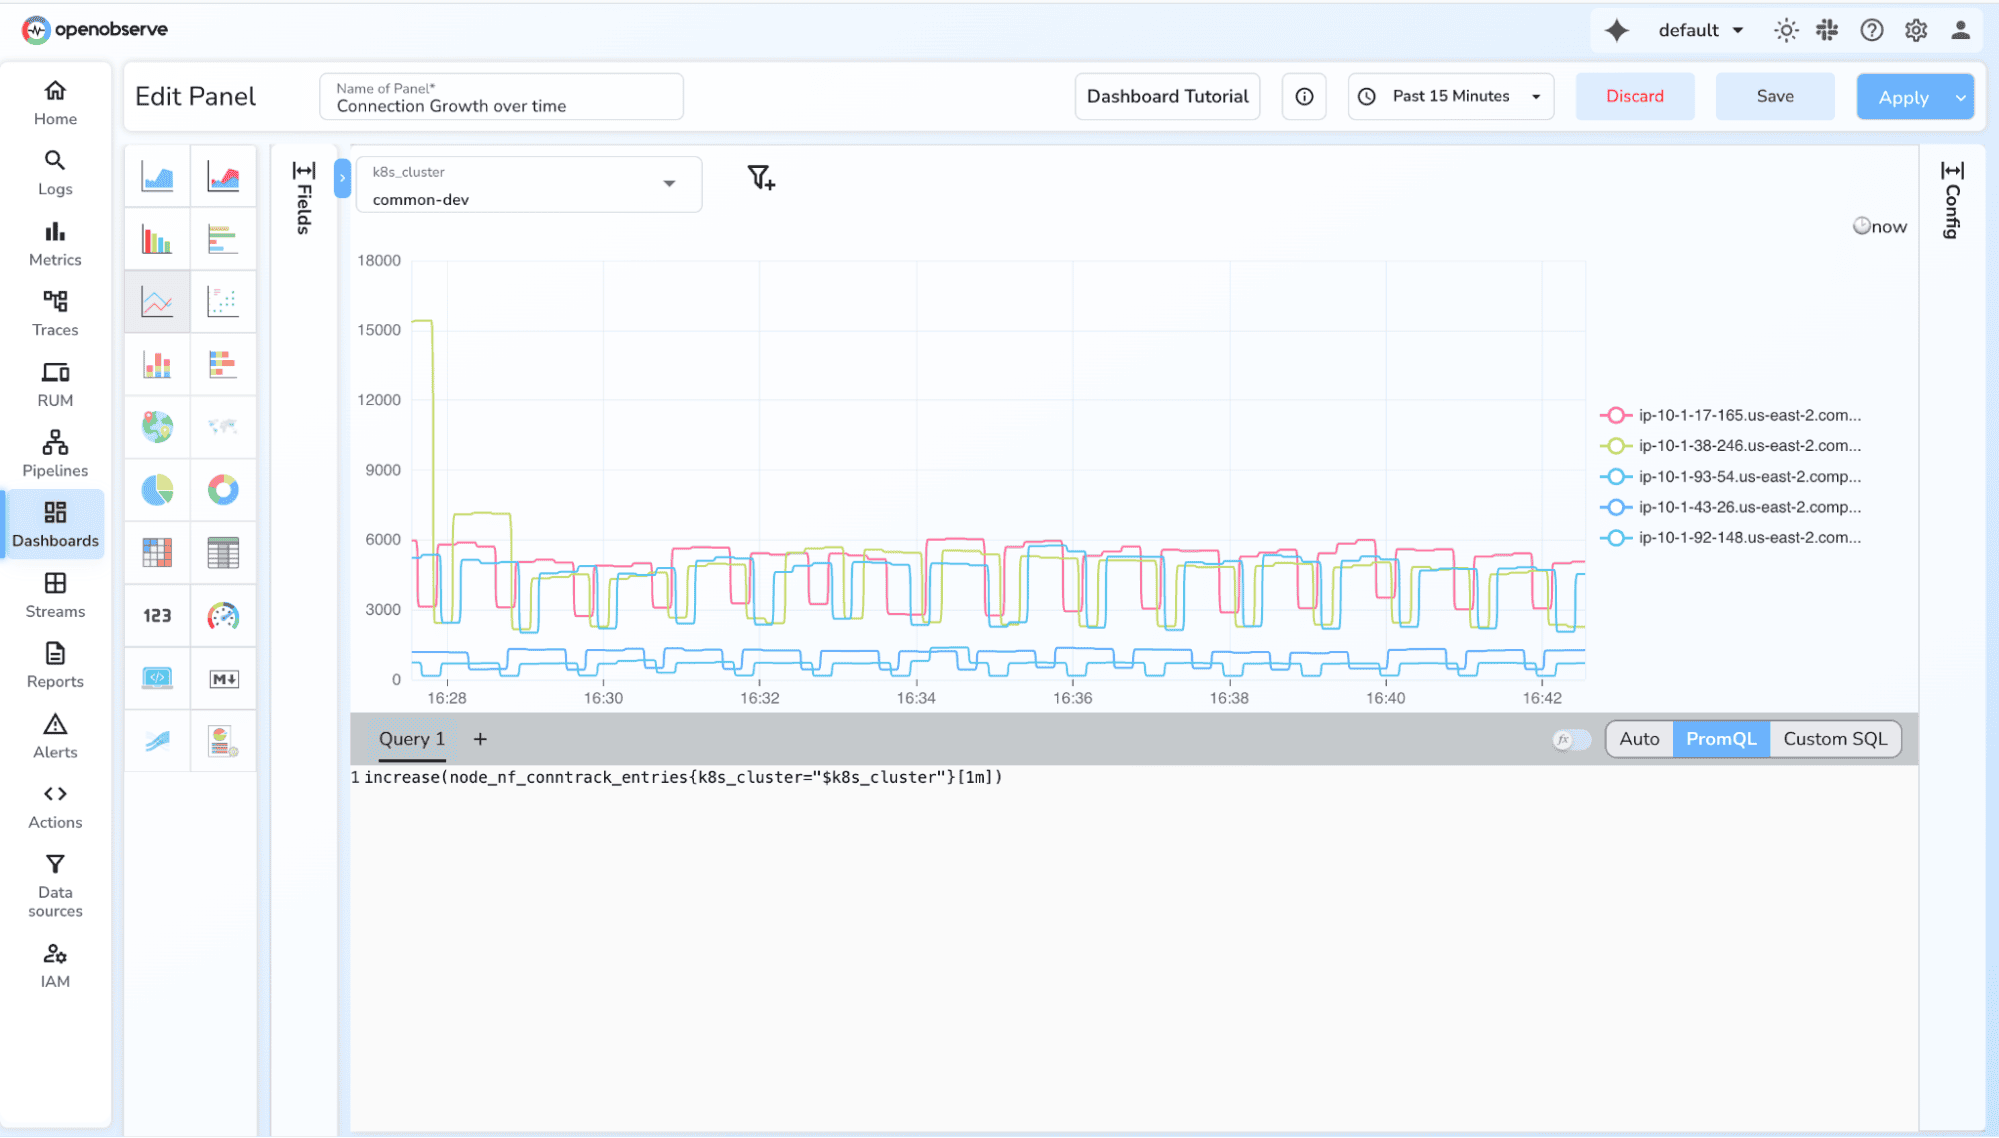
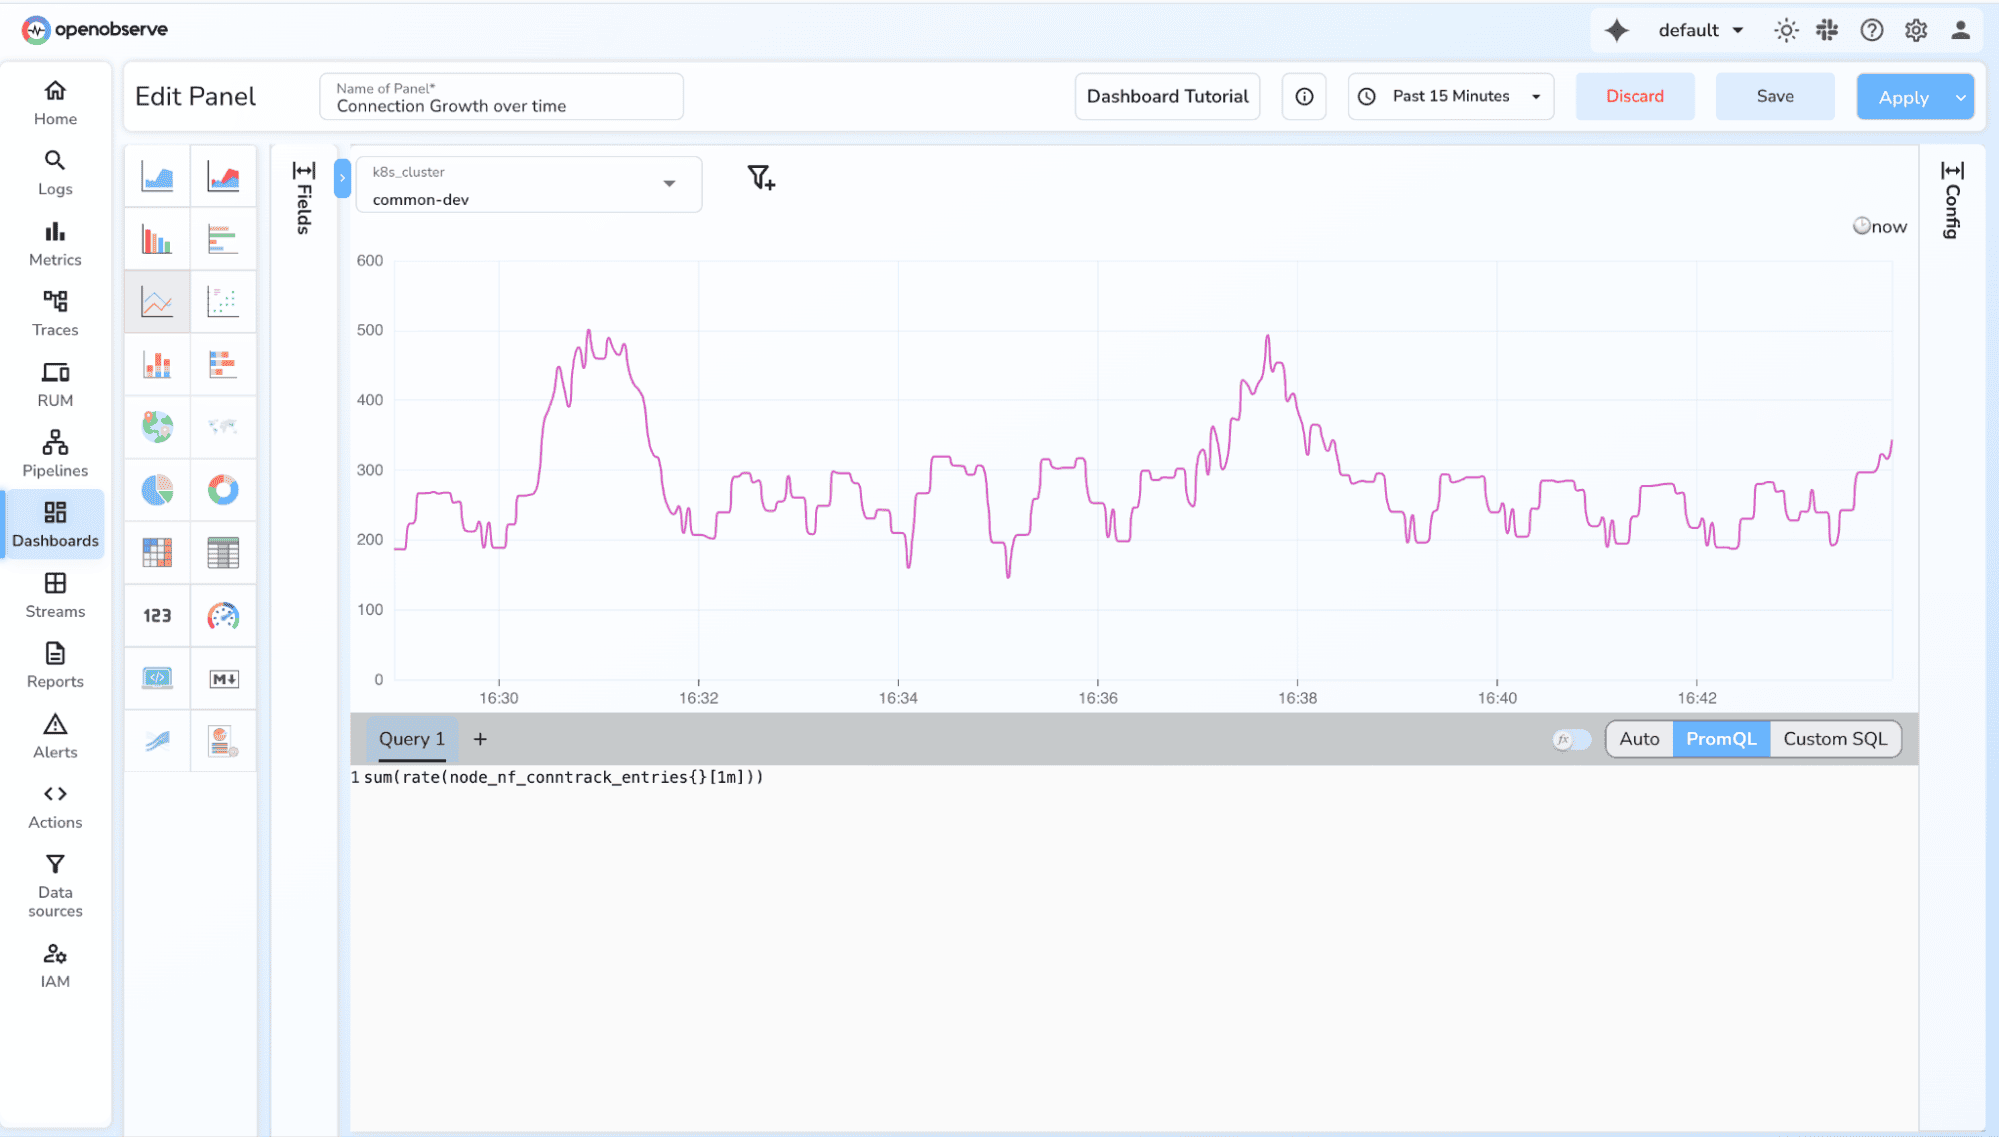
3. Total throughput
- Why: System-wide requests per second
- Example Query:
sum(rate(http_requests_total[1m]))
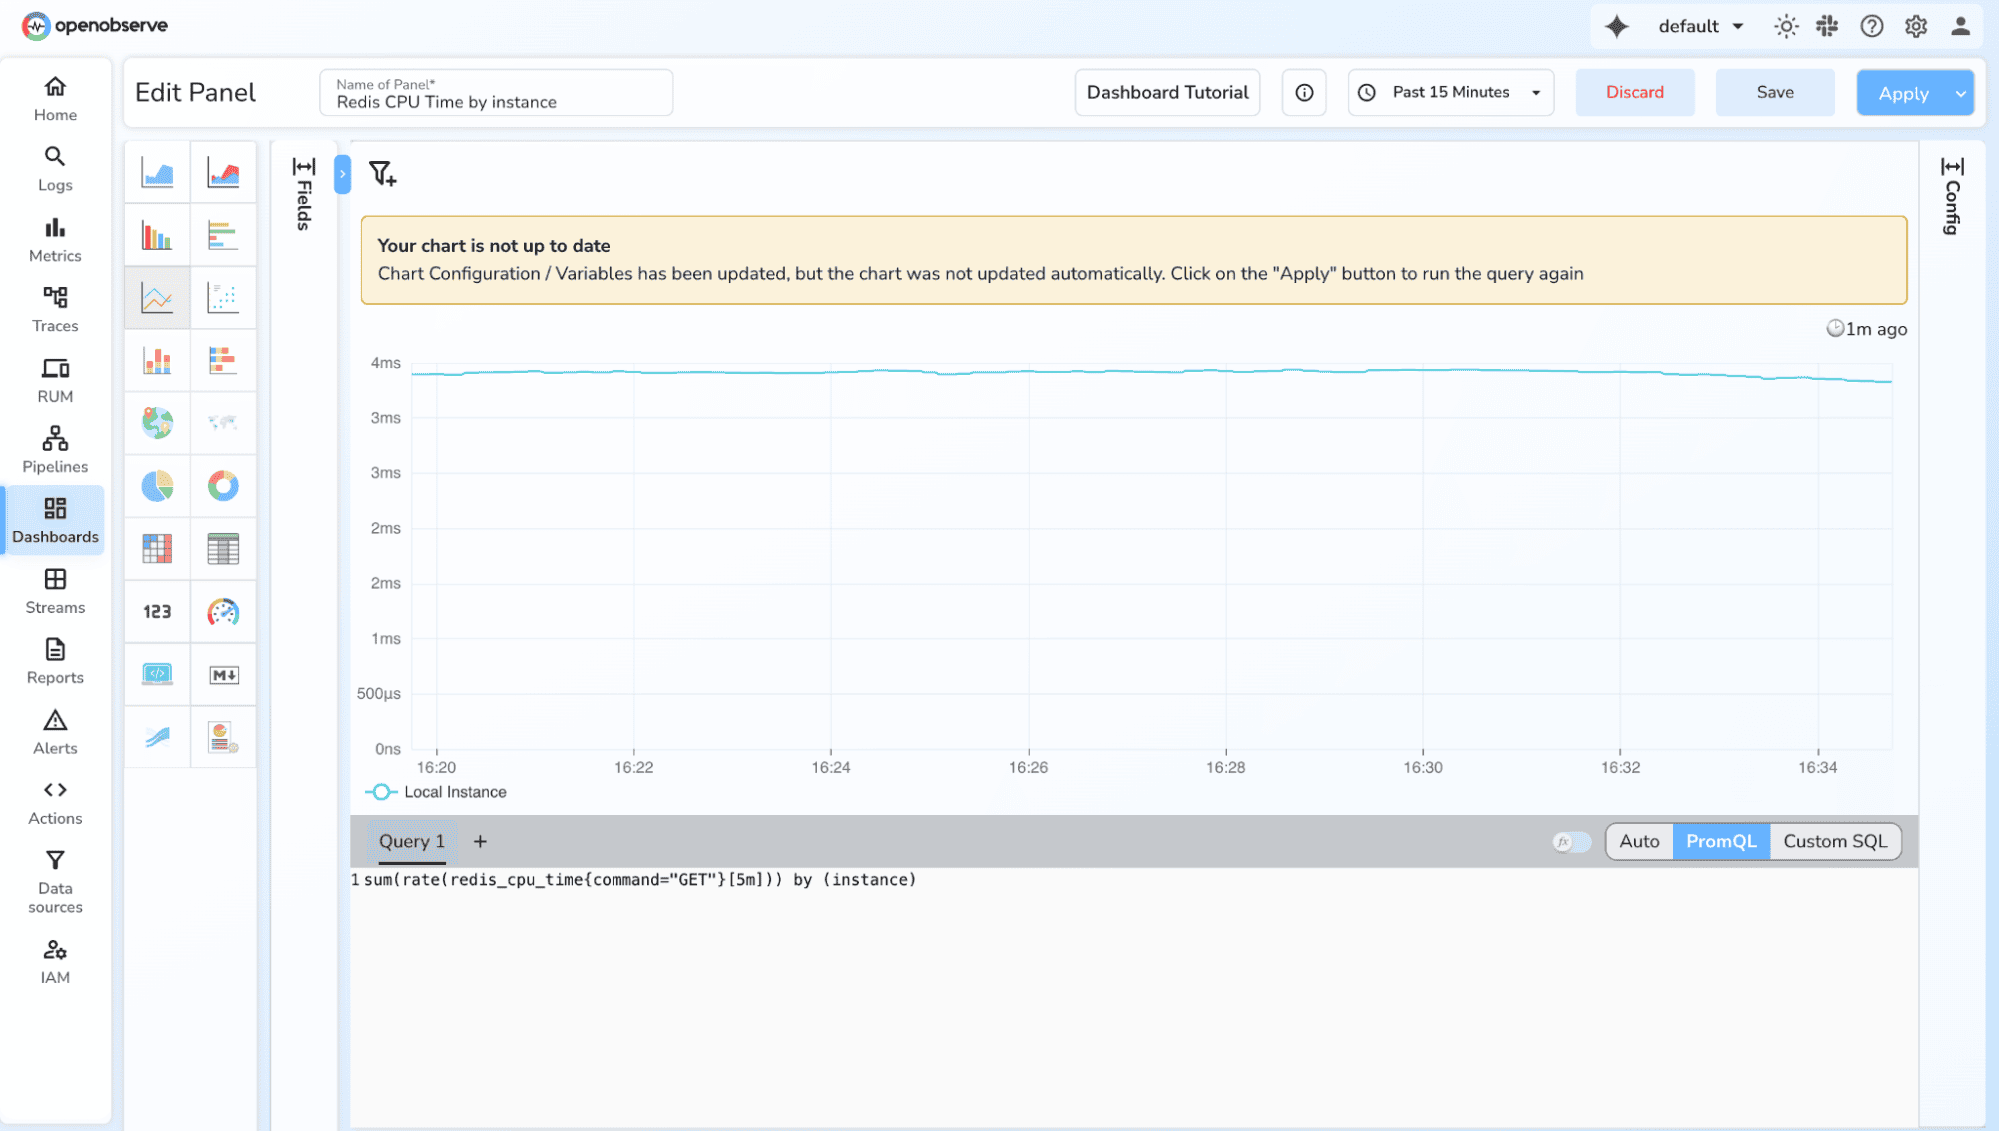
4. Breakdown by label (method, status, service)
- Why: Diagnose behavior per dimension
- Example Query:
sum(rate(http_requests_total[1m])) by (status)
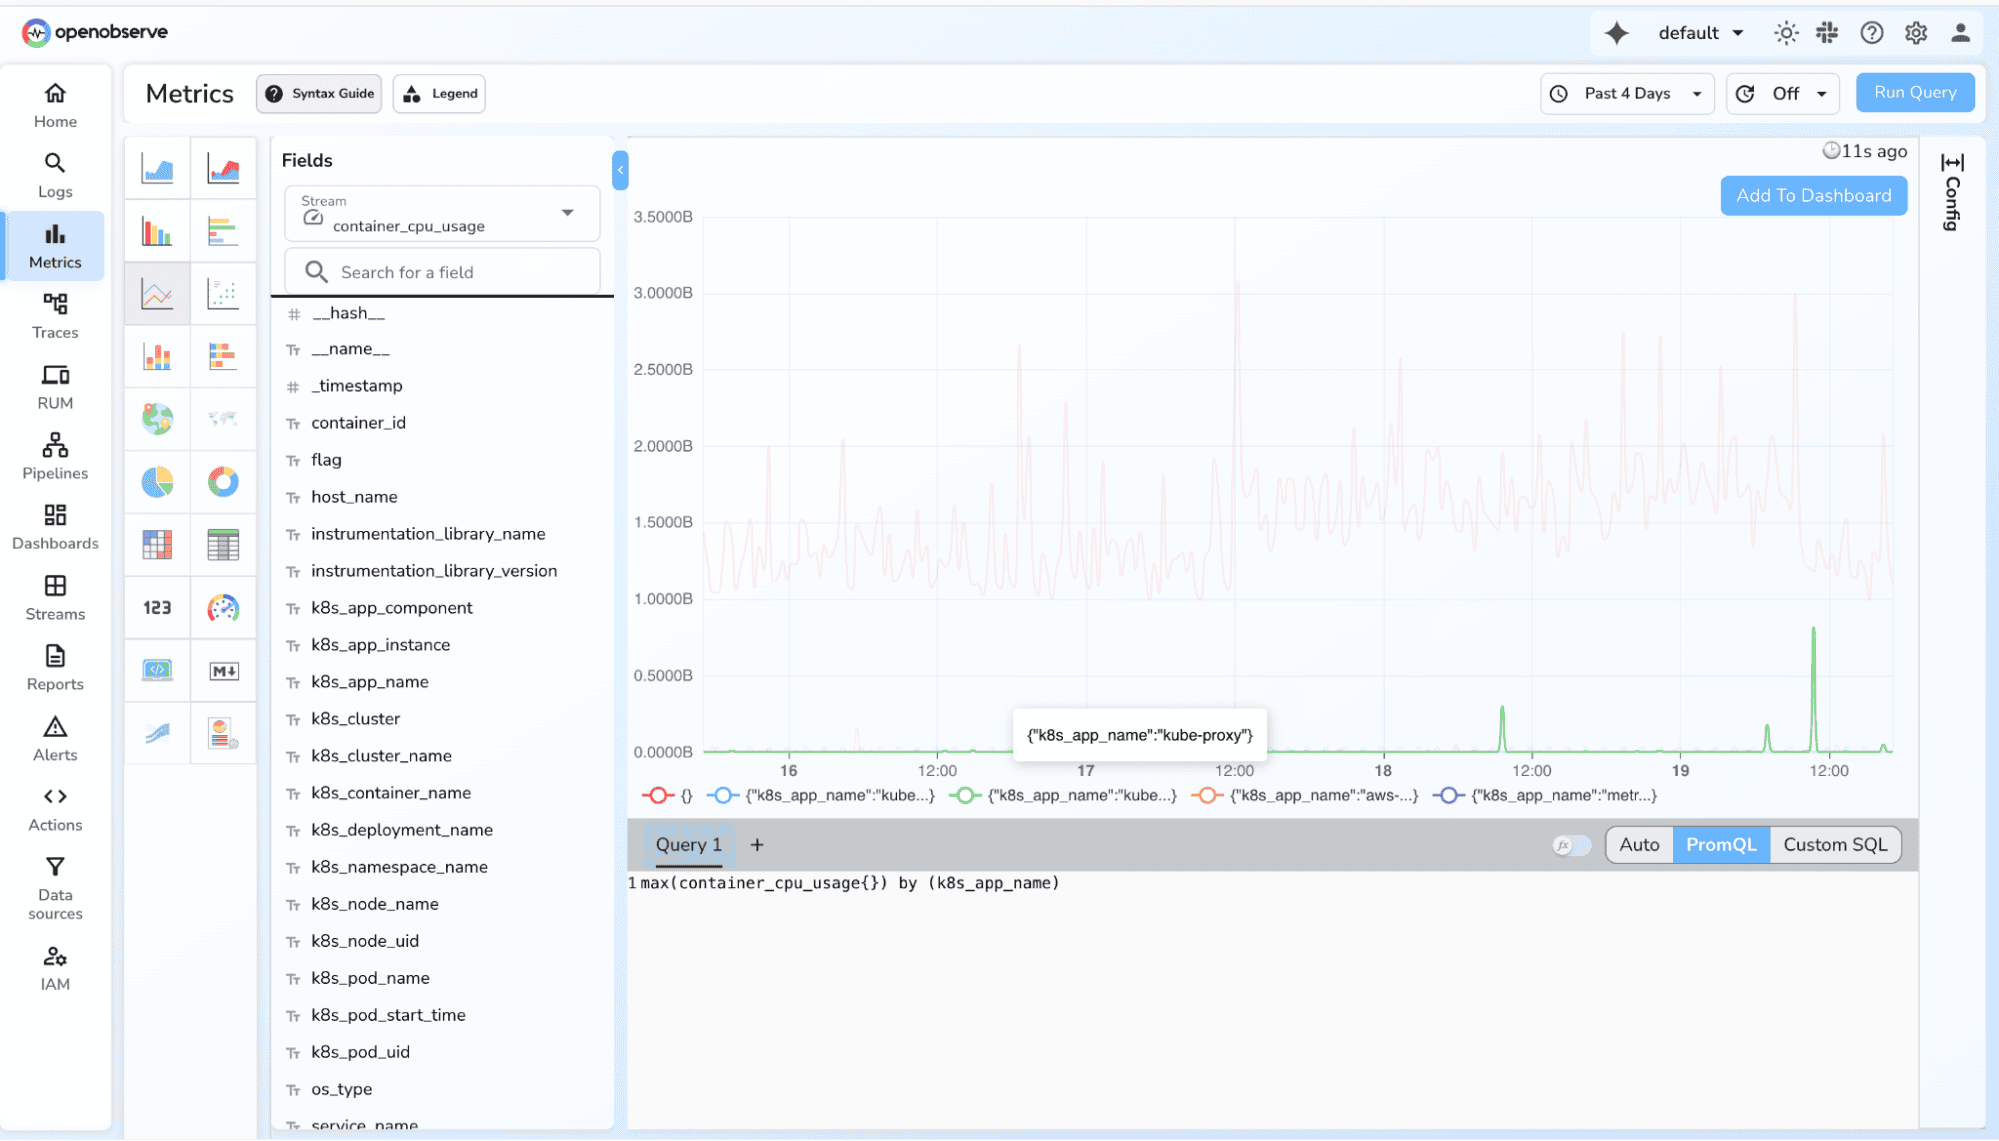
Common Visualizations for Gauge Metrics
Gauge values can go up or down, so queries focus on current state, min/max, average, trends.
- Latest value
- Why: Check current usage or level
- Example Query:
memory_usage_bytes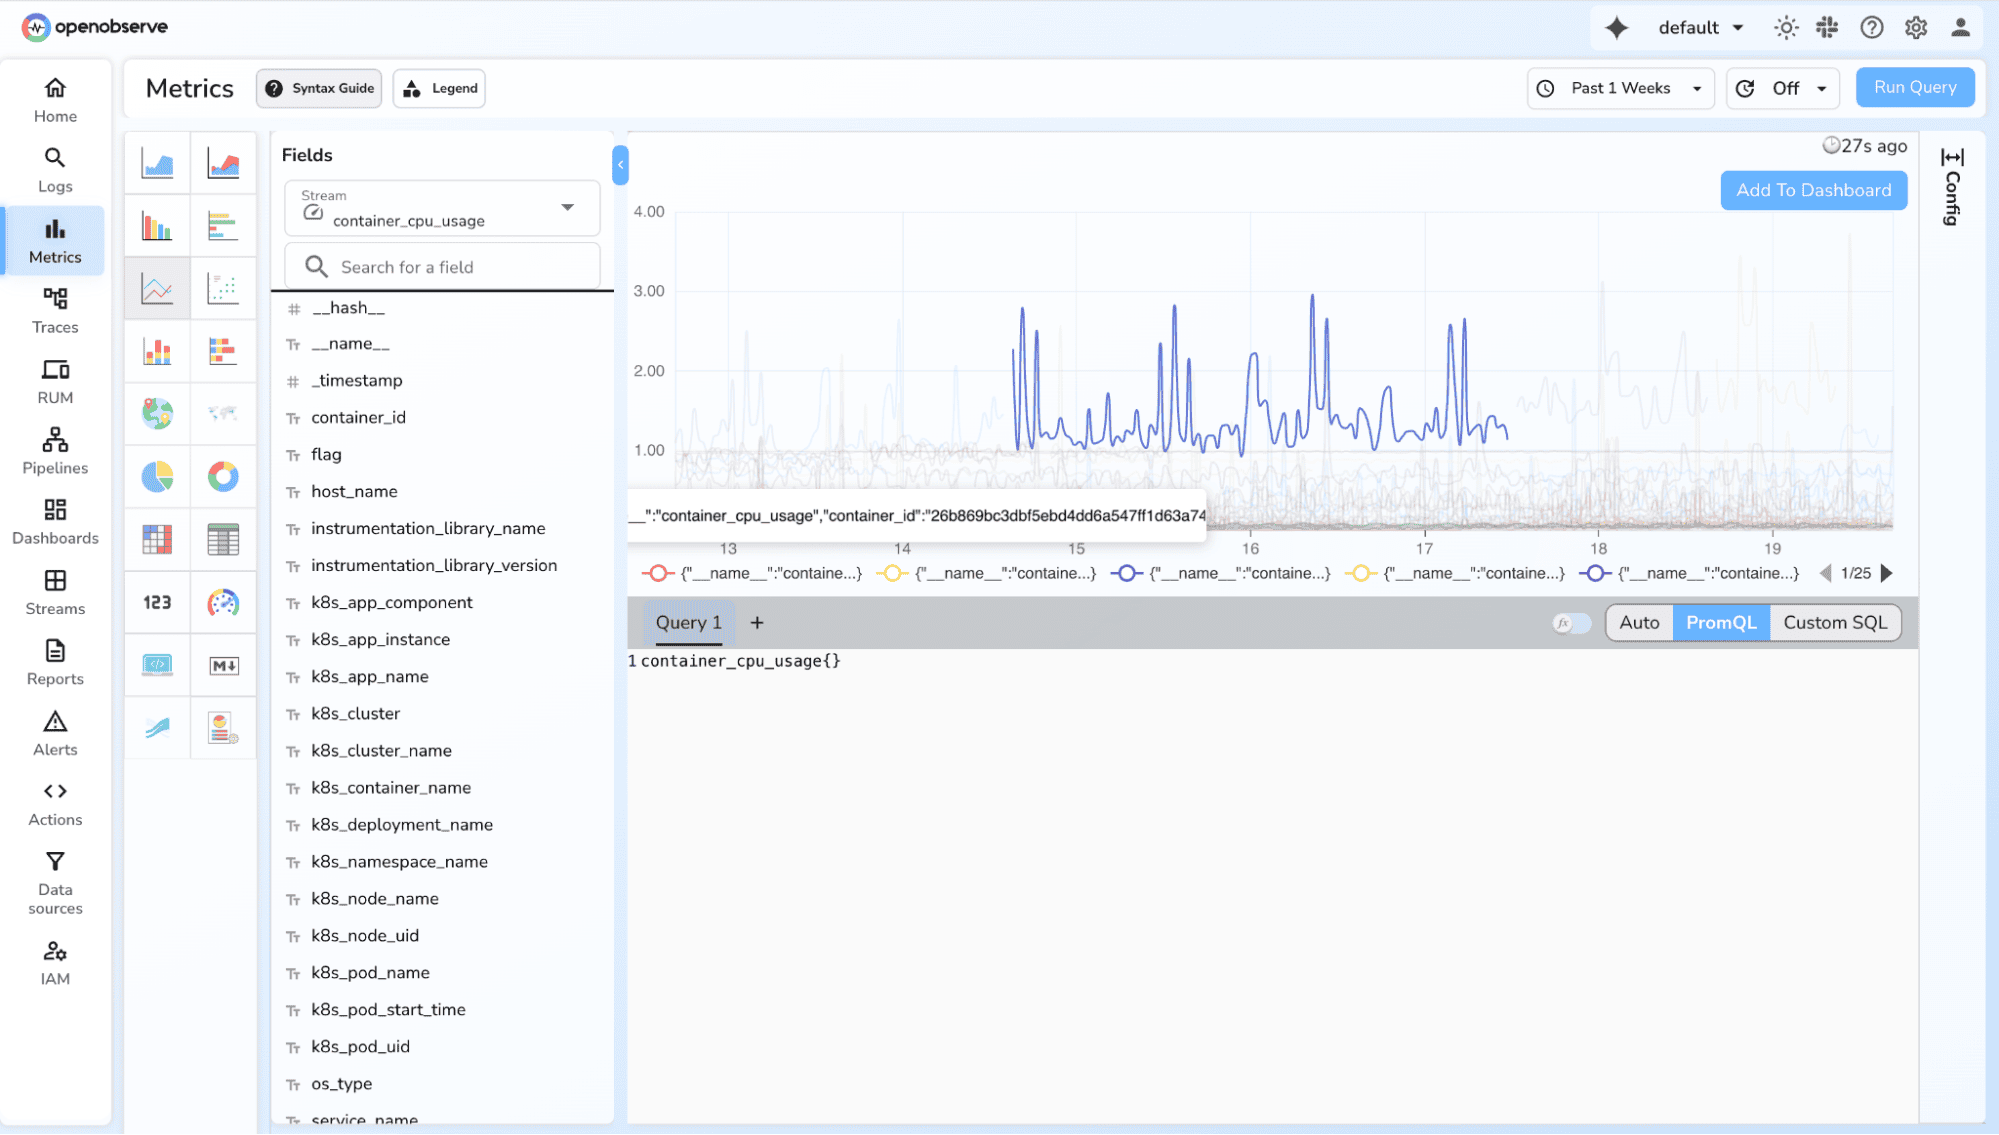
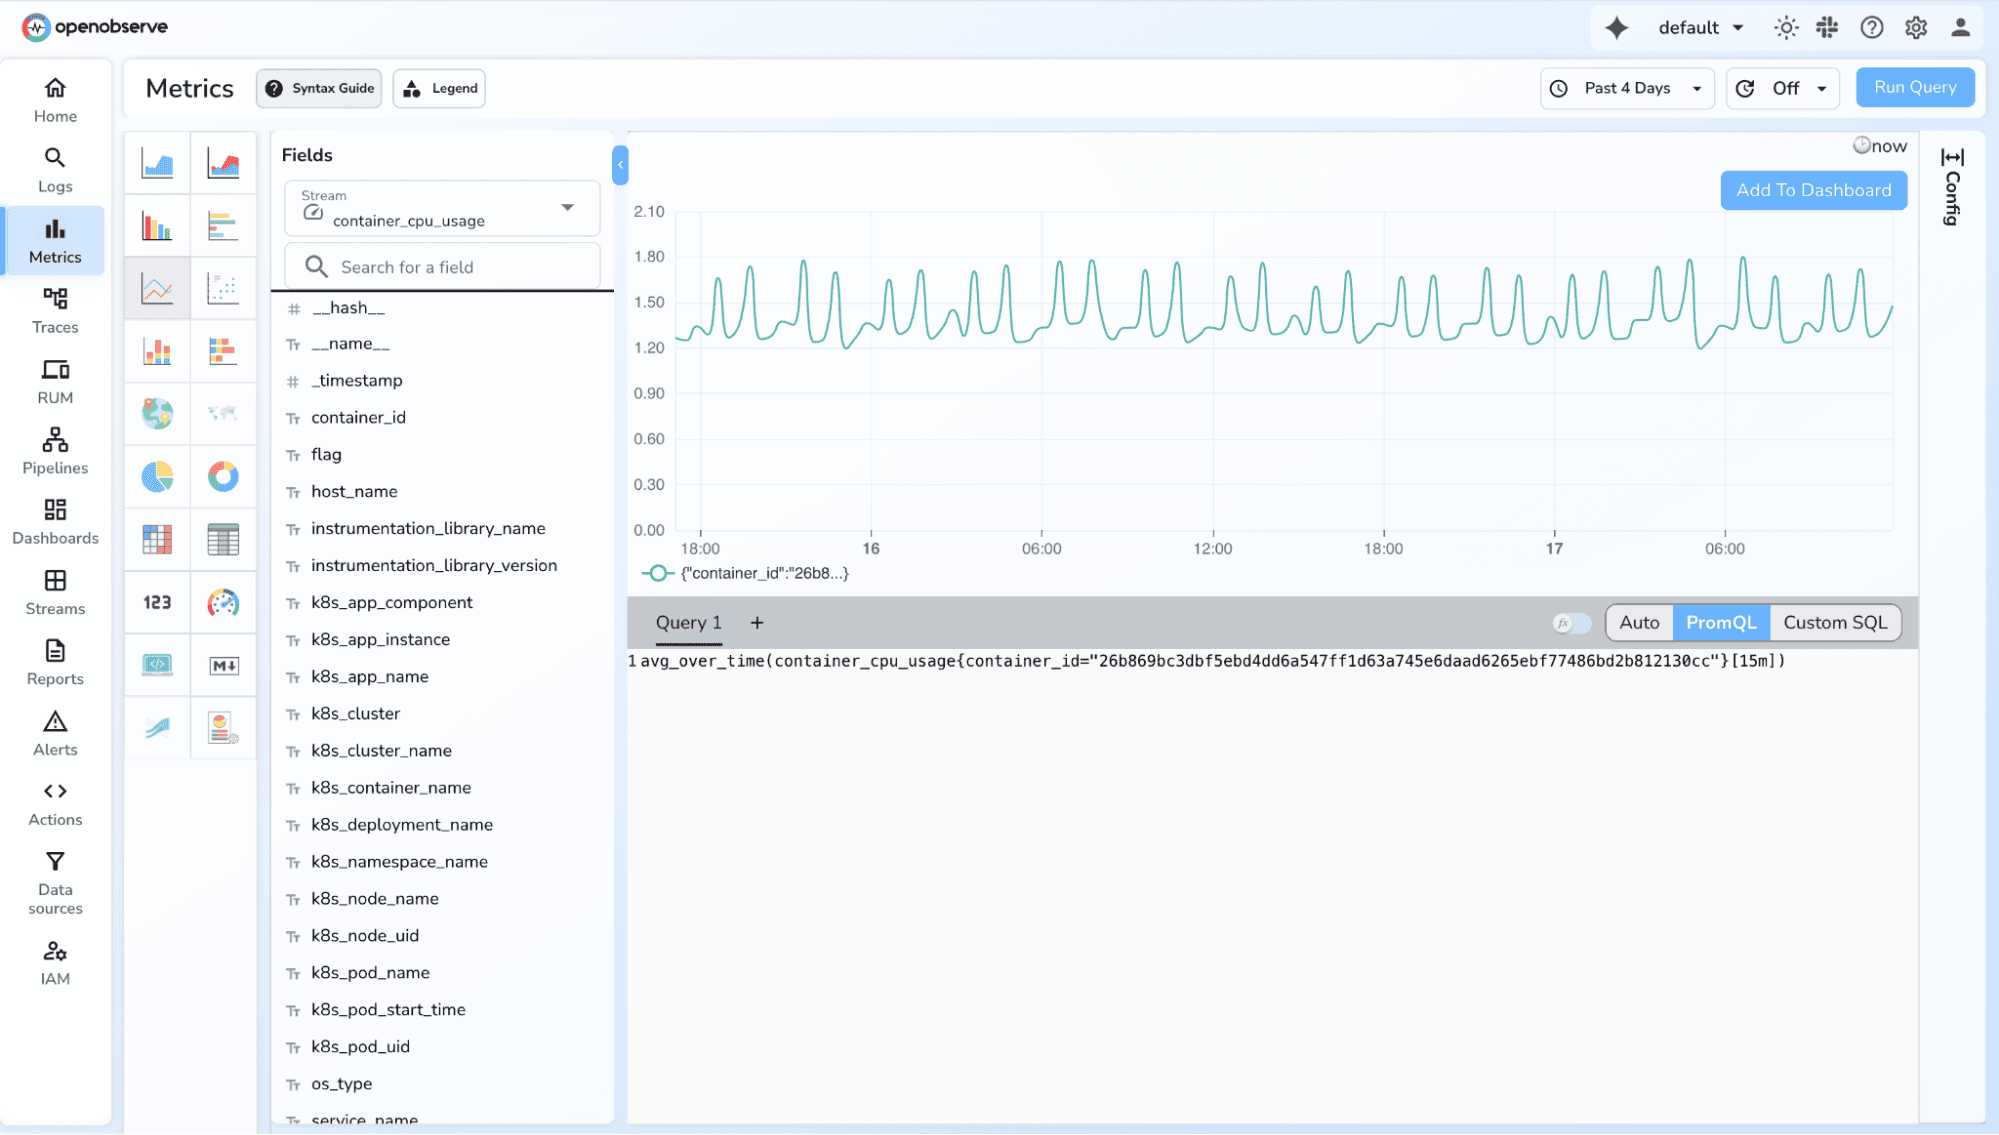
2. Average over time
- Why: Smooth noisy gauges
- Example Query:
avg_over_time(memory_usage_bytes[5m])
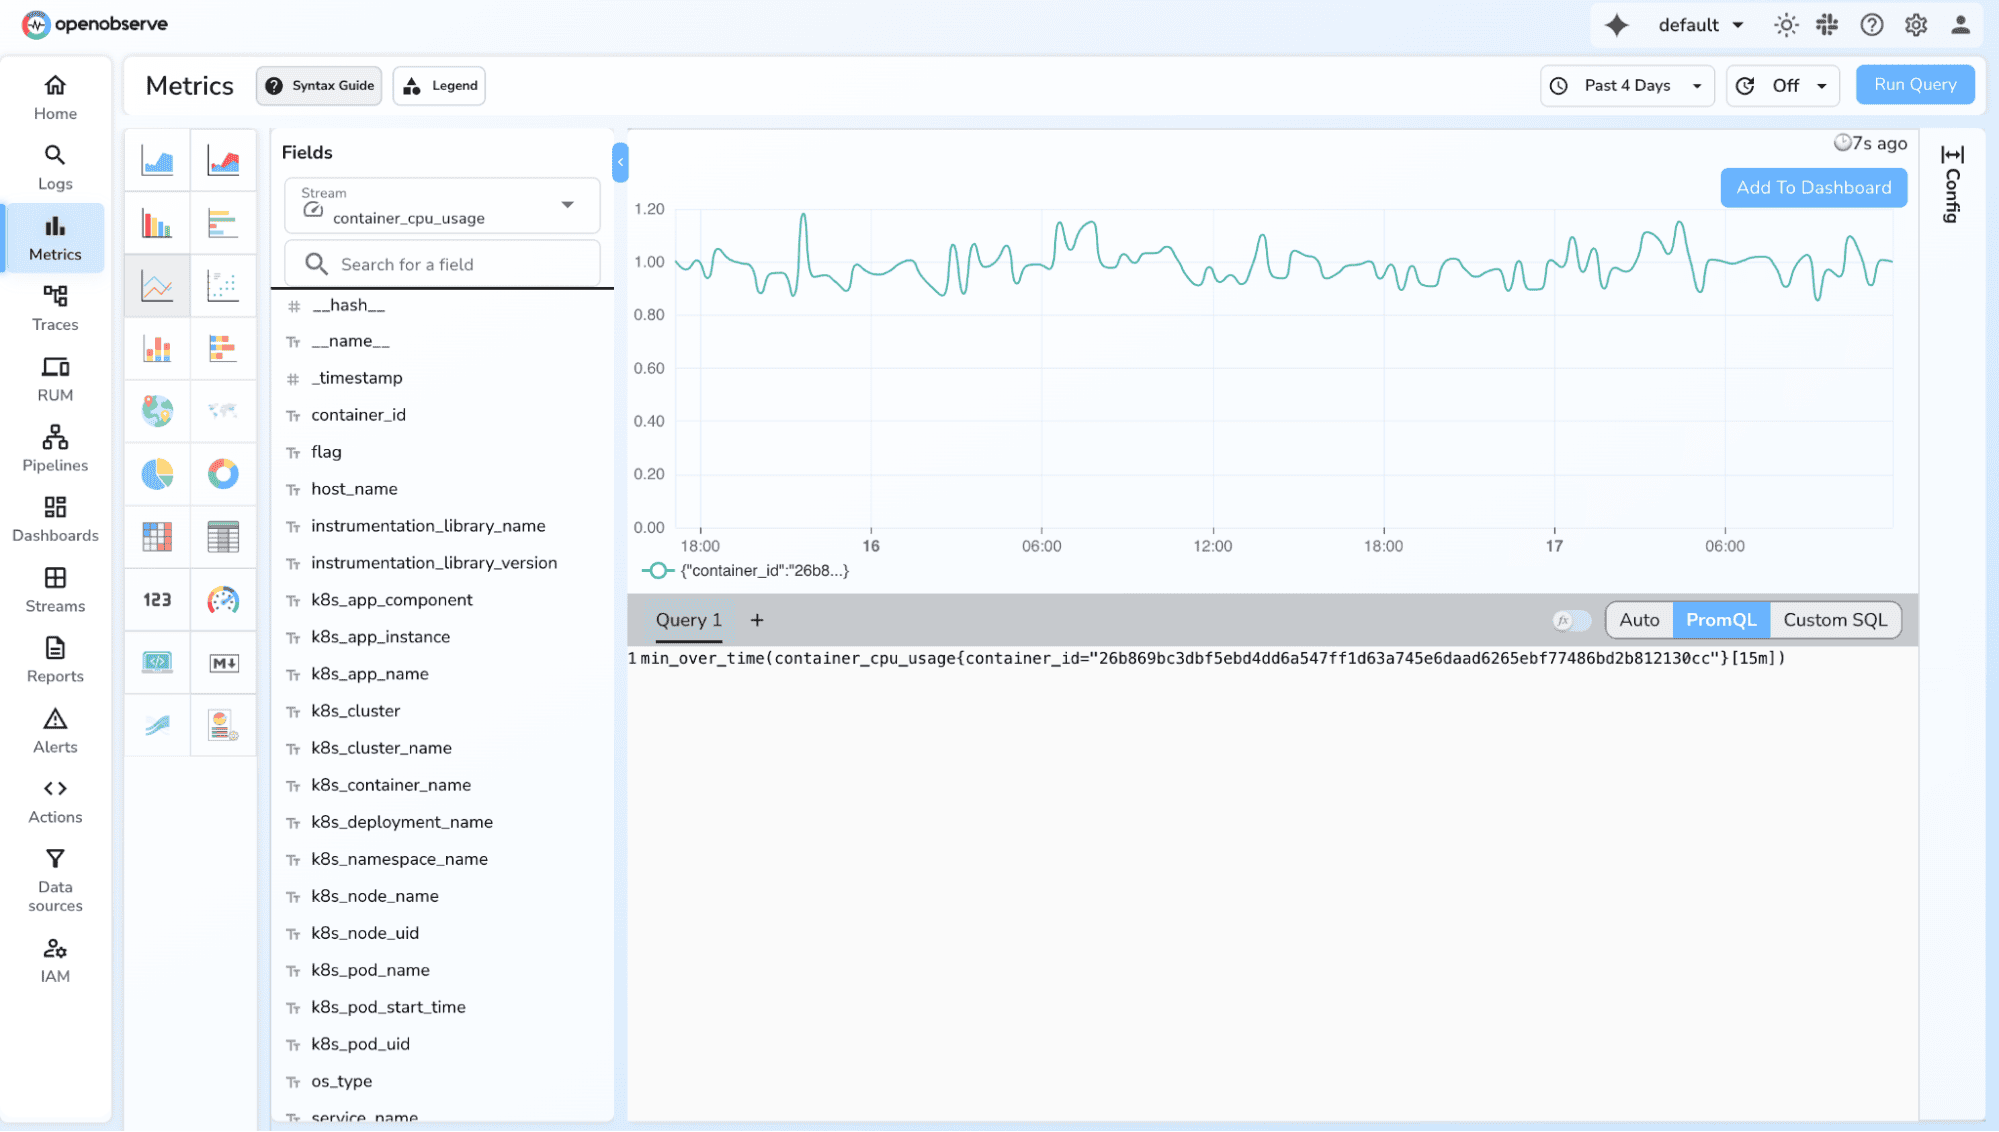
3. Minimum/maximum over a period
- Why: Detect spikes or drops
- Example Query:
max_over_time(queue_depth[10m])min_over_time(queue_depth[10m])
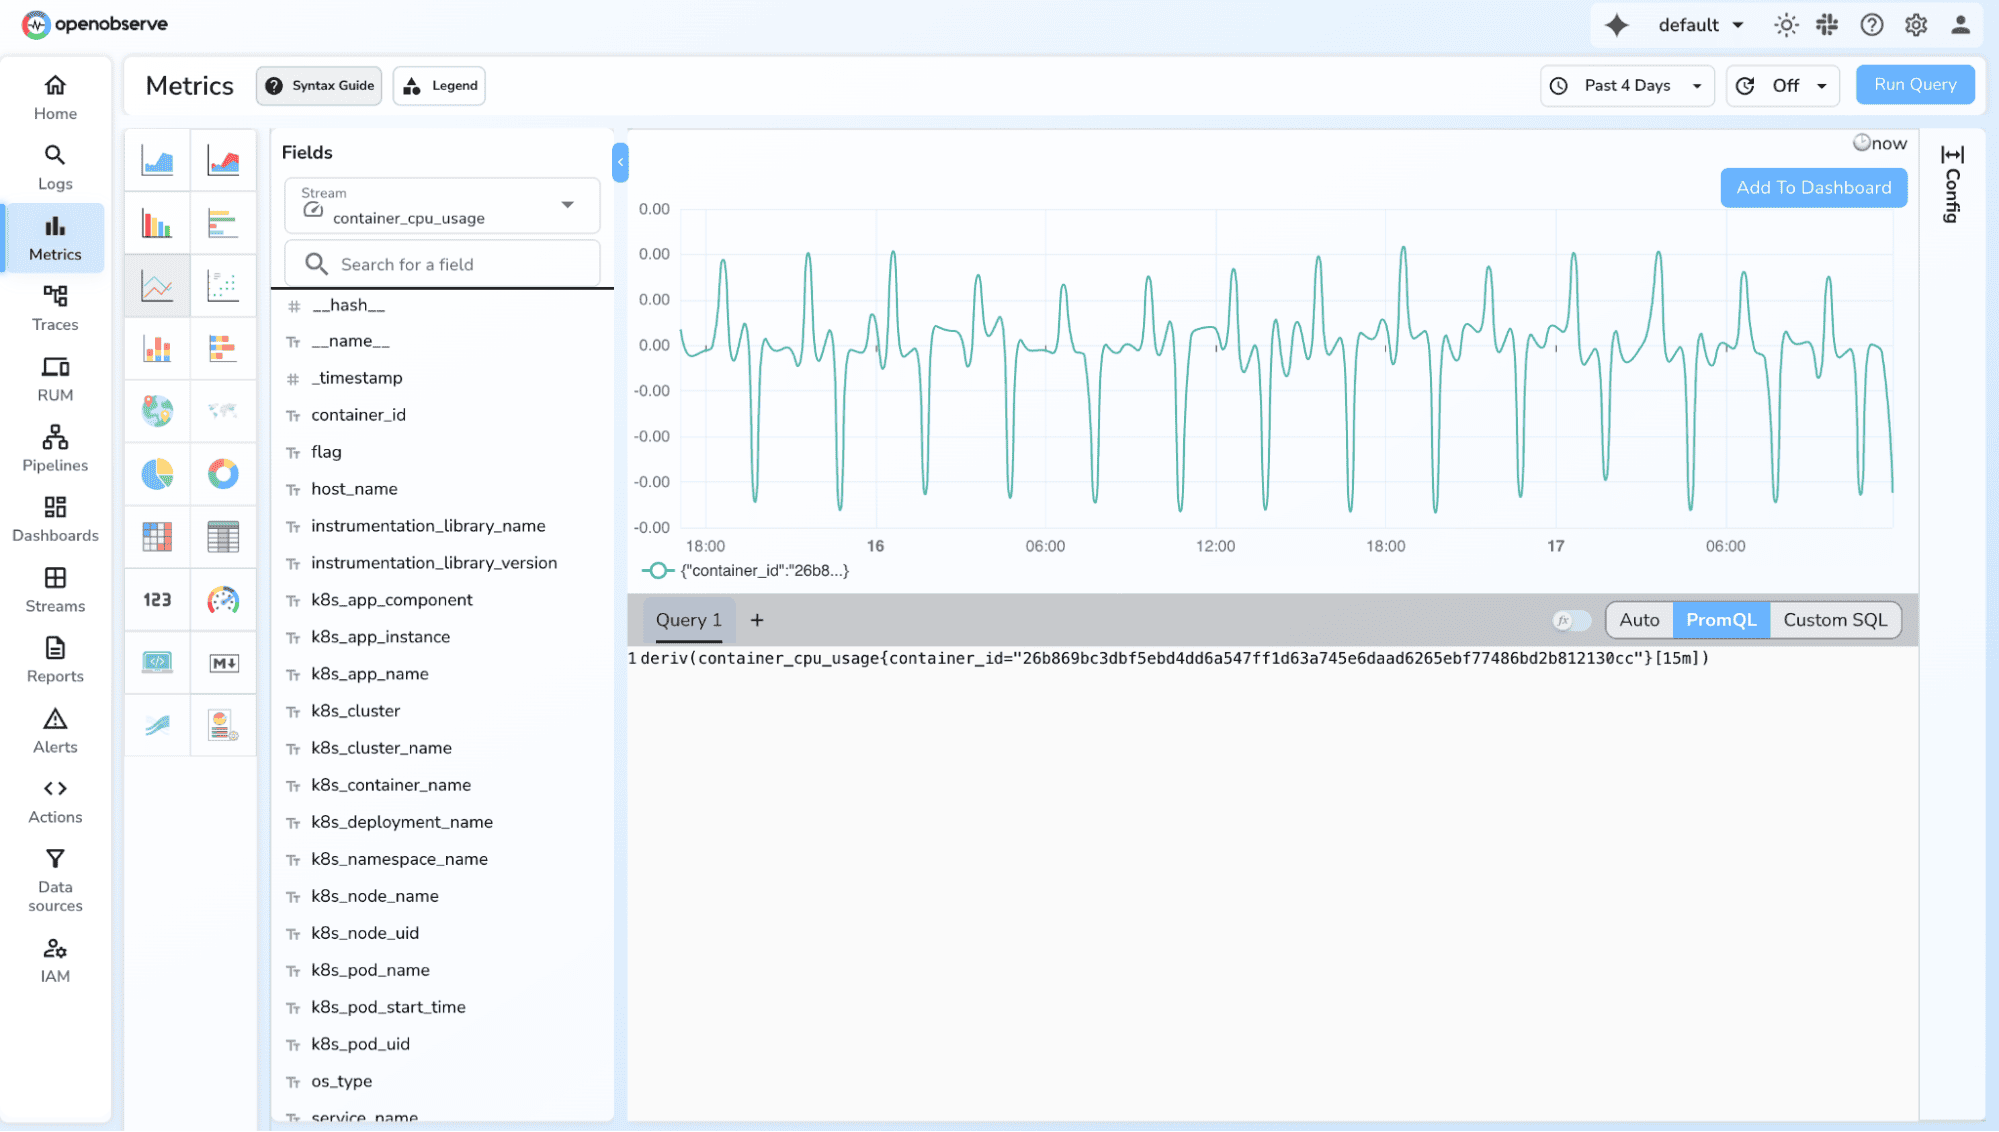
4. Derivative (rate of change)
- Why: Spot rapid growth (e.g., memory leaks)
- Example Query:
deriv(memory_usage_bytes[5m])
5. Grouped distribution
- Why: Identify hotspots
- Example Query:
max(memory_usage_bytes) by (instance)
Common Visualizations for Histogram Metrics
Histogram metrics expose bucket counts, sum, and count, making them ideal for analyzing latency, size distributions, and duration-based performance.
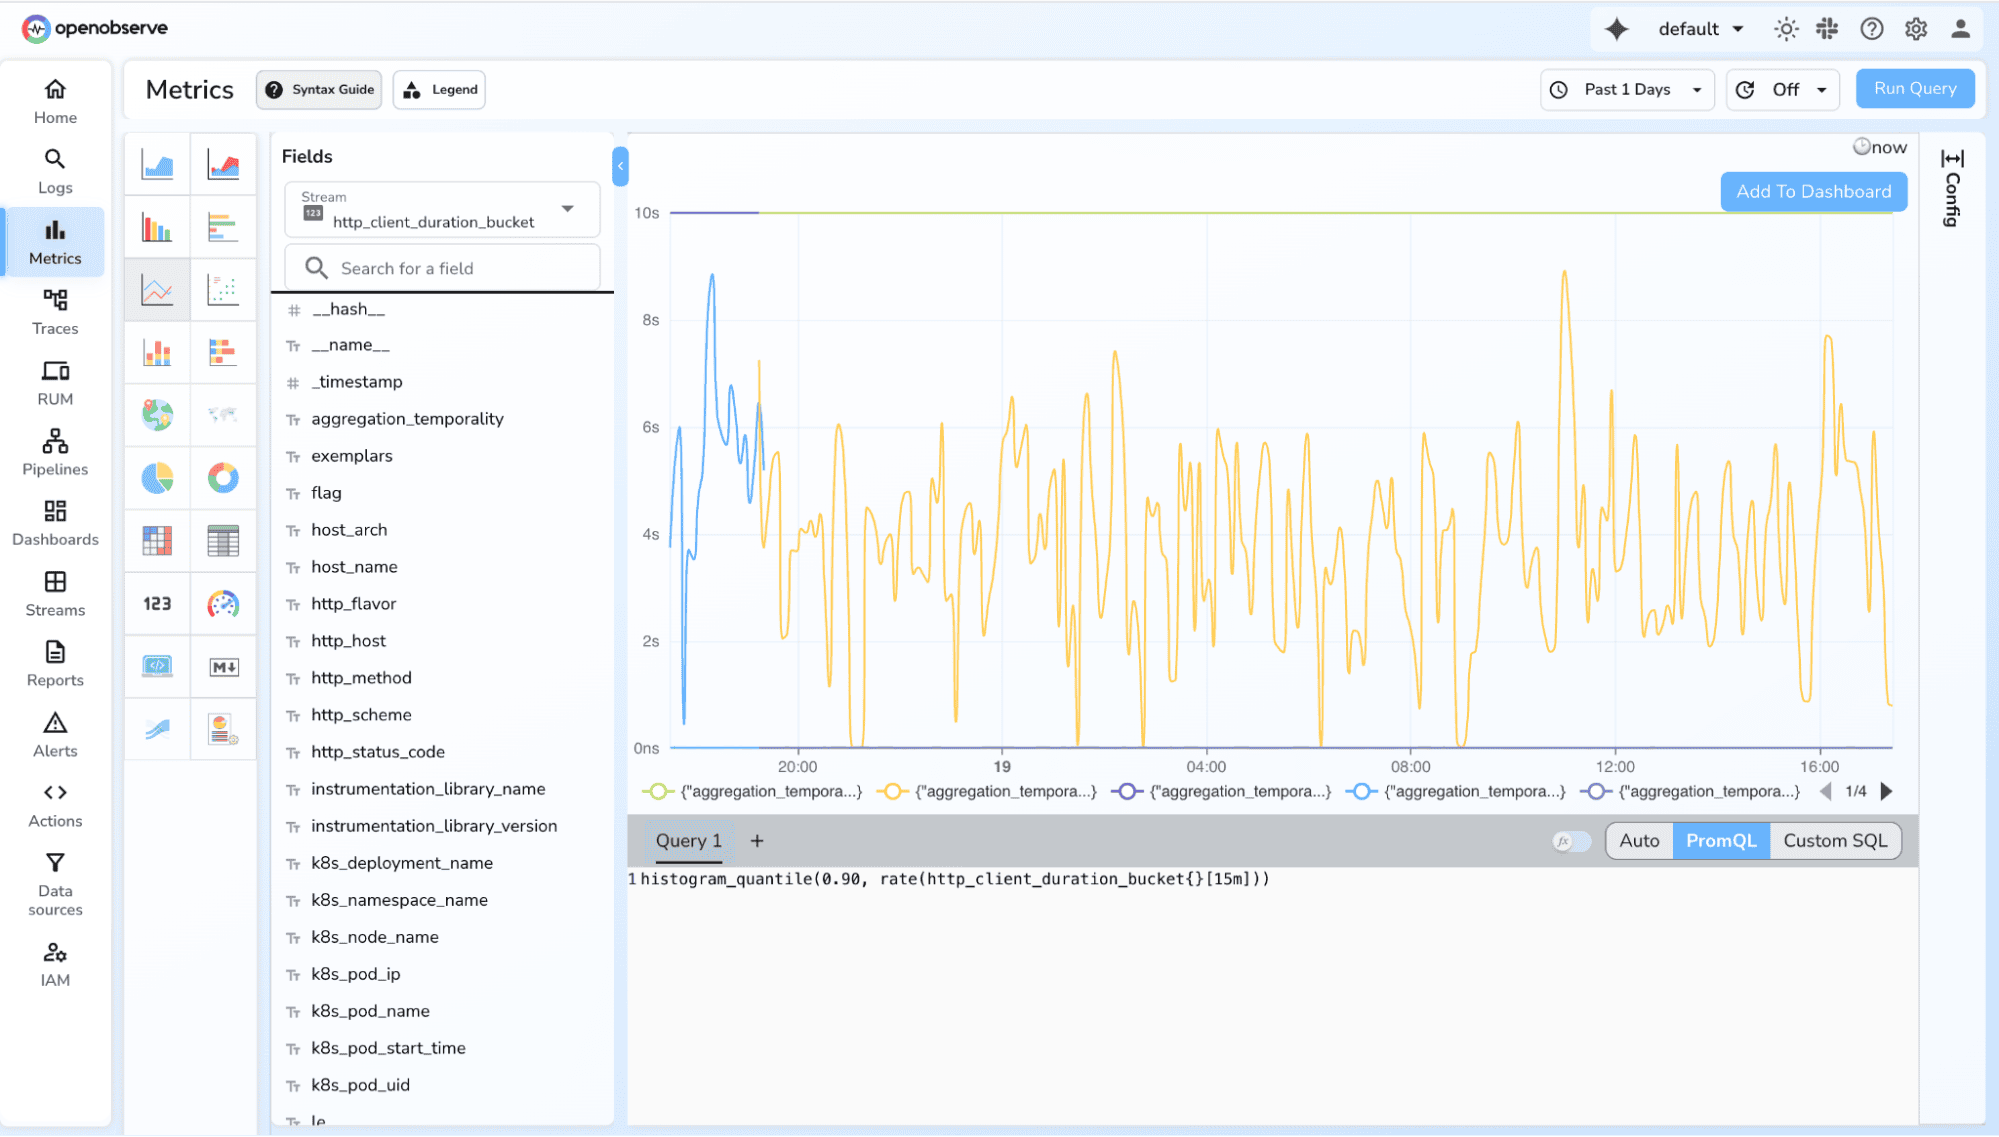
1. P90 / P95 / P99 Latency
- Why: Understand slow requests and tail latency
- Example Query:
histogram_quantile(0.95, rate(http_request_duration_seconds_bucket[5m]))
2. Full Latency Distribution
Why: See how requests spread across buckets
Example Query:
sum(rate(http_request_duration_seconds_bucket[5m])) by (le)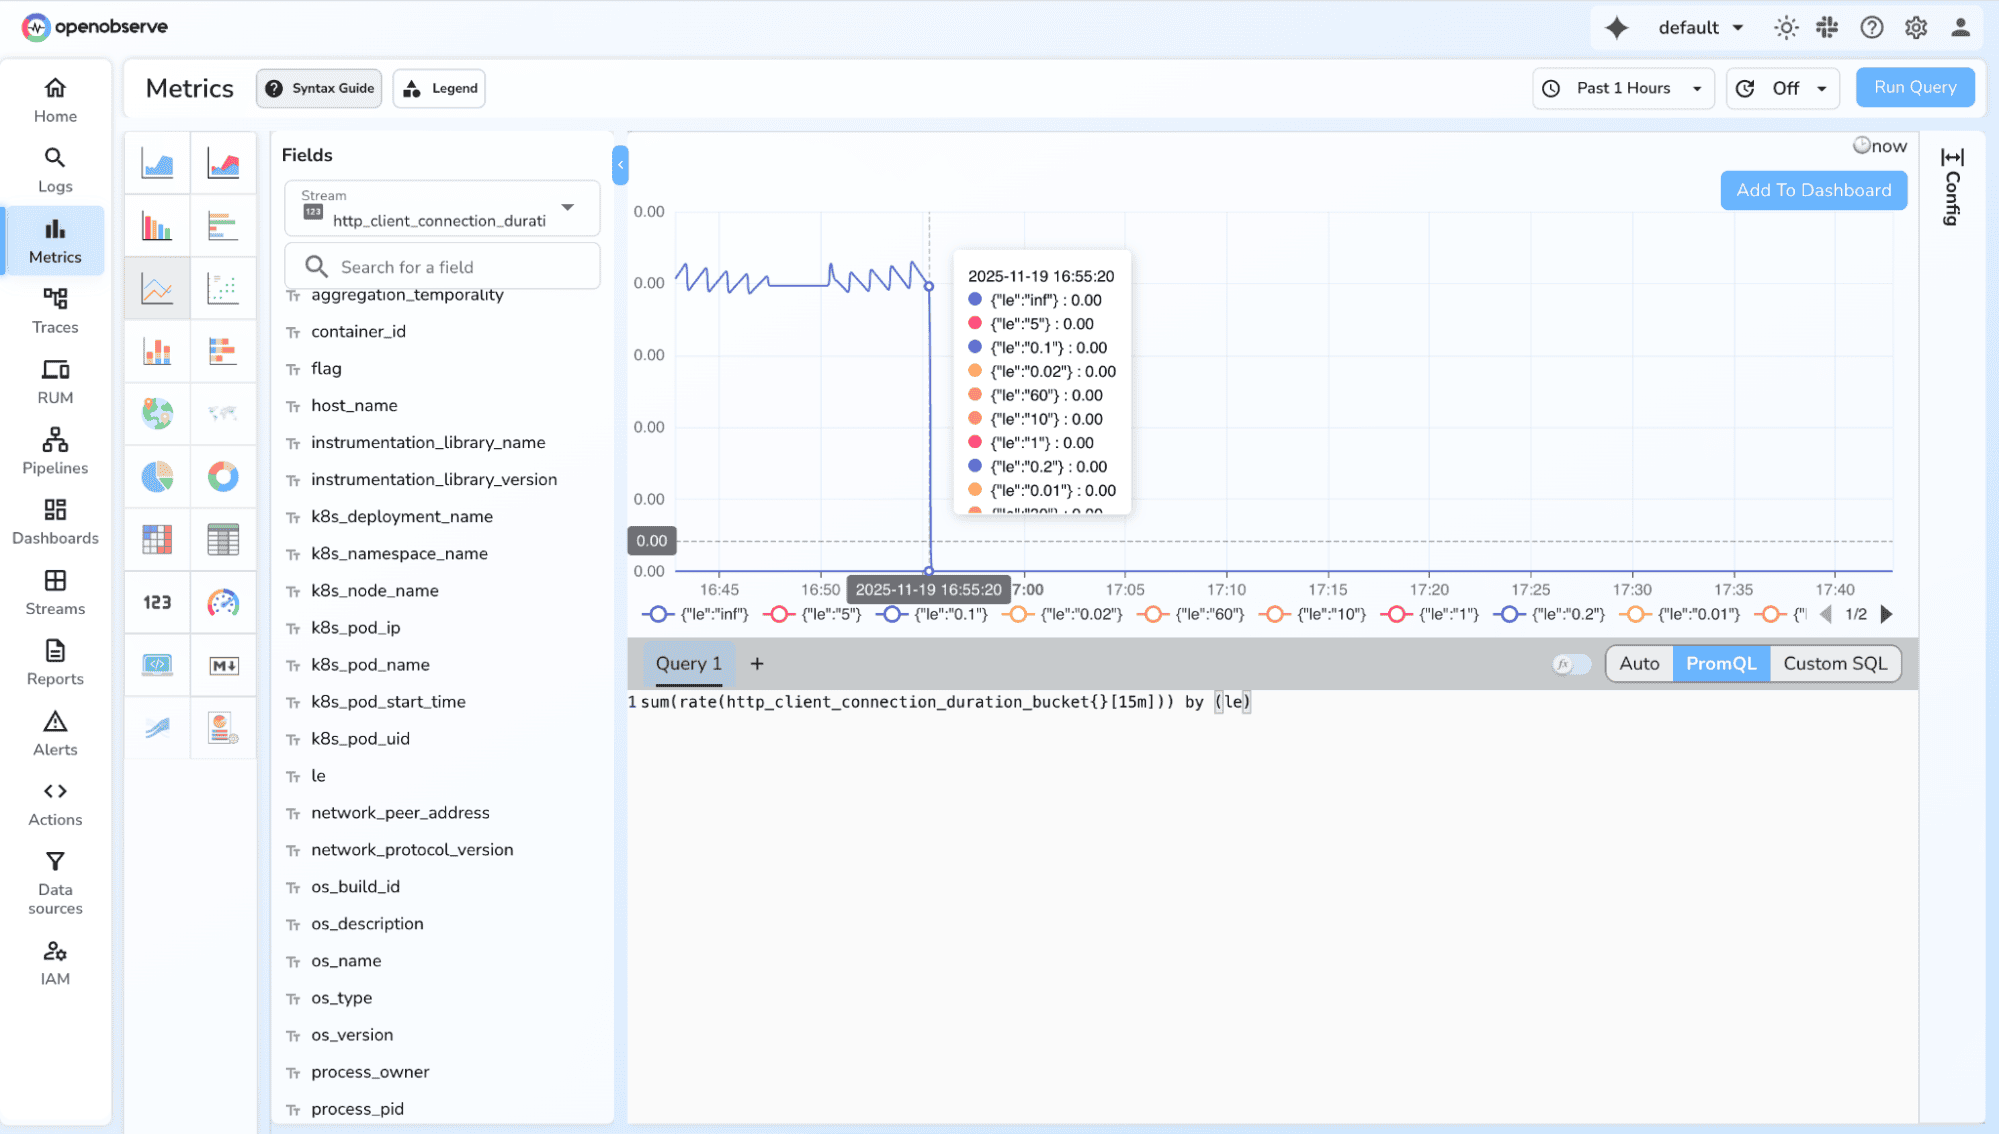
Common Visualizations for Summary Metrics
Summaries provide client-side quantiles, total count, and sum, useful for quantile tracking when precise percentile values are needed without buckets.
1. High-percentile latency (P90, P99)
- Why: Quick visibility without bucket queries
- Example Query:
http_request_duration_seconds
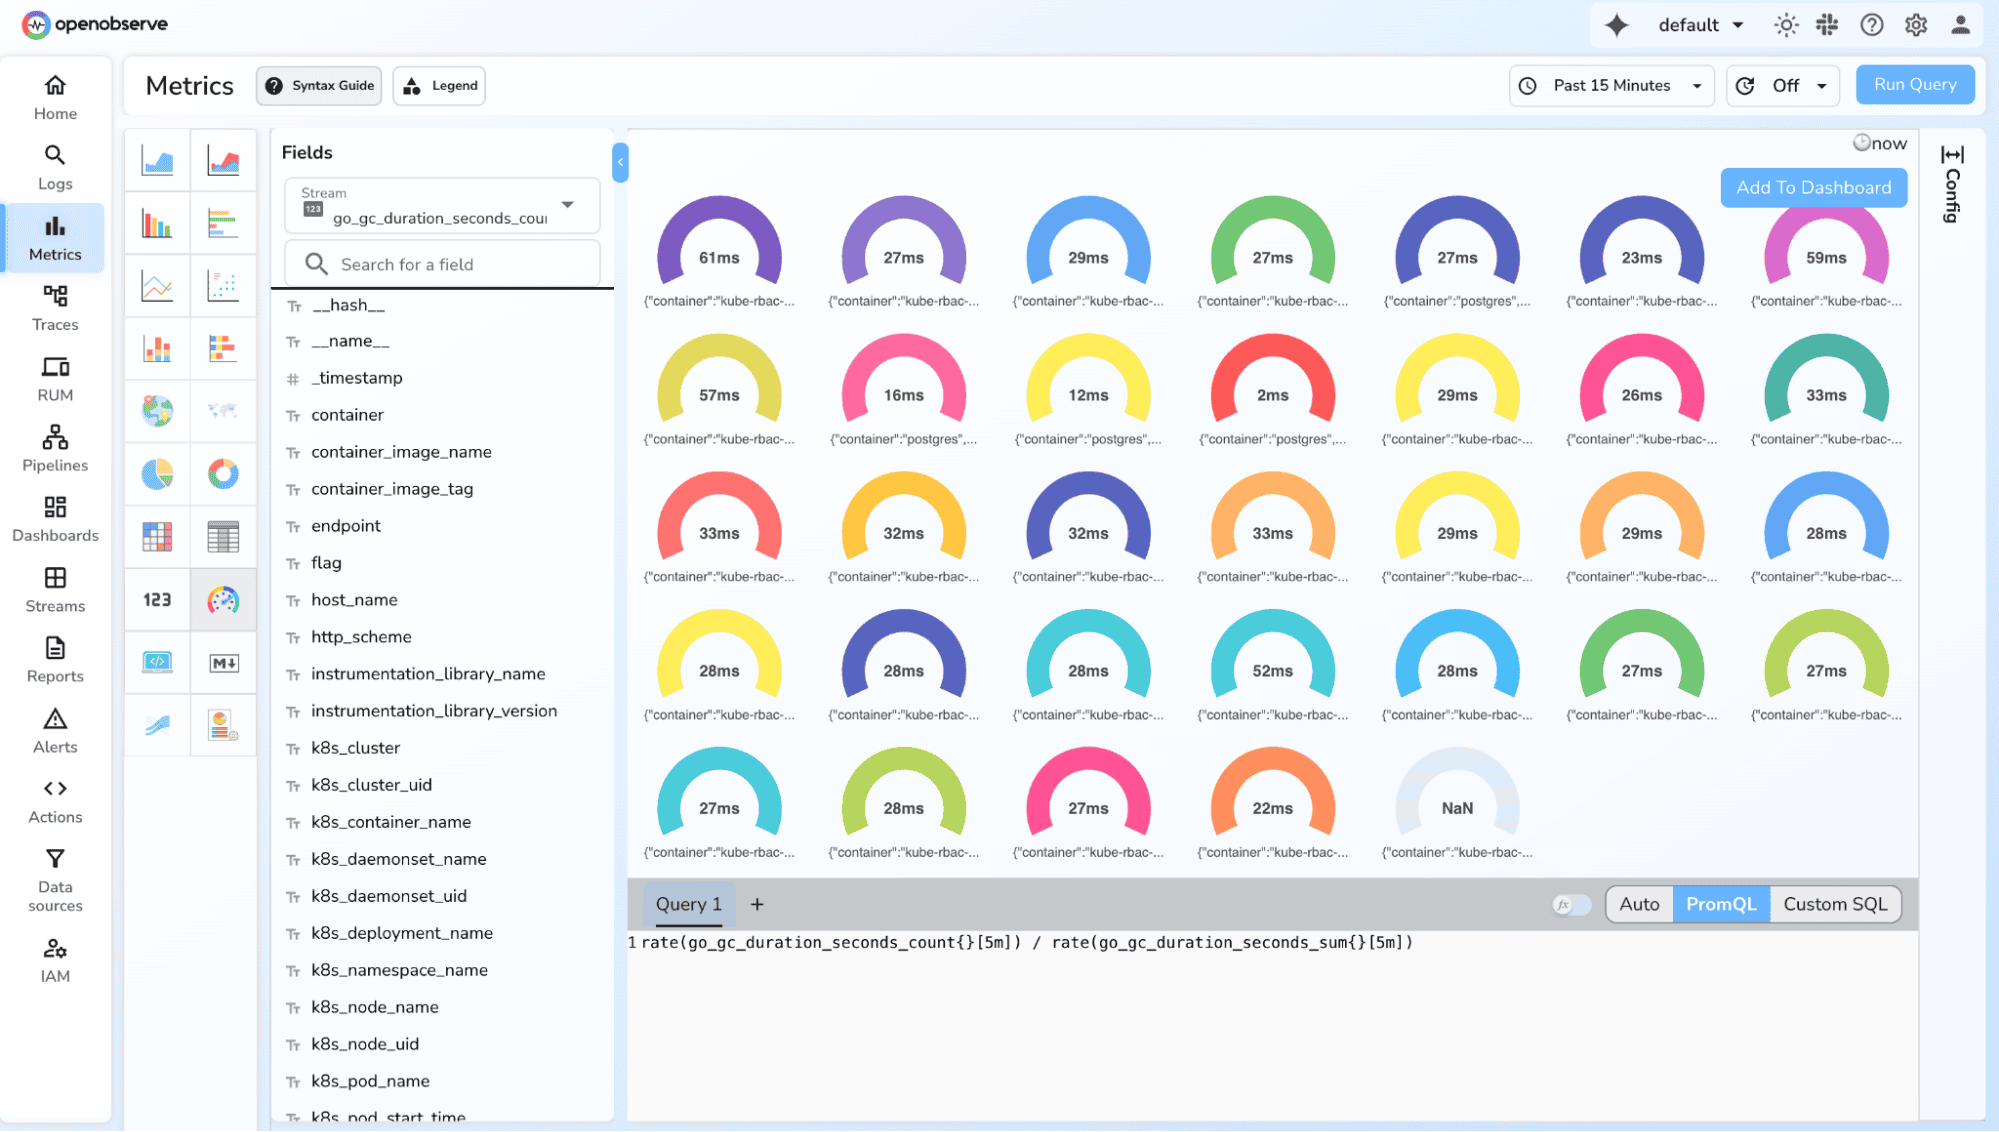
2. Sum and Count Based Averages
- Why: Trend average performance over time
- Example Query:
rate(http_request_duration_seconds_sum[5m]) / rate(http_request_duration_seconds_count[5m])
Conclusion
Prometheus gives you a powerful foundation for understanding your system through metrics - counters for tracking events, gauges for real-time state, histograms for latency distributions, and summaries for client-side quantiles. Once you understand how to choose and use these metric types effectively, you unlock deep visibility into your application's behavior.
But real-world observability doesn’t stop at collecting metrics; you also need long-term storage, scalable querying, and correlation across logs and traces. That’s where OpenObserve completes the story. By sending your Prometheus metrics into O2, you get limitless retention, unified dashboards, and full multi-signal observability all without the operational overhead of running extra Prometheus ecosystem components. Together, Prometheus + OpenObserve give you a complete, production-ready monitoring stack that scales with your system and makes every metric actionable.
Get Started with OpenObserve Today! Sign up for a free cloud trial.
Next Steps
About the Author
Simran Kumari

Passionate about observability, AI systems, and cloud-native tools. All in on DevOps and improving the developer experience.
Follow OpenObserve on Google
Add OpenObserve as a preferred source to see more of our articles in Google Search and Top Stories.












