Alerting 101: From Concept to Demo




Ready to get started?
Try OpenObserve Cloud today for more efficient and performant observability.
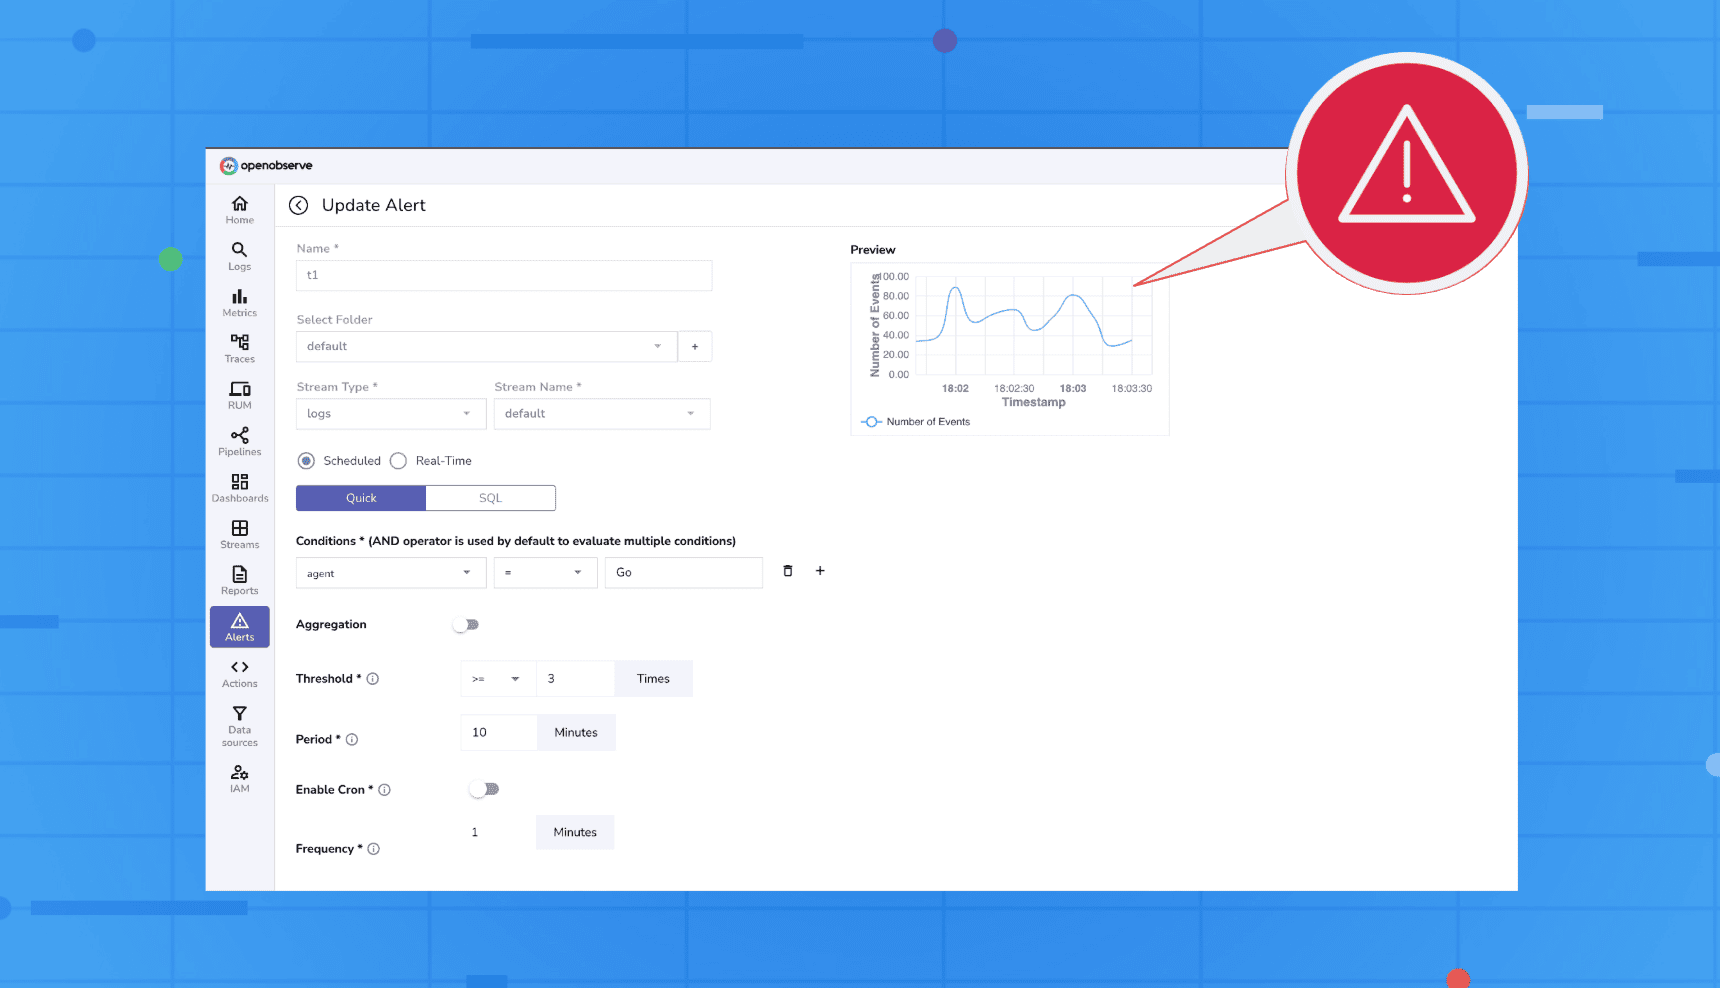
Alerting 101: From Concept to Demo
Alerting is a critical part of observability. When something goes wrong in your systems, alerts are your eyes and ears, helping you respond before users notice. OpenObserve provides a flexible alerting system that allows you to monitor logs and metrics in real-time or on a scheduled basis, customize how notifications appear, and control where they are sent. In this blog, we’ll break down the alerting system into its key components, and then walk you through a practical demo so you can see it all in action.
Understanding OpenObserve Alerts
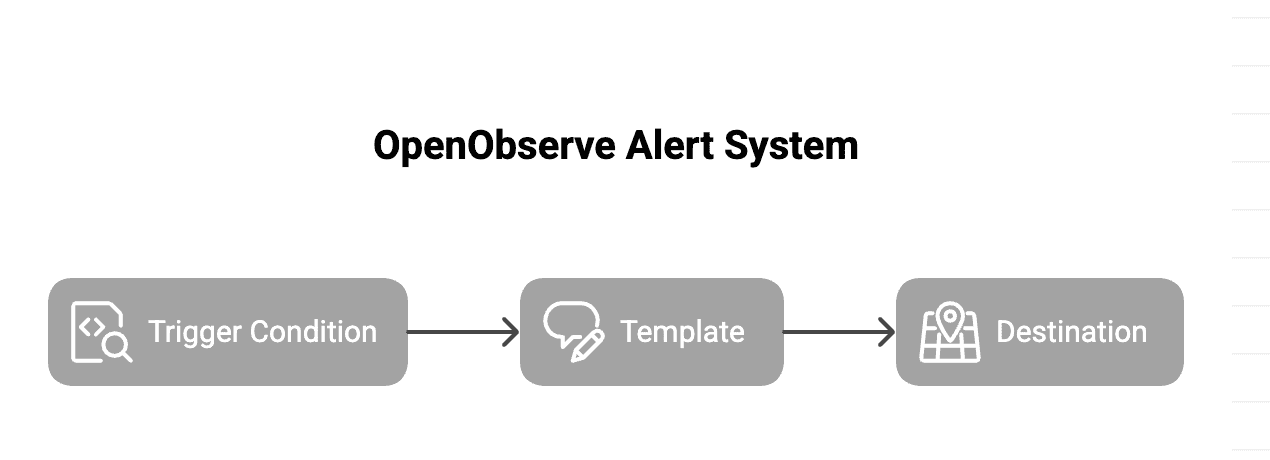
In OpenObserve, alerts work like a flow where you define the logic, format the payload, and route it to your destination.
- Alerts: Define the condition logic using SQL queries and thresholds that determine when an alert fires. Example: trigger when
error_rate > 1%orp95_latency > 500ms. - Templates: Define the alert payload, controlling how the message looks and what fields are included.
- Destinations: Define where the alert is sent: Slack, Microsoft Teams, email, or a custom webhook.
In short: Trigger Condition (SQL) → Template (Message) → Destination (Delivery)
You control each stage, from detection logic to the final payload your team receives.
1. Alerts
Alerts in OpenObserve let you monitor your logs or metrics by defining specific conditions. They help you stay on top of critical issues and trends in your system. OpenObserve supports two types of alerts:
- Real-Time Alerts: These trigger immediately whenever the defined condition is met. Ideal for critical events like service crashes, high error rates, or security breaches where instant response is key.
Example: Trigger when theseverityfield equalscritical. - Scheduled Alerts: These evaluate data over a defined period, making them great for trend-based monitoring and reducing noise from one-off spikes.
Example: “Notify me if there are 10 errors in the last 1 minute.”
Key Parameters in Scheduled Alerts
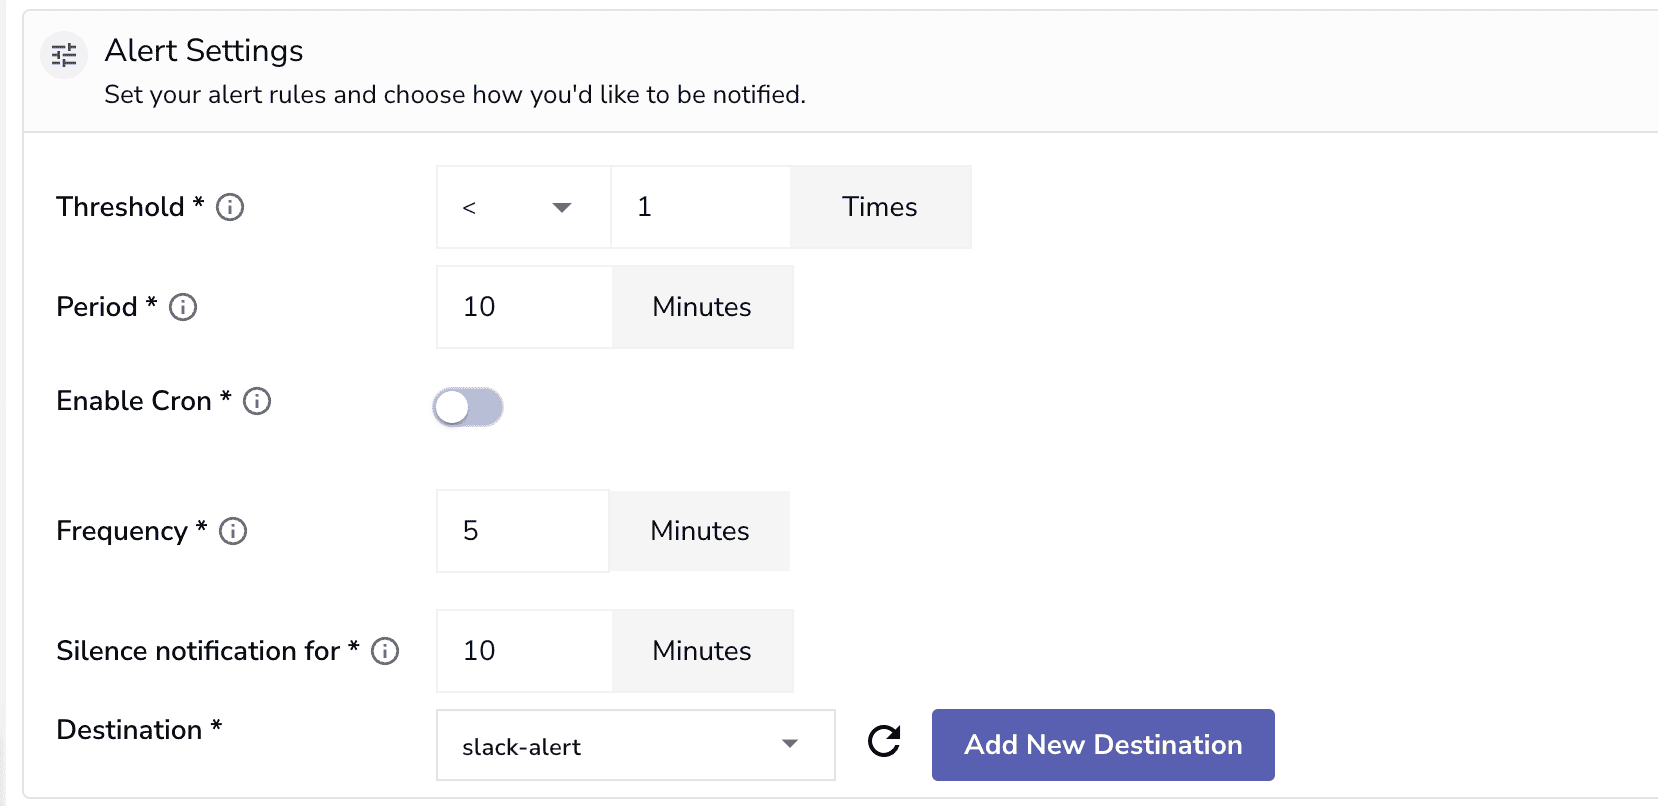
Threshold: The upper or lower limit that determines when the alert should trigger. Threshold is measured against the number of records returned by the SQL query.
Example: If the threshold is >100 and your query returns 101 records, the alert fires.
Period: The time window of data the query should analyze.
Example: A 10-minute period means each run looks at data from the last 10 minutes.
Frequency: How often the query should run and be evaluated.
Example: Every 2 minutes, meaning the query checks the last 10 minutes of data every 2 minutes.
You can configure frequency using:
- Simple intervals (e.g., every 1m, 5m, 15m)
- Cron expressions for more precise scheduling (e.g., run only during work hours or specific days)

Silence Notification For: A cooldown period that prevents alert spam by suppressing repeated notifications.
Example: If an alert fires at 4:00 PM and silence is set to 10 minutes, it won’t send another until 4:10 PM.
Aggregation: Defines how the data should be summarized before evaluation.
Examples:
COUNT(*)→ counts matching recordsAVG(duration)→ measures average response time
Scheduled alerts come in two operational modes:
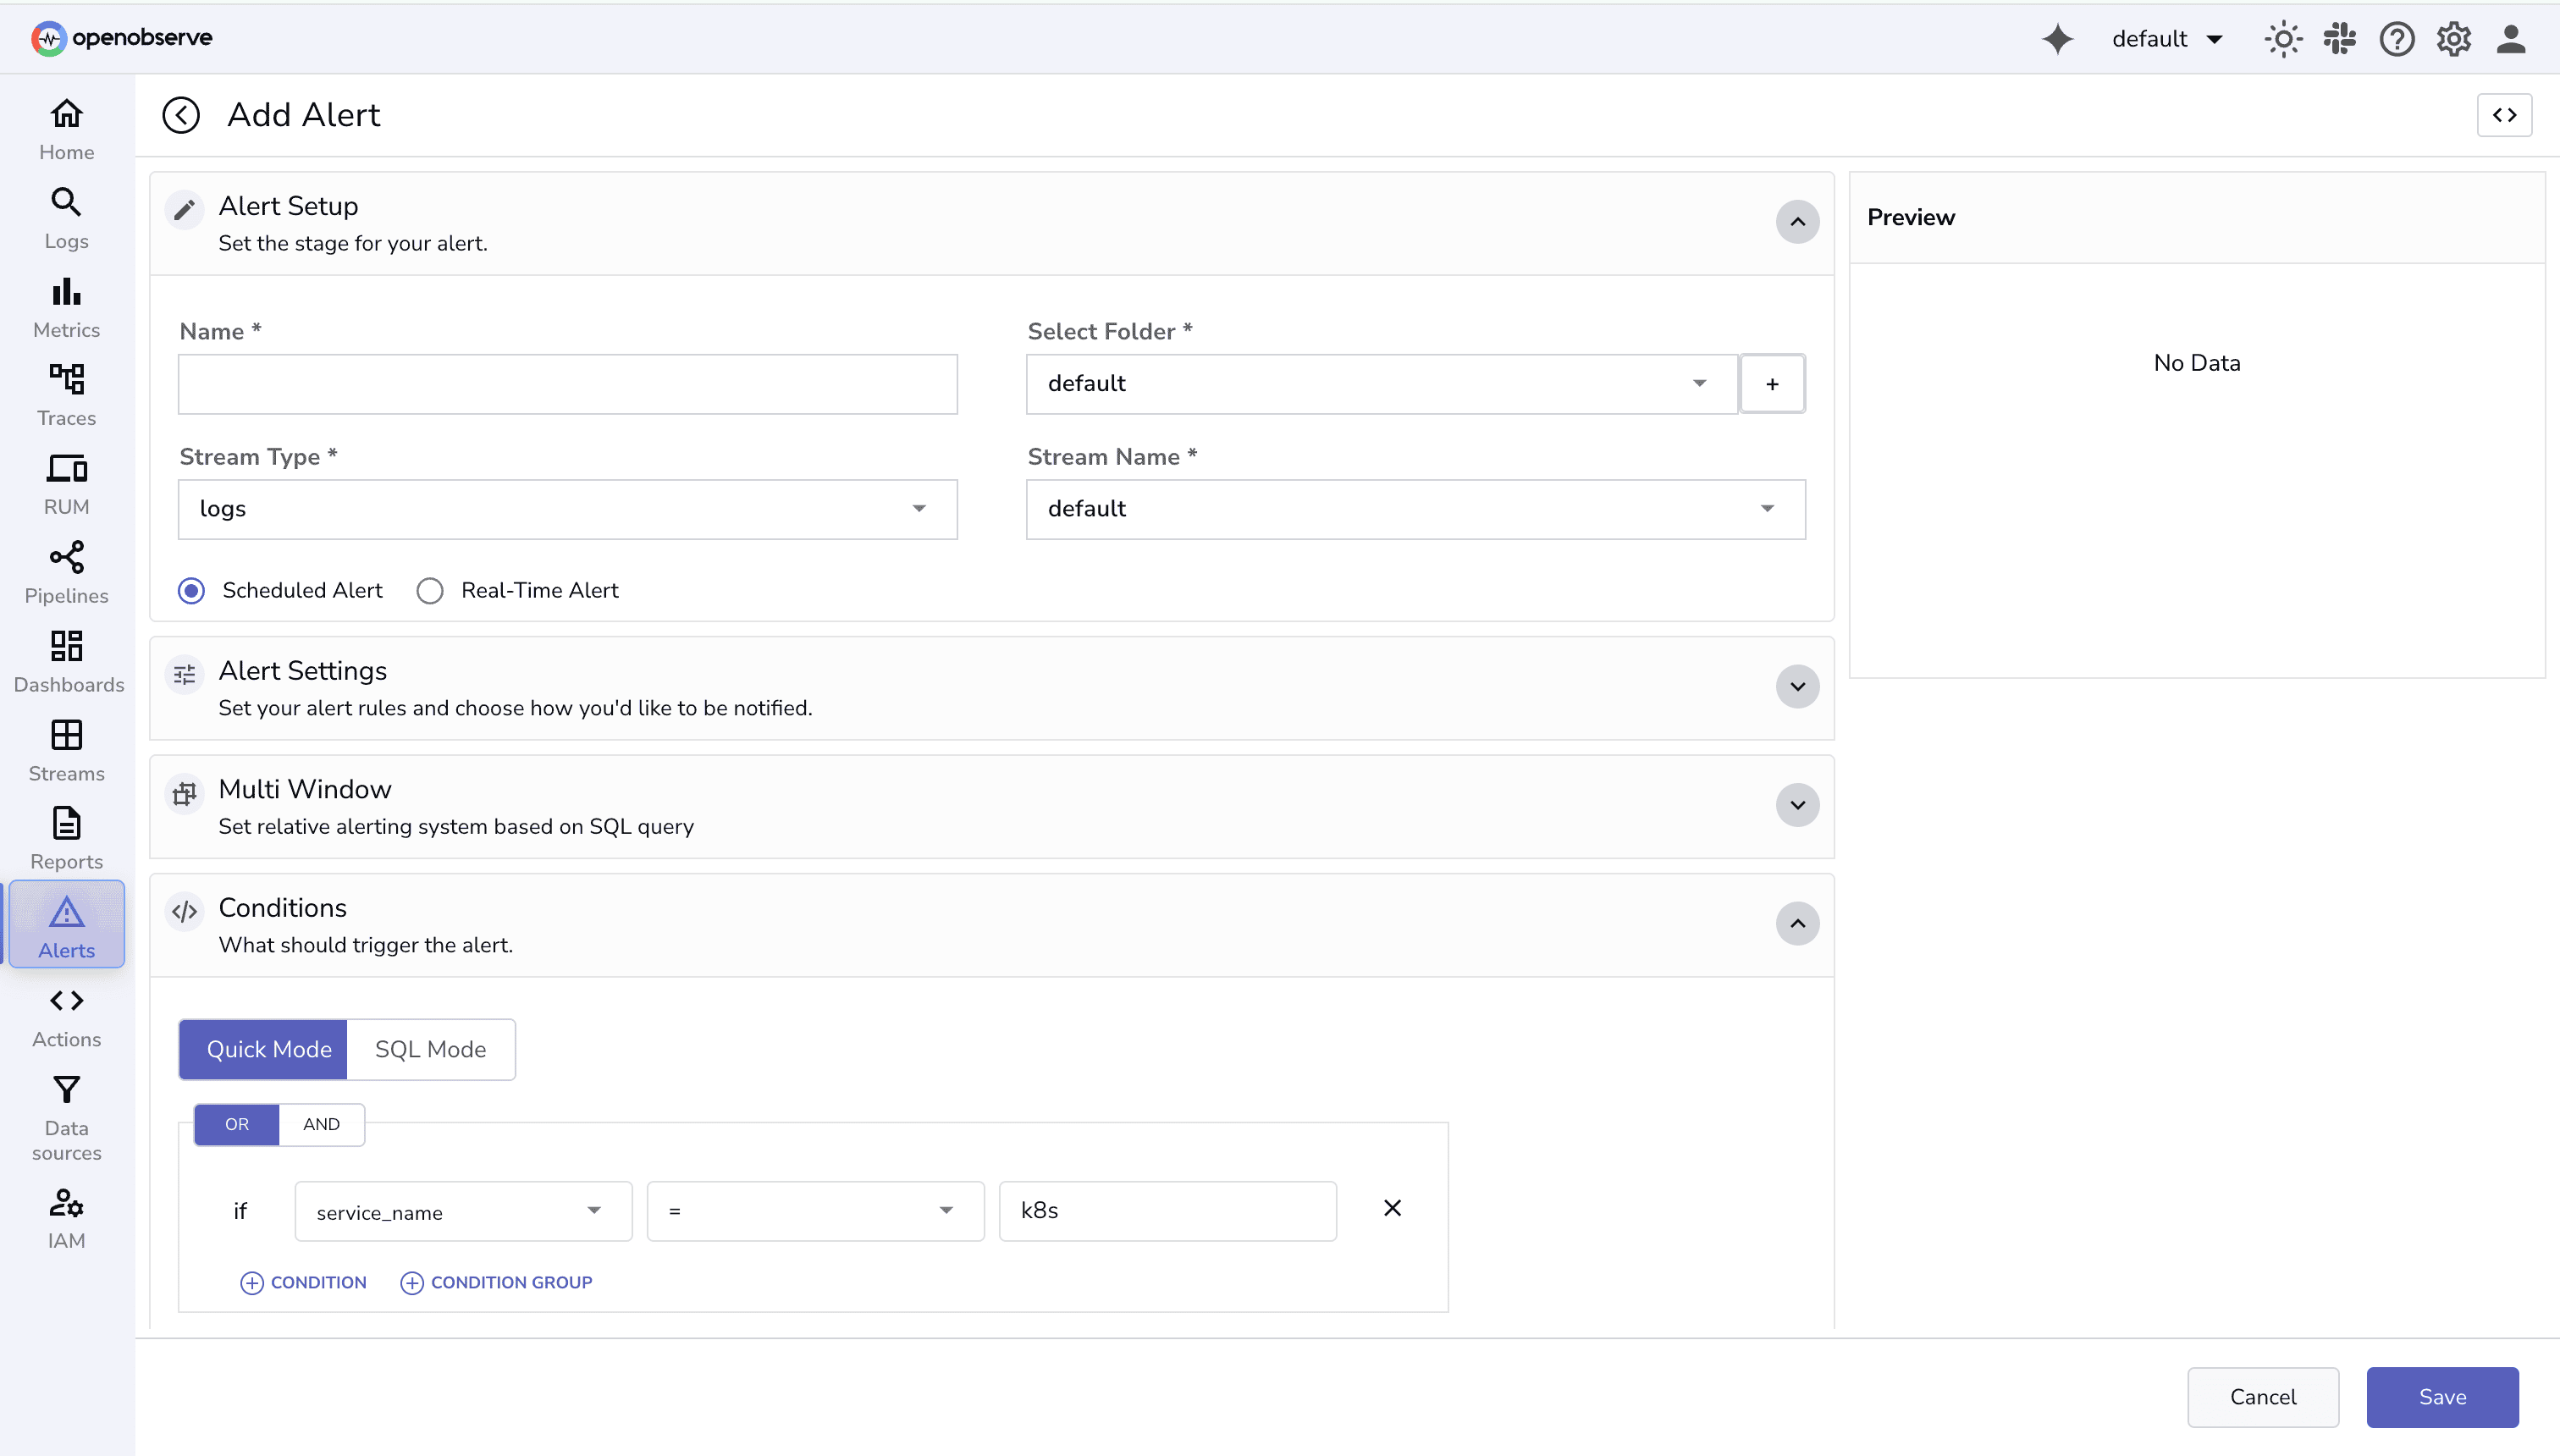
1. Quick Mode:
- Define the condition, aggregations, and grouping using a simple UI.
- OpenObserve automatically converts this into an SQL query.
- The alert is evaluated at the configured frequency.
2. SQL Mode
- Write your own custom SQL query for full control.
- The alert triggers based on the query result and is evaluated according to threshold, frequency, period, and silence window.
Note: Aggregation and Group By are available with quick mode, with SQL Mode you can define these operations directly in the query.
When an alert is created, the Alert Manager evaluates it at the defined frequency. Each run checks whether the alert condition is met based on your SQL query and thresholds.
In the UI, two key timestamps help you track the alert’s lifecycle:
- Last Triggered At: The most recent time the alert condition was evaluated.
- Last Satisfied At: The most recent time the alert condition was satisfied, i.e. the condition was evaluated to true, and the notification was sent out.

2. Templates
Templates control what information is sent and how it appears. They support variables, multiple rows, and even row limits to keep messages concise. Templates make alerts readable, actionable, and easier to debug.
Key Features:
- Include key metadata such as alert name, stream, timestamp, and URL.
- Extract fields from logs or metrics like host, severity, or service.
- Limit rows displayed using
{rows:N}or truncate strings with{var:N}. - Add additional context variables like team, platform, or organization.
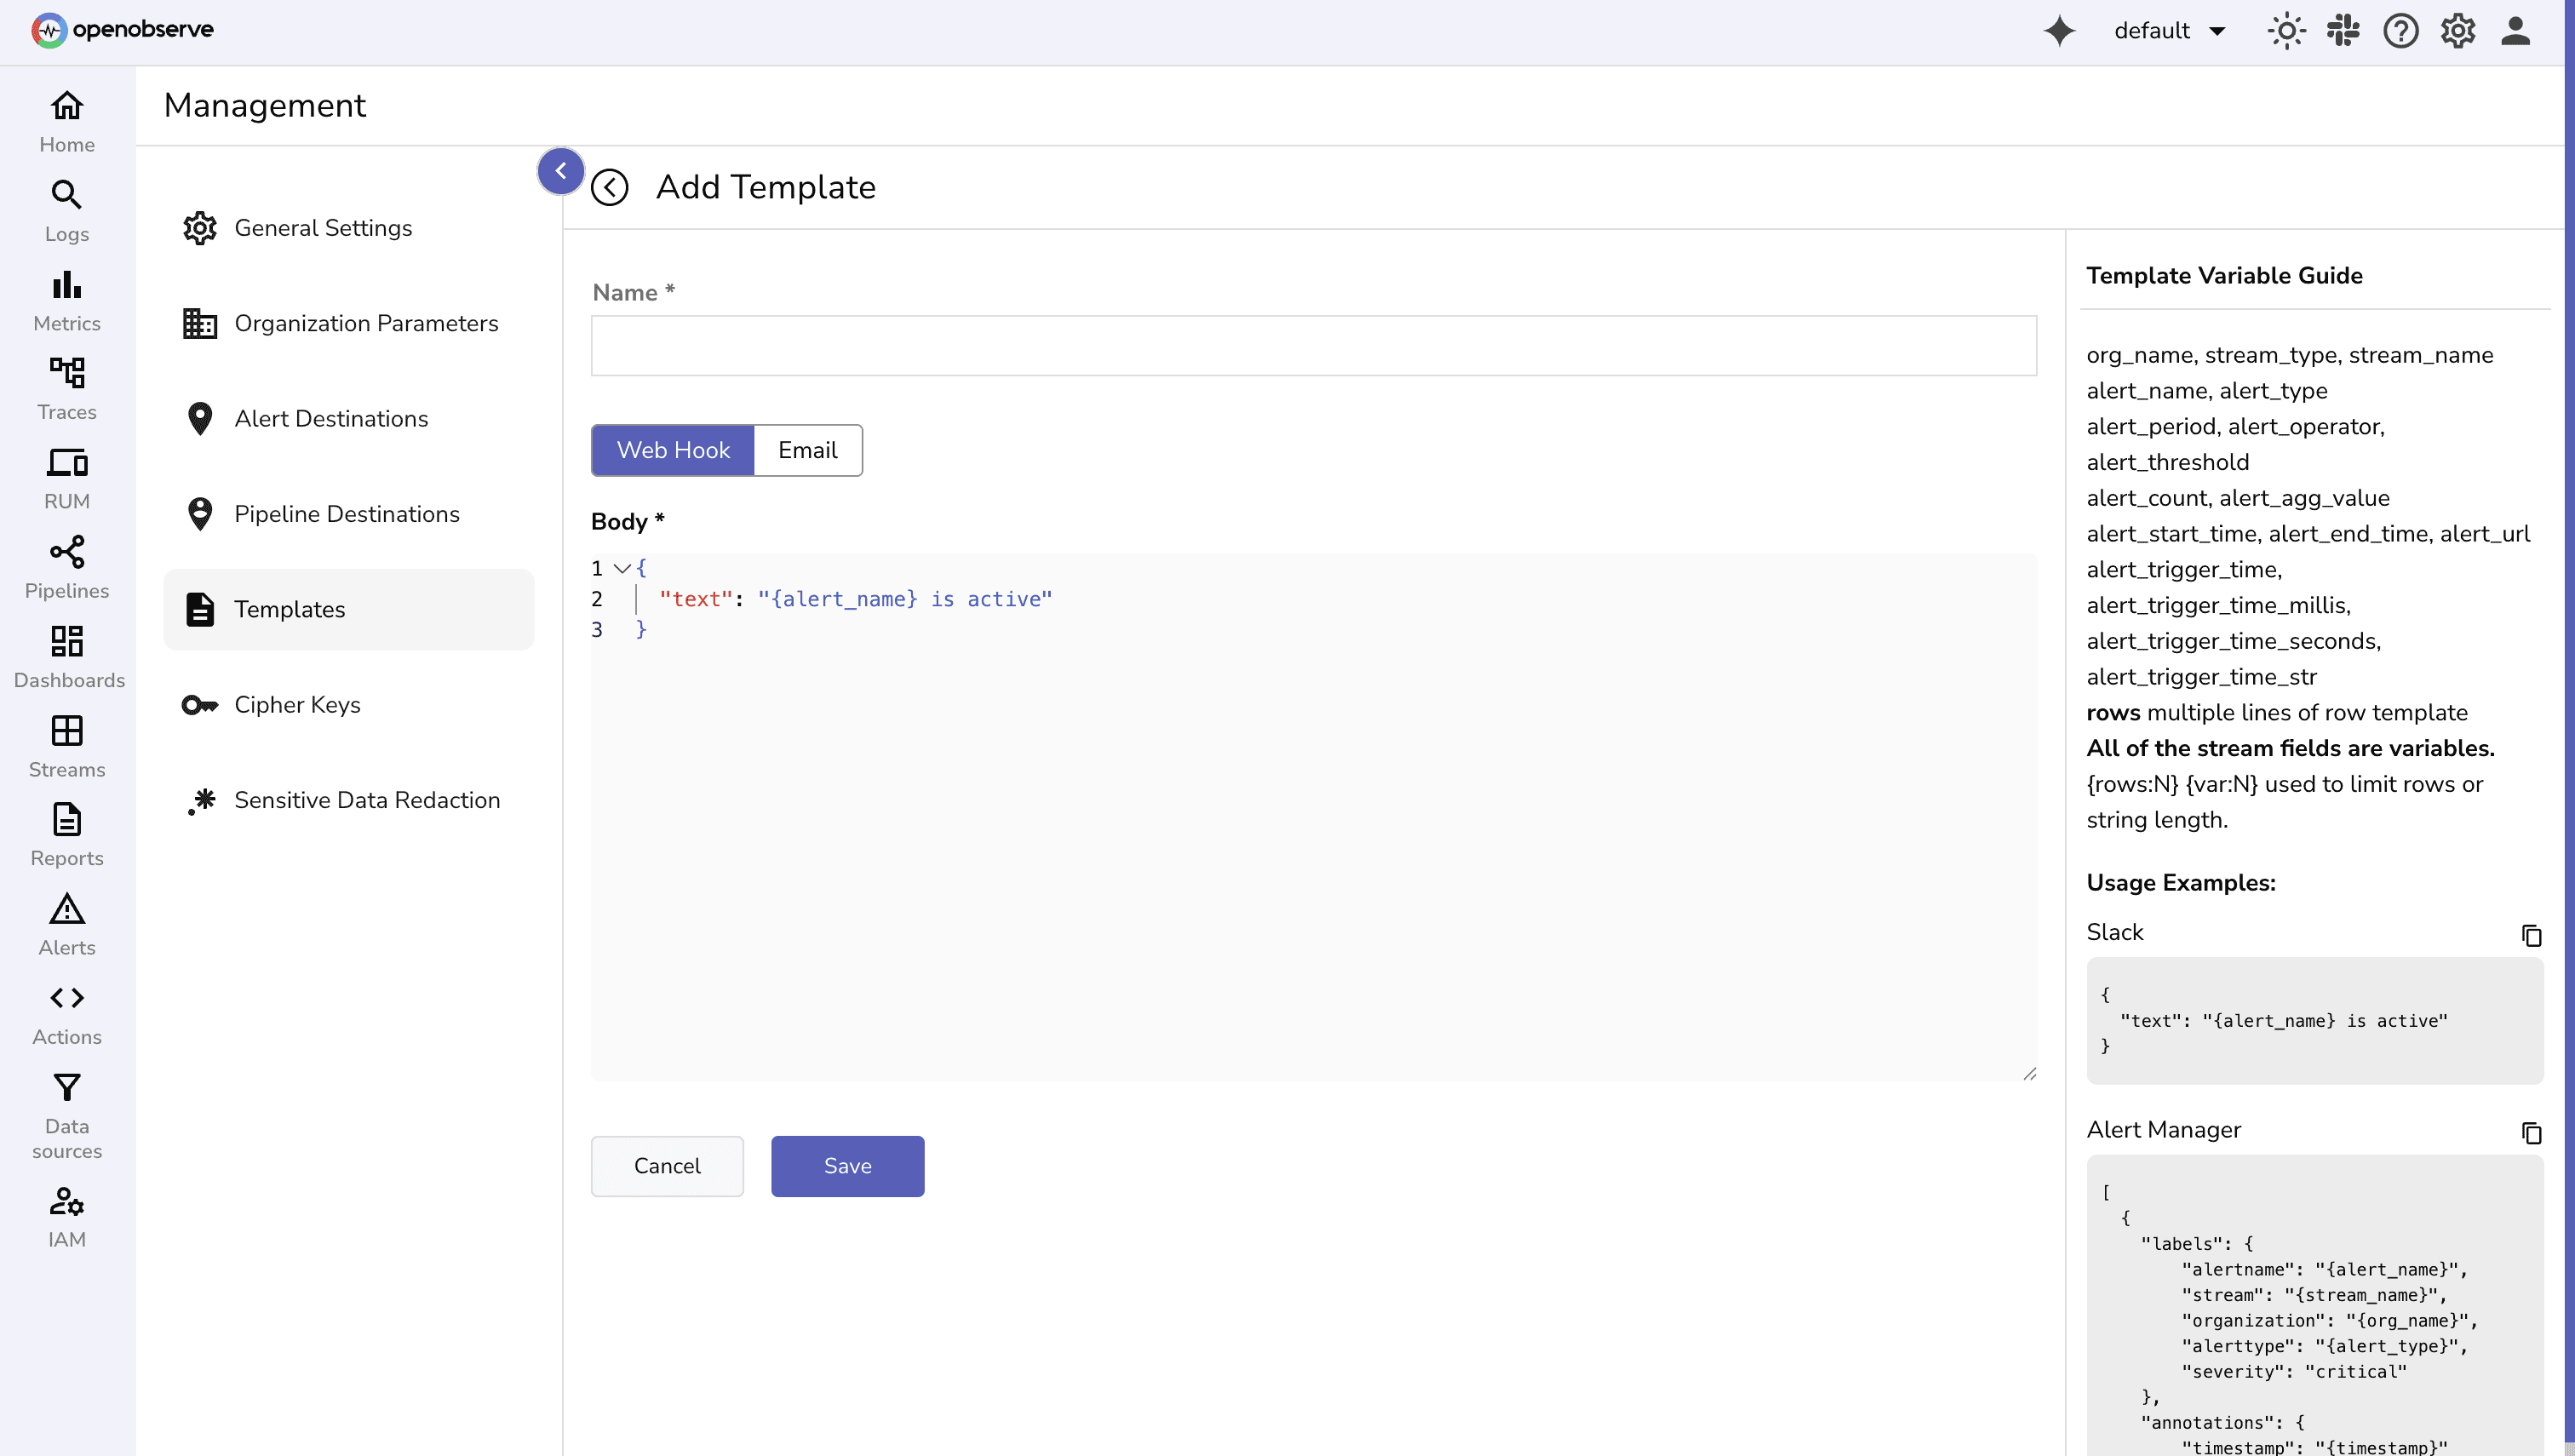
Template Variables
You can use these variables in templates:
- Organization & Stream Info:
org_name,stream_type,stream_name - Alert Info:
alert_name,alert_type,alert_period,alert_operator,alert_threshold - Alert Metrics:
alert_count,alert_agg_value - Timing:
alert_start_time,alert_end_time,alert_url,alert_trigger_time,alert_trigger_time_millis,alert_trigger_time_seconds,alert_trigger_time_str - Rows & Stream Fields: All fields in the stream can be used; support multiple lines via
rows - Limits:
{rows:N}limits number of rows;{var:N}limits string length
Usage Examples
Slack
{
  "text": "{alert_name} is active"
}
Alert Manager (Prometheus style)
[
  {
    "labels": {
        "alertname": "{alert_name}",
        "stream": "{stream_name}",
        "organization": "{org_name}",
        "alerttype": "{alert_type}",
        "severity": "critical"
    },
    "annotations": {
        "timestamp": "{timestamp}"
    }
  }
]
Email Templates
Unlike webhook templates that expect a JSON payload, email templates expect plain text or HTML in the body. All template variables can be used in the same way as webhook templates.
Example: HTML Email Template
Title: Alert: {alert_name} triggered
Body:
<h3>Alert Name: {alert_name}</h3>
<b>Details:</b>
<ul>
  <li>Stream: {stream_name}</li>
  <li>Organization: {org_name}</li>
  <li>Alert URL: {alert_url}</li>
  <li>Triggered At: {alert_trigger_time}</li>
</ul>
- The title field becomes the subject of the email and supports all template variables.
- Note: An email template is required if the alert uses an email destination.
Tips:
- Keep messages concise using
{rows:N}and{var:N}. - Always include
{alert_url}or another identifier for easy debugging.
3. Destinations
Destinations determine where your alert goes. For example, Slack channel, Microsoft Teams, Prometheus Alertmanager or even a Custom webhook.
Because OpenObserve supports webhooks, you’re not limited to Slack or email. You can plug alerts directly into your team’s existing incident response stack, such as:
- PagerDuty – Auto-create incidents when critical alerts fire.
- Opsgenie – Route alerts to on-call engineers based on schedule.
- ServiceNow / Jira – Open tickets automatically for recurring issues.
- Linear / ClickUp – Track performance degradations as tasks.
- Discord or Mattermost – Send alerts to dev community or internal ops channels.
- Custom internal tools – Trigger remediation scripts or automation workflows.
This flexibility makes OpenObserve alerts a powerful part of your end-to-end incident response process, from detection to notification to resolution.
To set up a destination, you define:
- URL of the endpoint.
- HTTP Method: POST, PUT, or GET.
- Template to use.
- Optional headers, such as
Content-Type: application/jsonor authentication tokens.
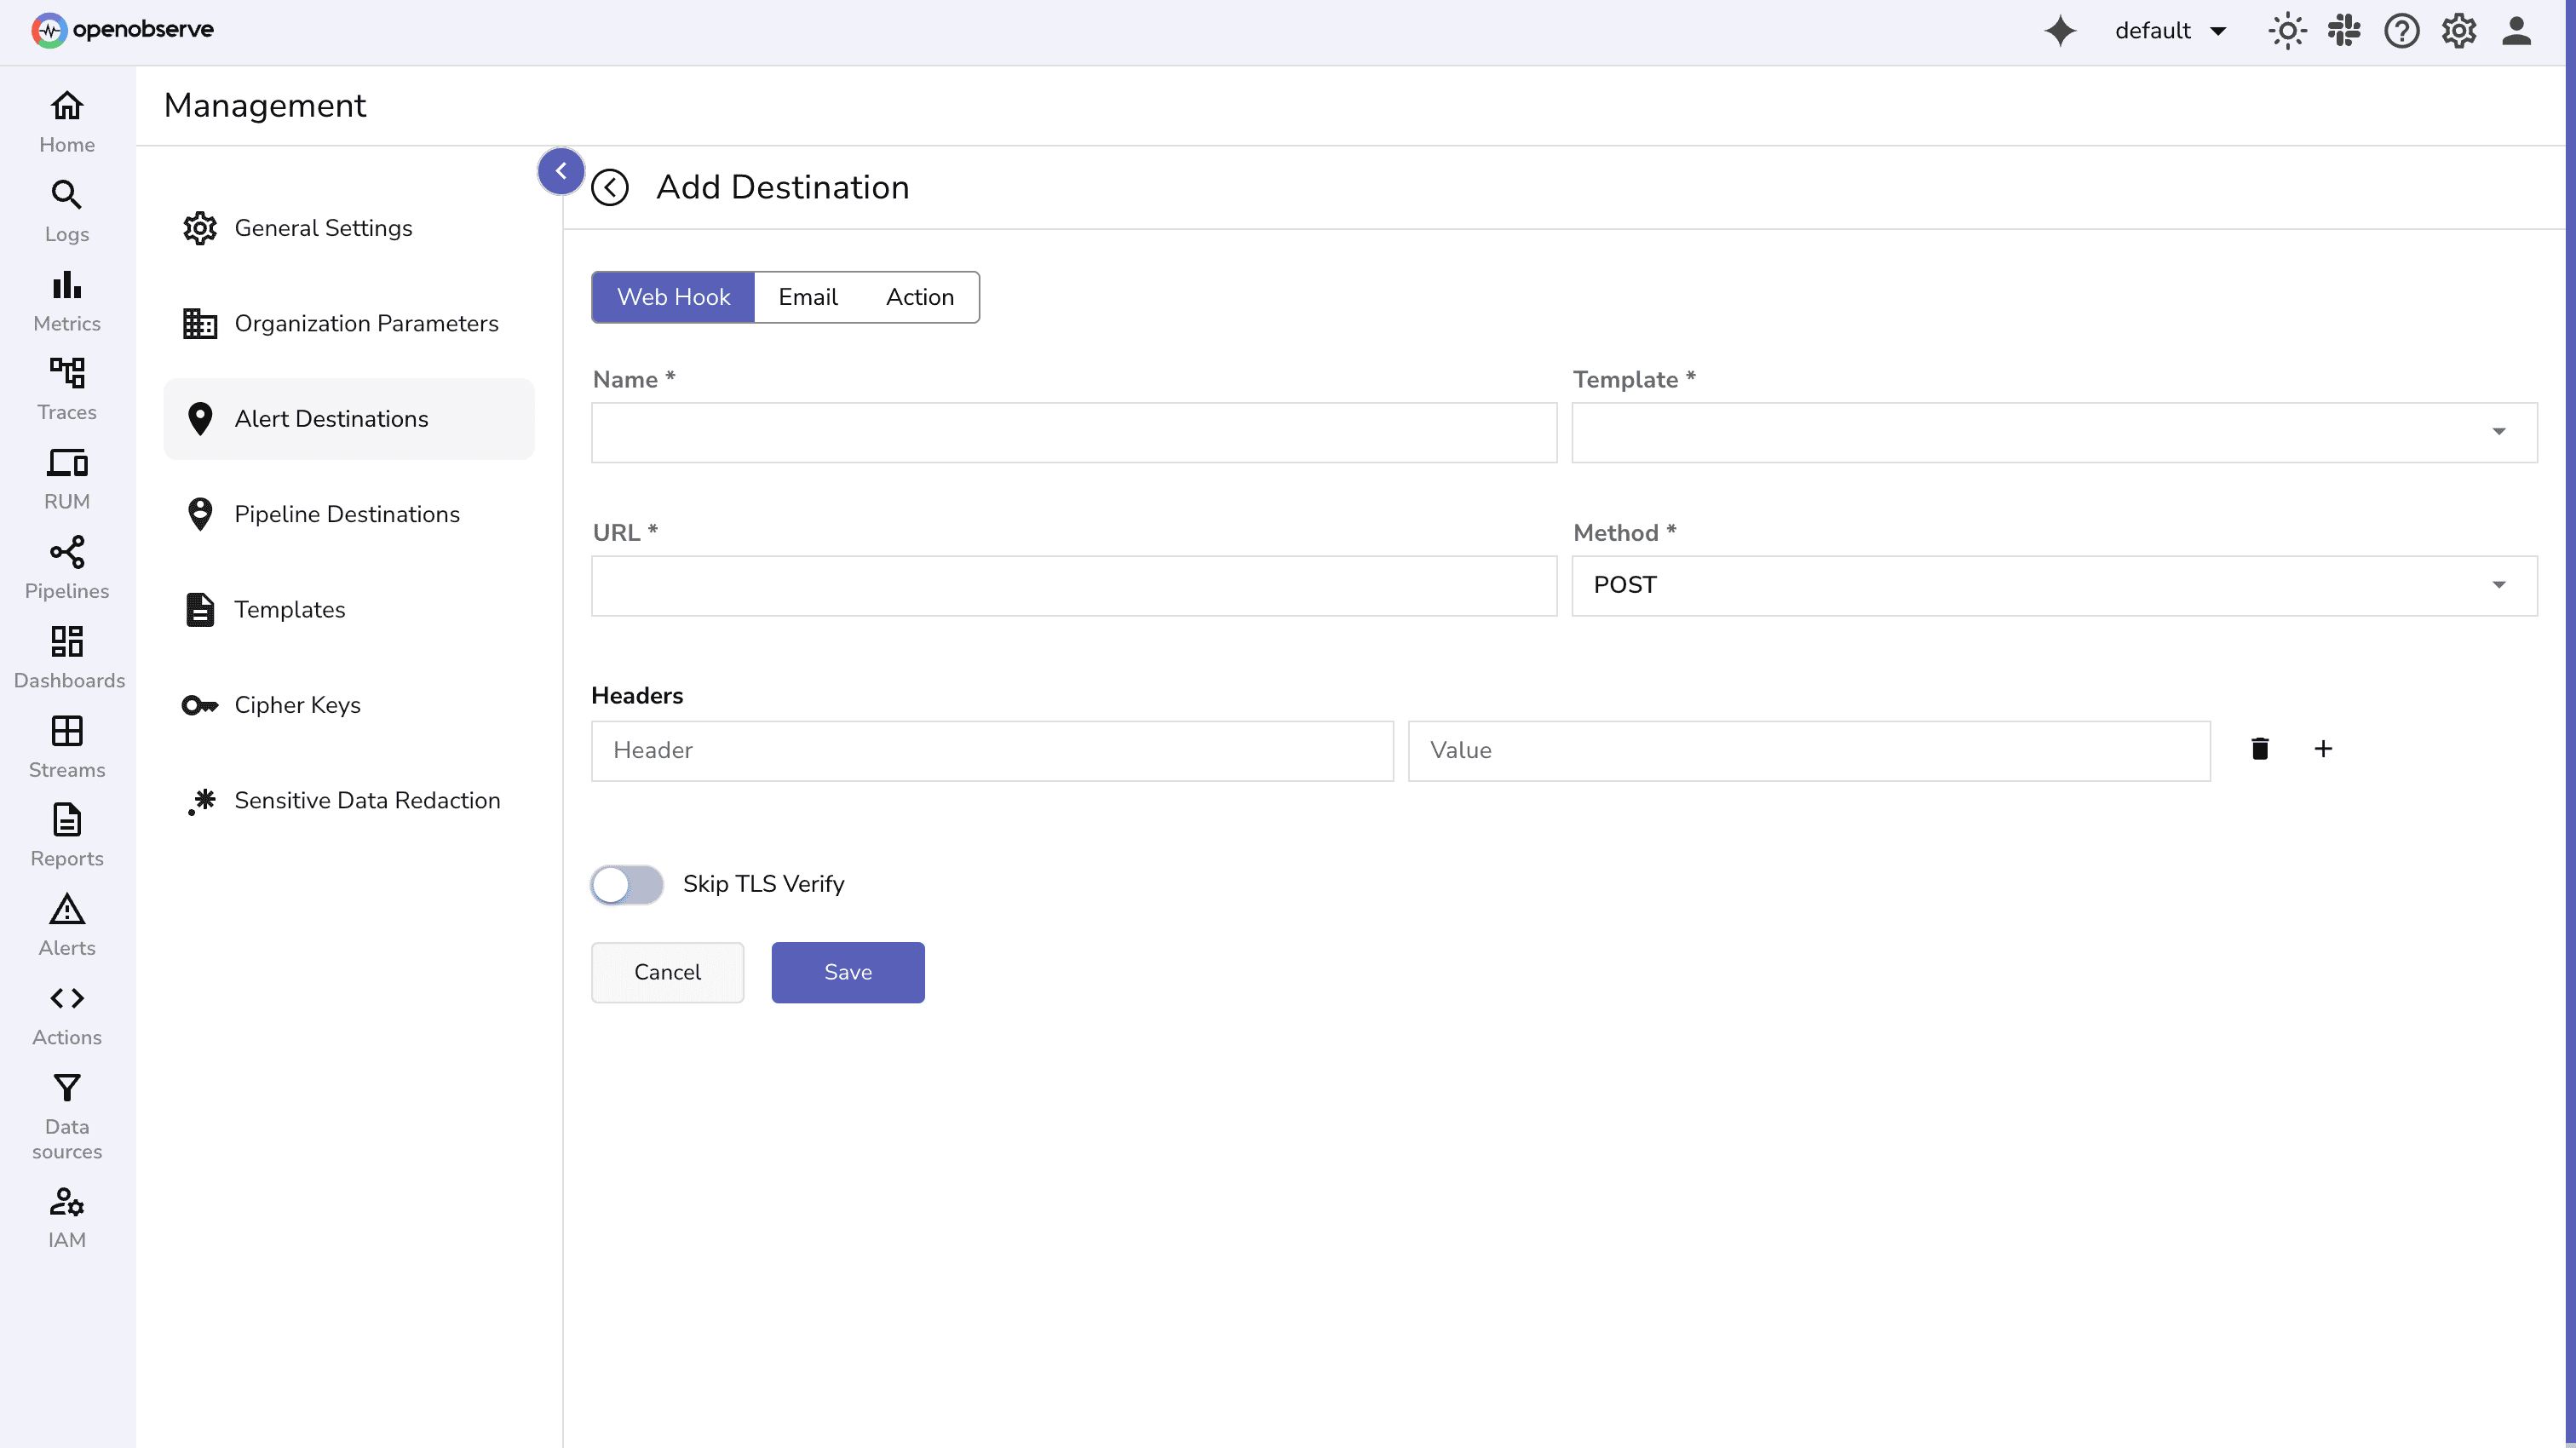
Destinations make alerting flexible: you can send critical alerts to Slack while sending trends to Prometheus.
Demo: See Alerts in Action
Now that we understand the components, let’s put it all together in a hands-on demo.
Step 1: Prepare the Log Stream
Before creating an alert, make sure you already have logs flowing into a stream. For this example, we’ll use a stream called http_stream(you can name it anything).
The logs being used looks like this:
{
  "_timestamp": 1759842537000000,
  "service_name": "webapp",
  "host": "web-server-1",
  "path": "/api/login",
  "status_code": 200,
  "latency_ms": 120,
  "method": "POST",
  "user_agent": "curl/7.85.0"
}
Note: For instructions on ingesting logs into OpenObserve, refer to the log ingestion guide to set up streams and push data.
Step 2: Define a Template
In OpenObserve:
- Go to Management > Templates.
- In the Add Templates page, click Webhook for slack alerts.
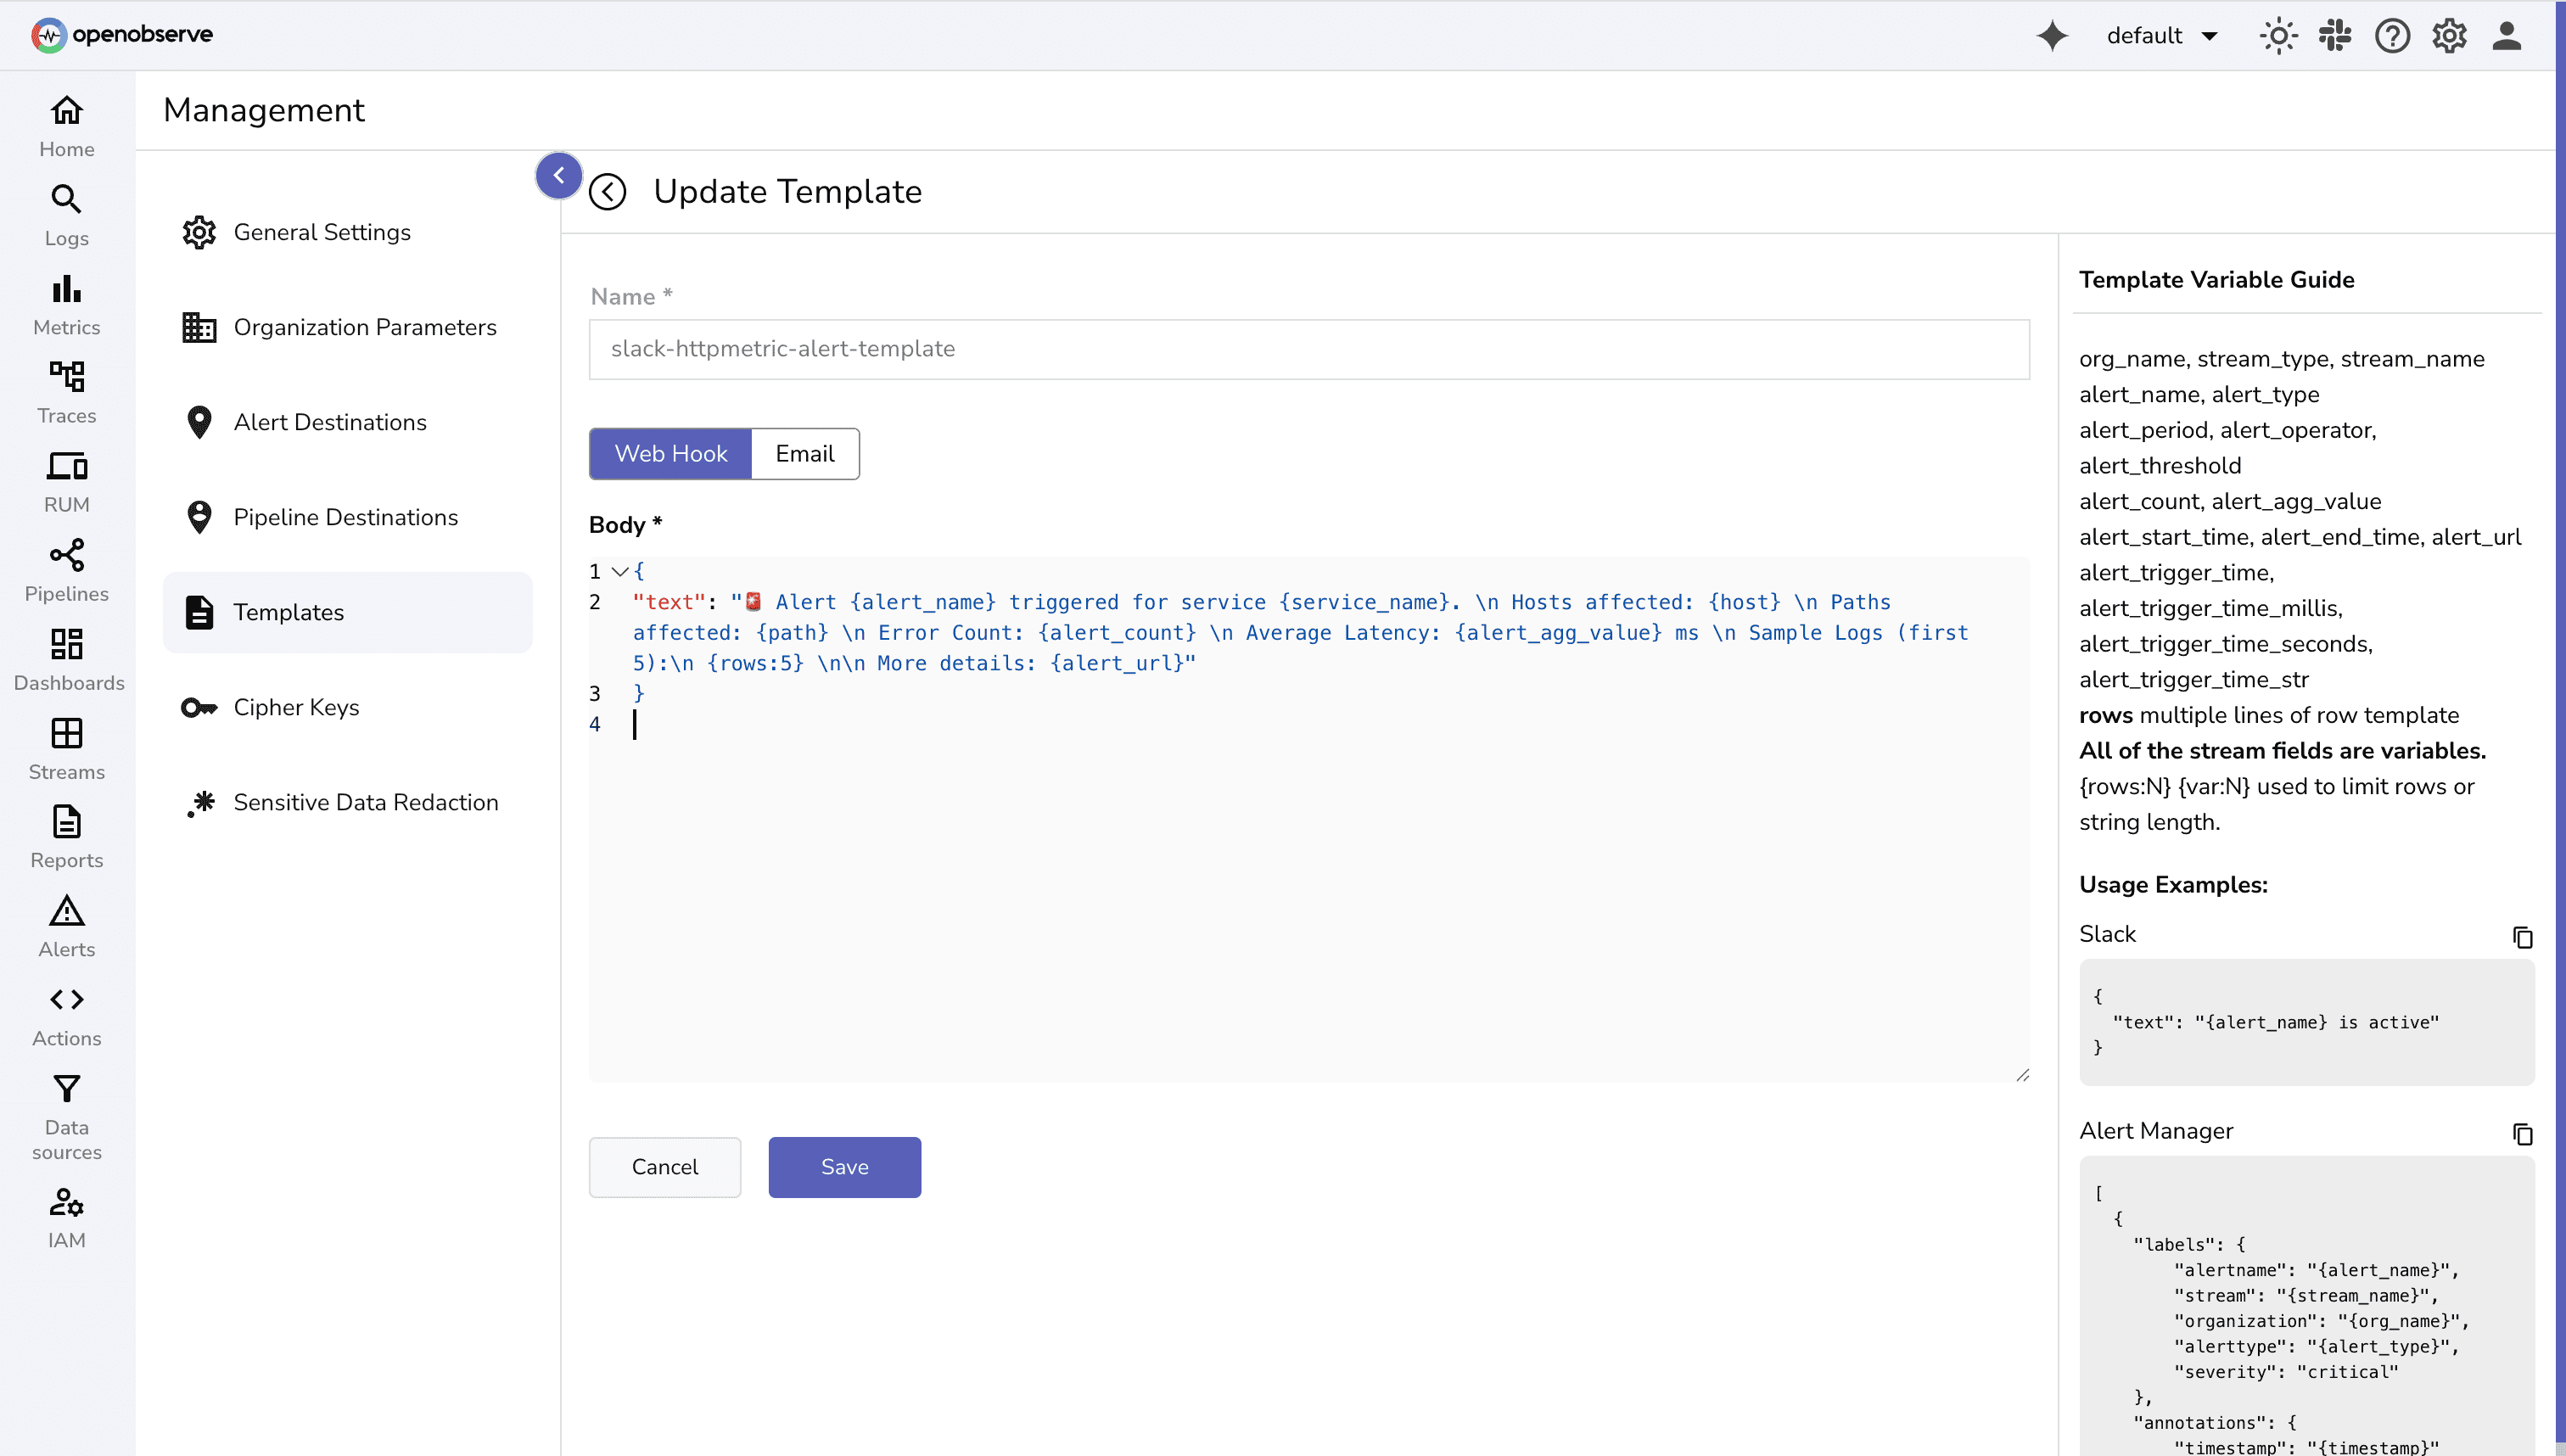
- Use template variables to include key HTTP metrics and context in notifications:
{
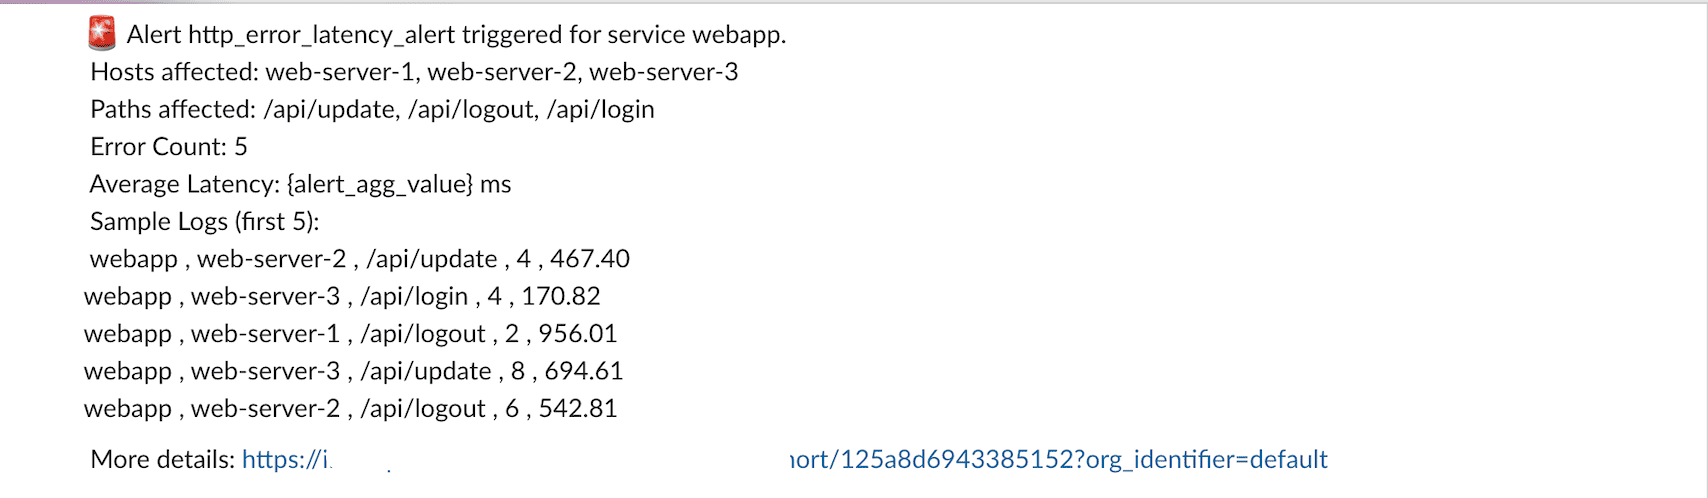
"text": "🚨 Alert {alert_name} triggered for service {service_name}. \n Hosts affected: {host} \n Paths affected: {path} \n Error Count: {alert_count} \n Average Latency: {alert_agg_value} ms \n Sample Logs (first 5):\n {rows:5} \n\n More details: {alert_url}"
}
OpenObserve has alert templates for different destinations like Pagerduty, Teams, emails, and more.
Step 3: Set Up a Destination
For this demo we will be using slack destination.
- Create a Slack app and enable Incoming Webhooks.
- Copy the generated webhook URL.
- In OpenObserve:
- Go to Management > Alert Destinations.
- In the Add Destination page, click Webhook.
- Create a destination using that URL.
- Select the template you defined above to this destination.
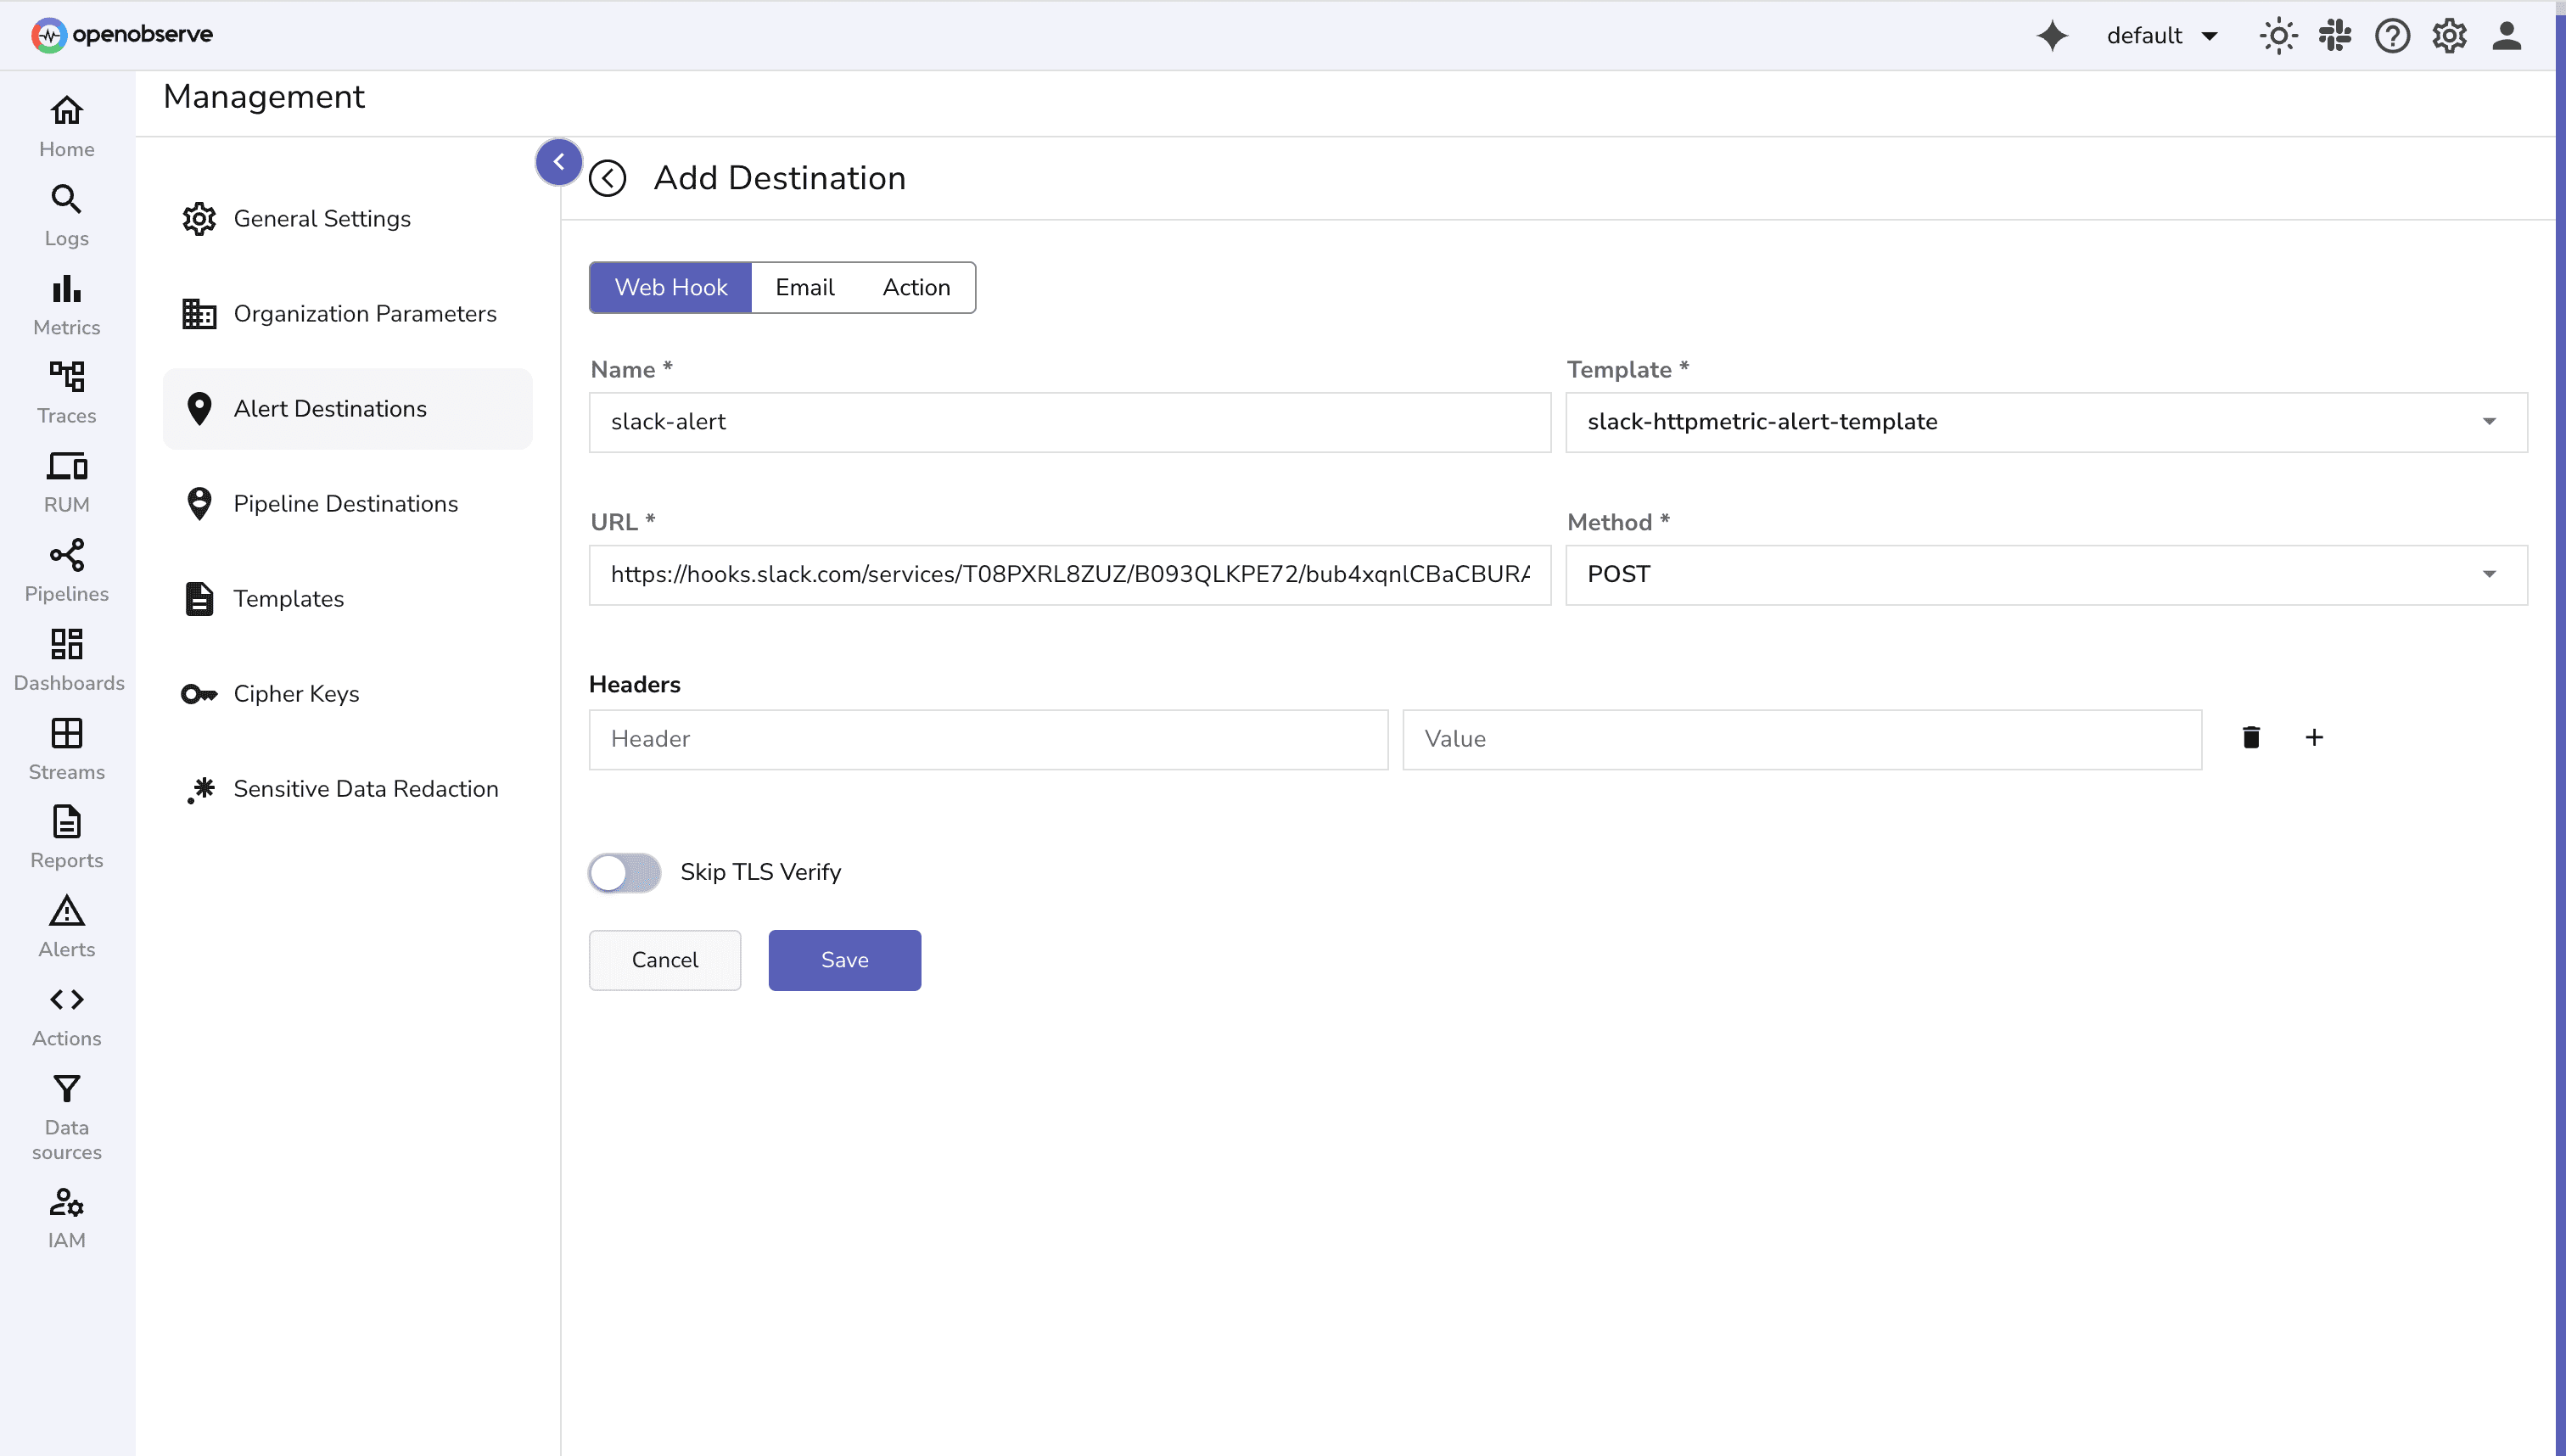
To configure different types of destinations for alerts in OpenObserve, check documentation.
- How to configure Email as alert destination
- How to configure PagerDuty as alert destination
- How to configure Telegram as alert destination
Step 4: Create a Scheduled Alert
We’ll create an alert to notify if there are multiple HTTP 5xx errors or high-latency requests.
- Move to alerts tab, and Add Alert
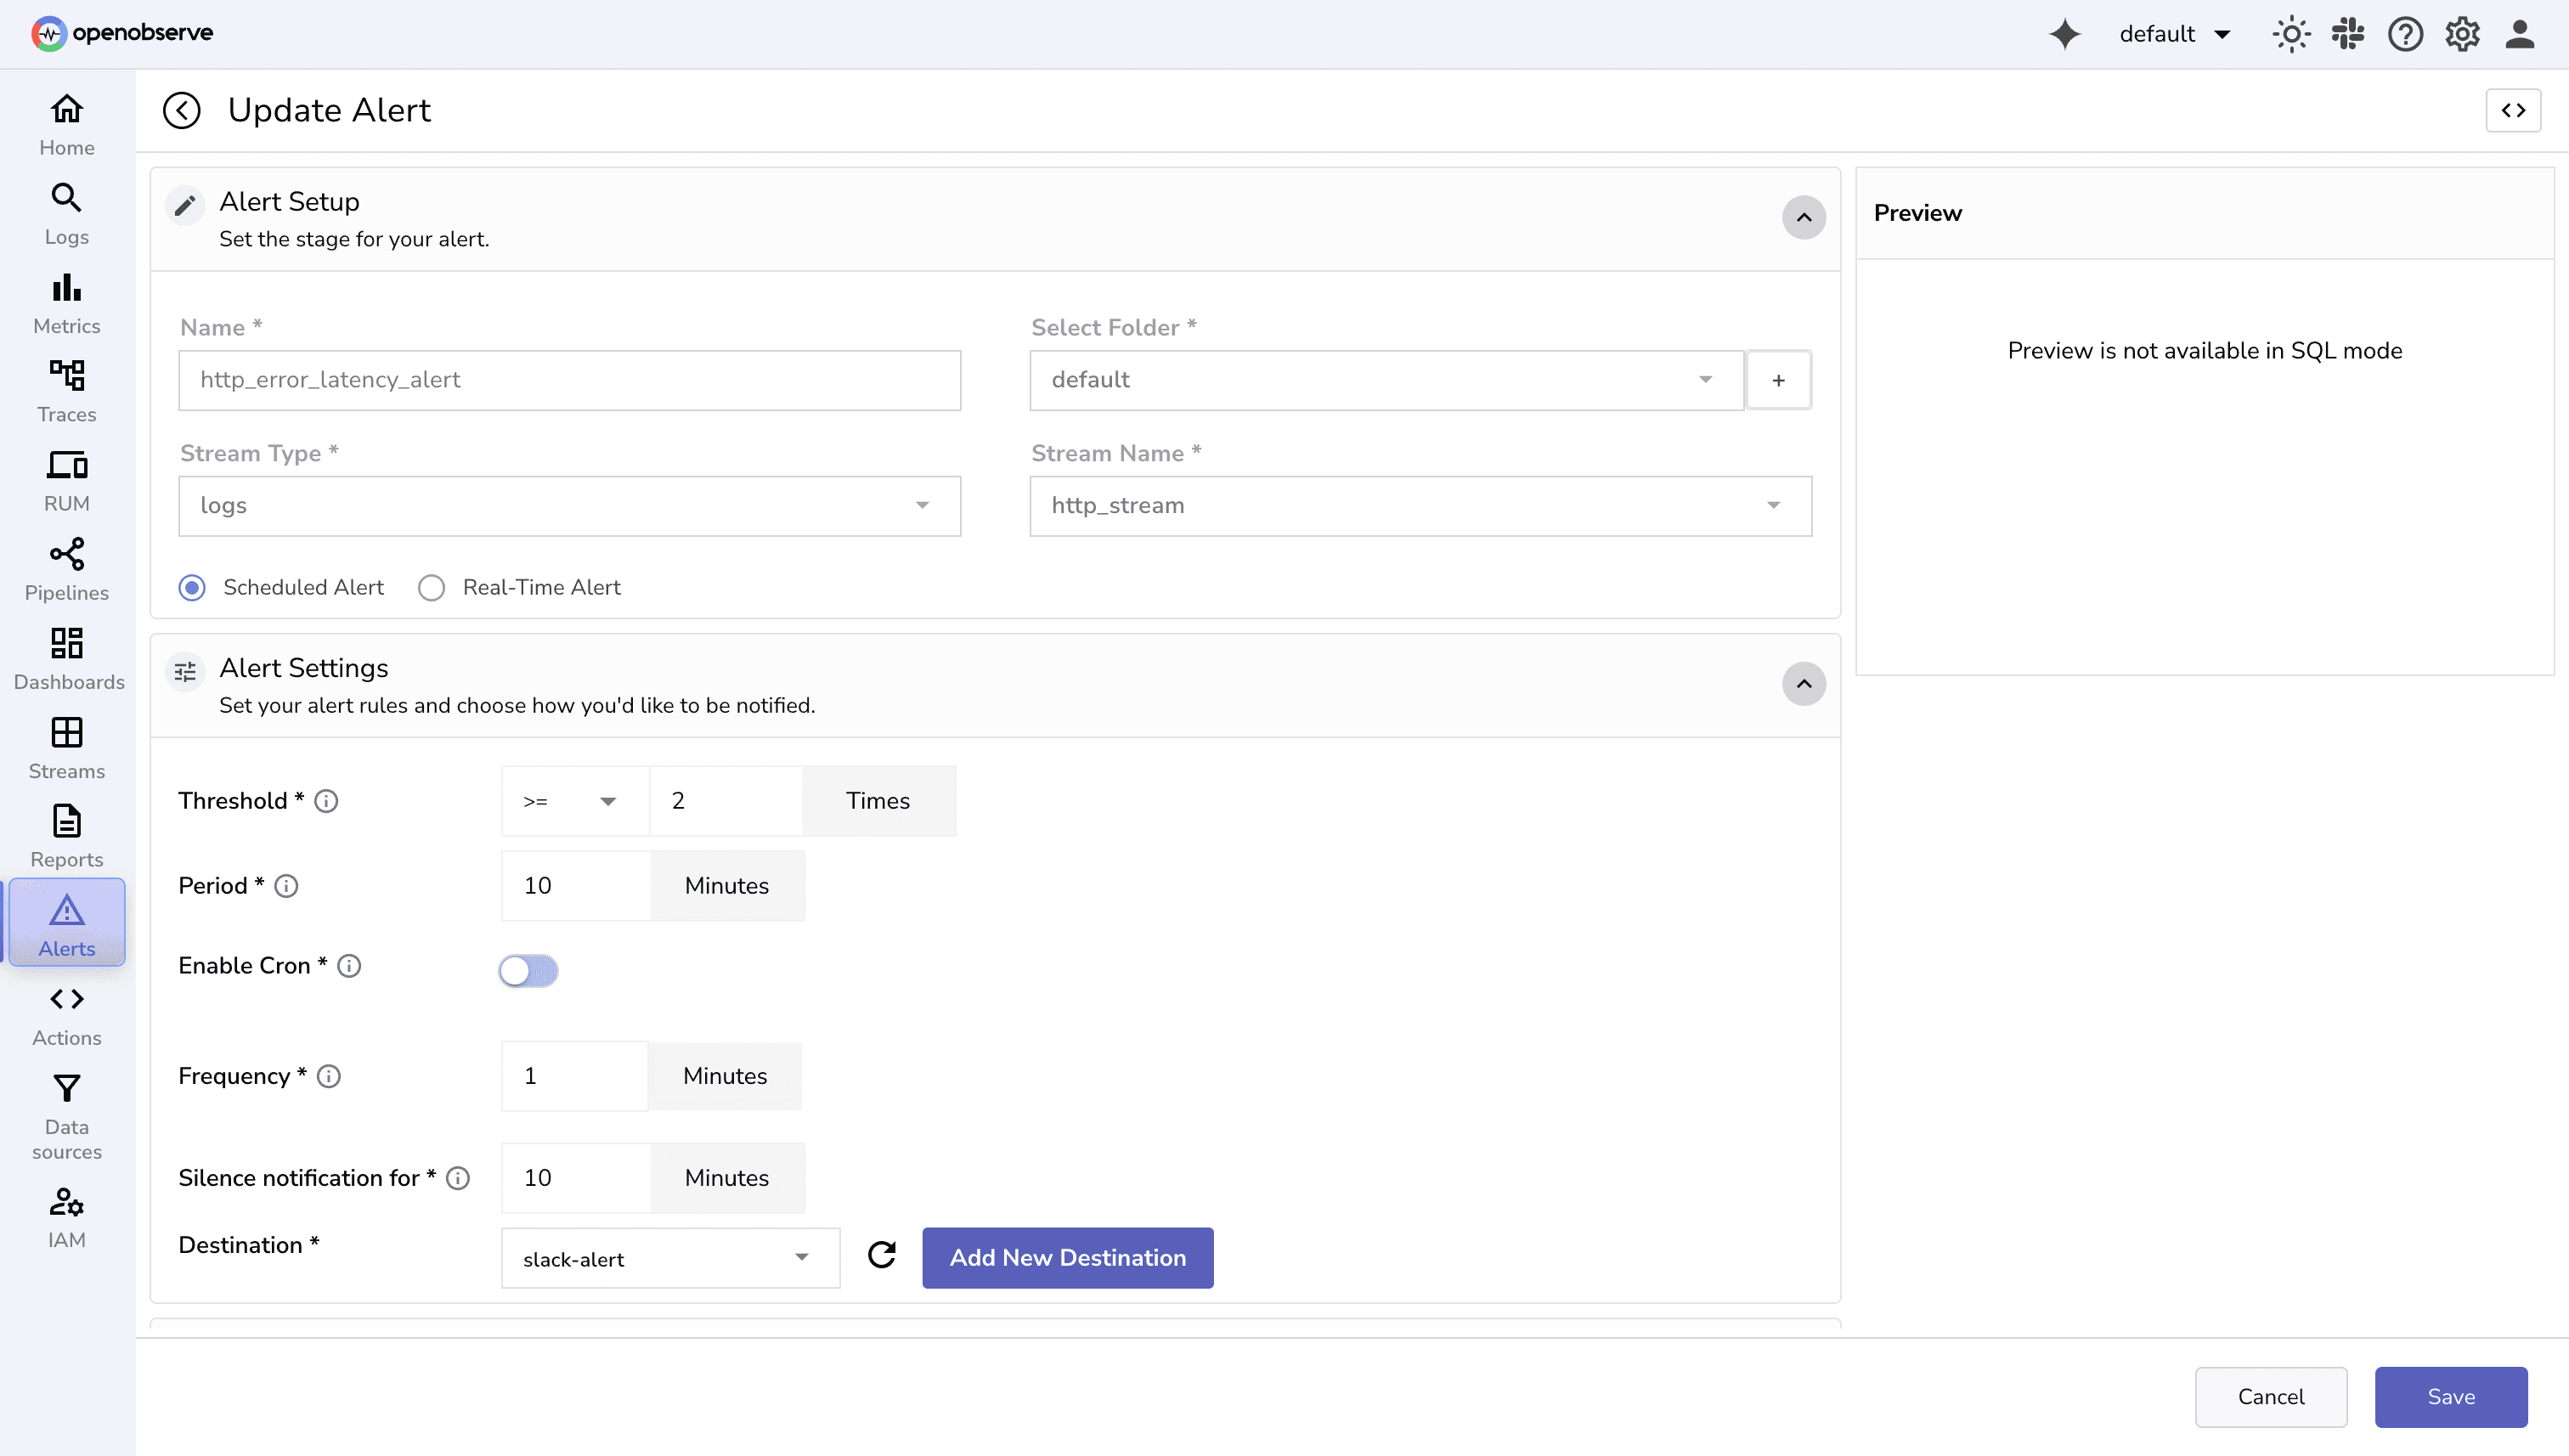
- Specify Alert Configuration:
- Name:
http_error_latency_alert - Stream:
http_stream - Alert Destination created before
- Frequency: Say Every 1 minute
- Period: Last 10 minutes
- Silence Period: 10 minutes (to avoid repeated notifications)
- Threshold: Say 2 or more times
- Name:
- Query (SQL mode):
SELECT service_name, host, path , COUNT(*) AS error_count, AVG(latency_ms) AS avg_latency
FROM http_stream
WHERE status_code >= 500
GROUP BY host, path, service_name
HAVING error_count > 3 OR avg_latency > 500
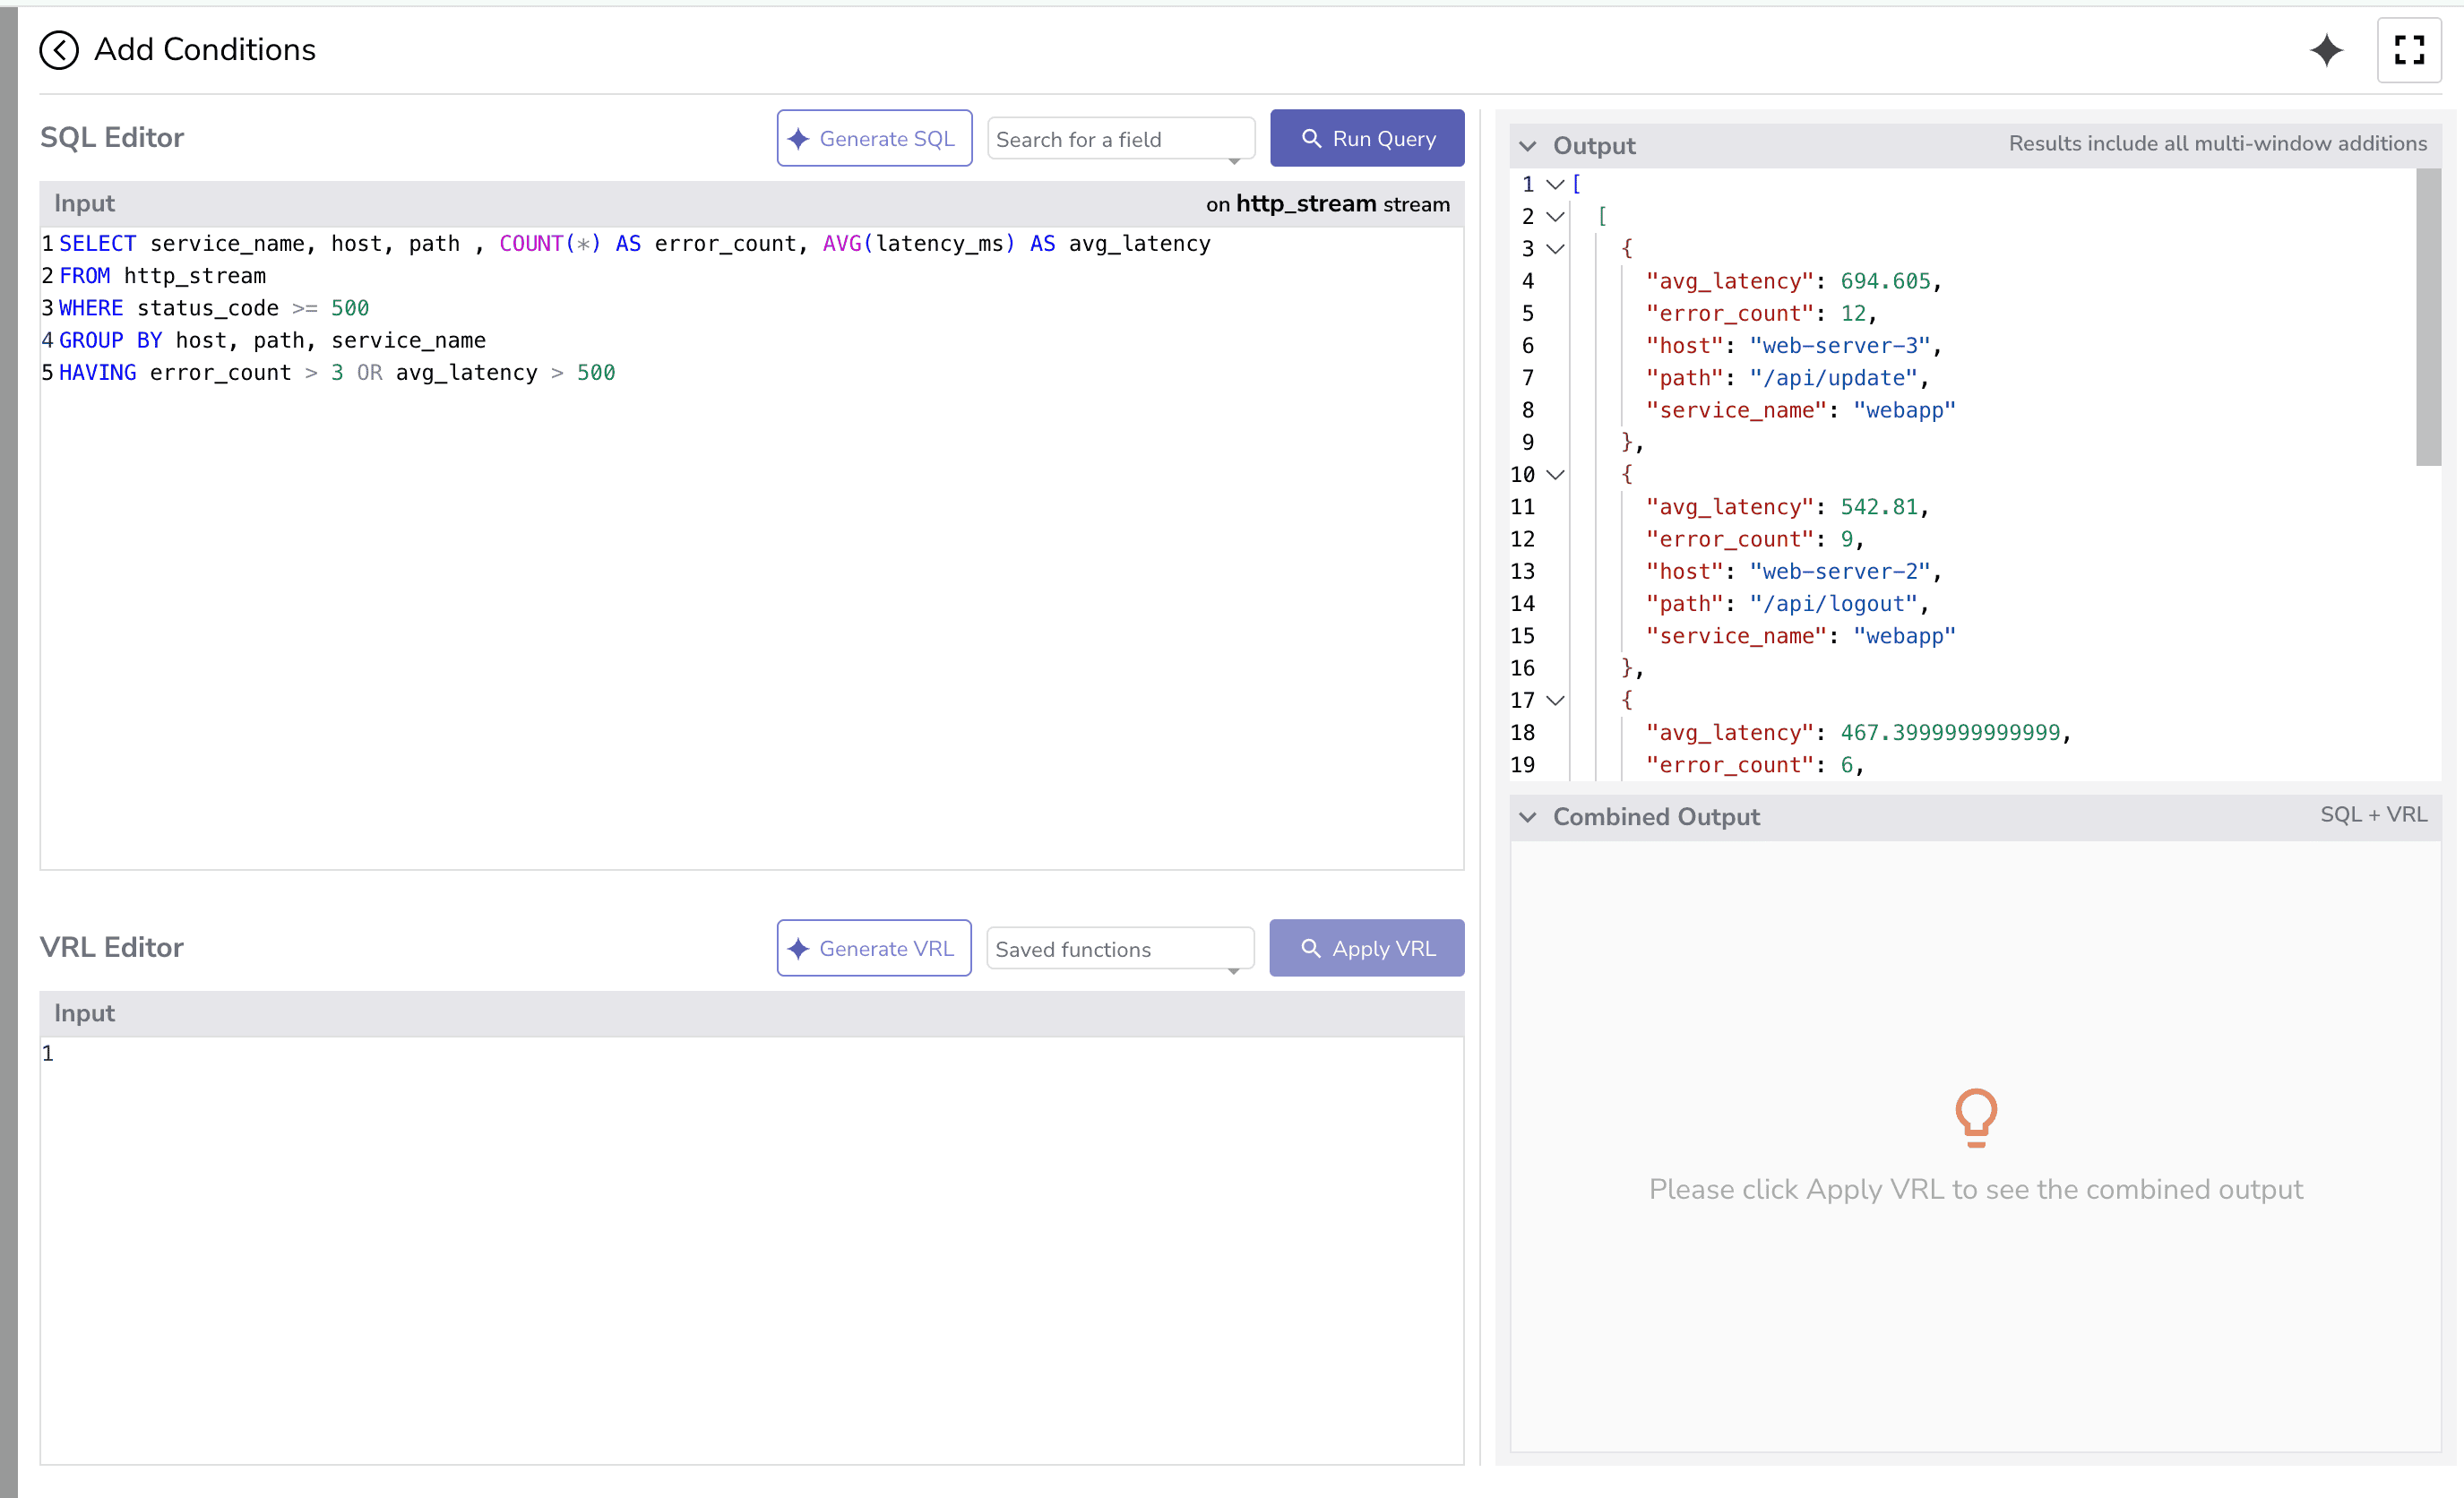
Here’s what each part does:
WHERE status_code >= 500- Filters rows first: only HTTP responses with status ≥ 500 (server errors) are considered.
SELECT COUNT(*) AS error_count, AVG(latency_ms) AS avg_latency- Aggregates the filtered rows: counts how many errors (
error_count) and calculates the average latency (avg_latency).
- Aggregates the filtered rows: counts how many errors (
HAVING error_count > 3 OR avg_latency > 500Filters after aggregation.
Only returns a result if the count of errors > 3 or the average latency > 500.
If neither condition is true, the query returns no rows, even though some rows exist in the table.
This configuration triggers the alert when either:
- More than 3 HTTP 5xx responses occur in the period, or
- The average latency exceeds 500 ms.
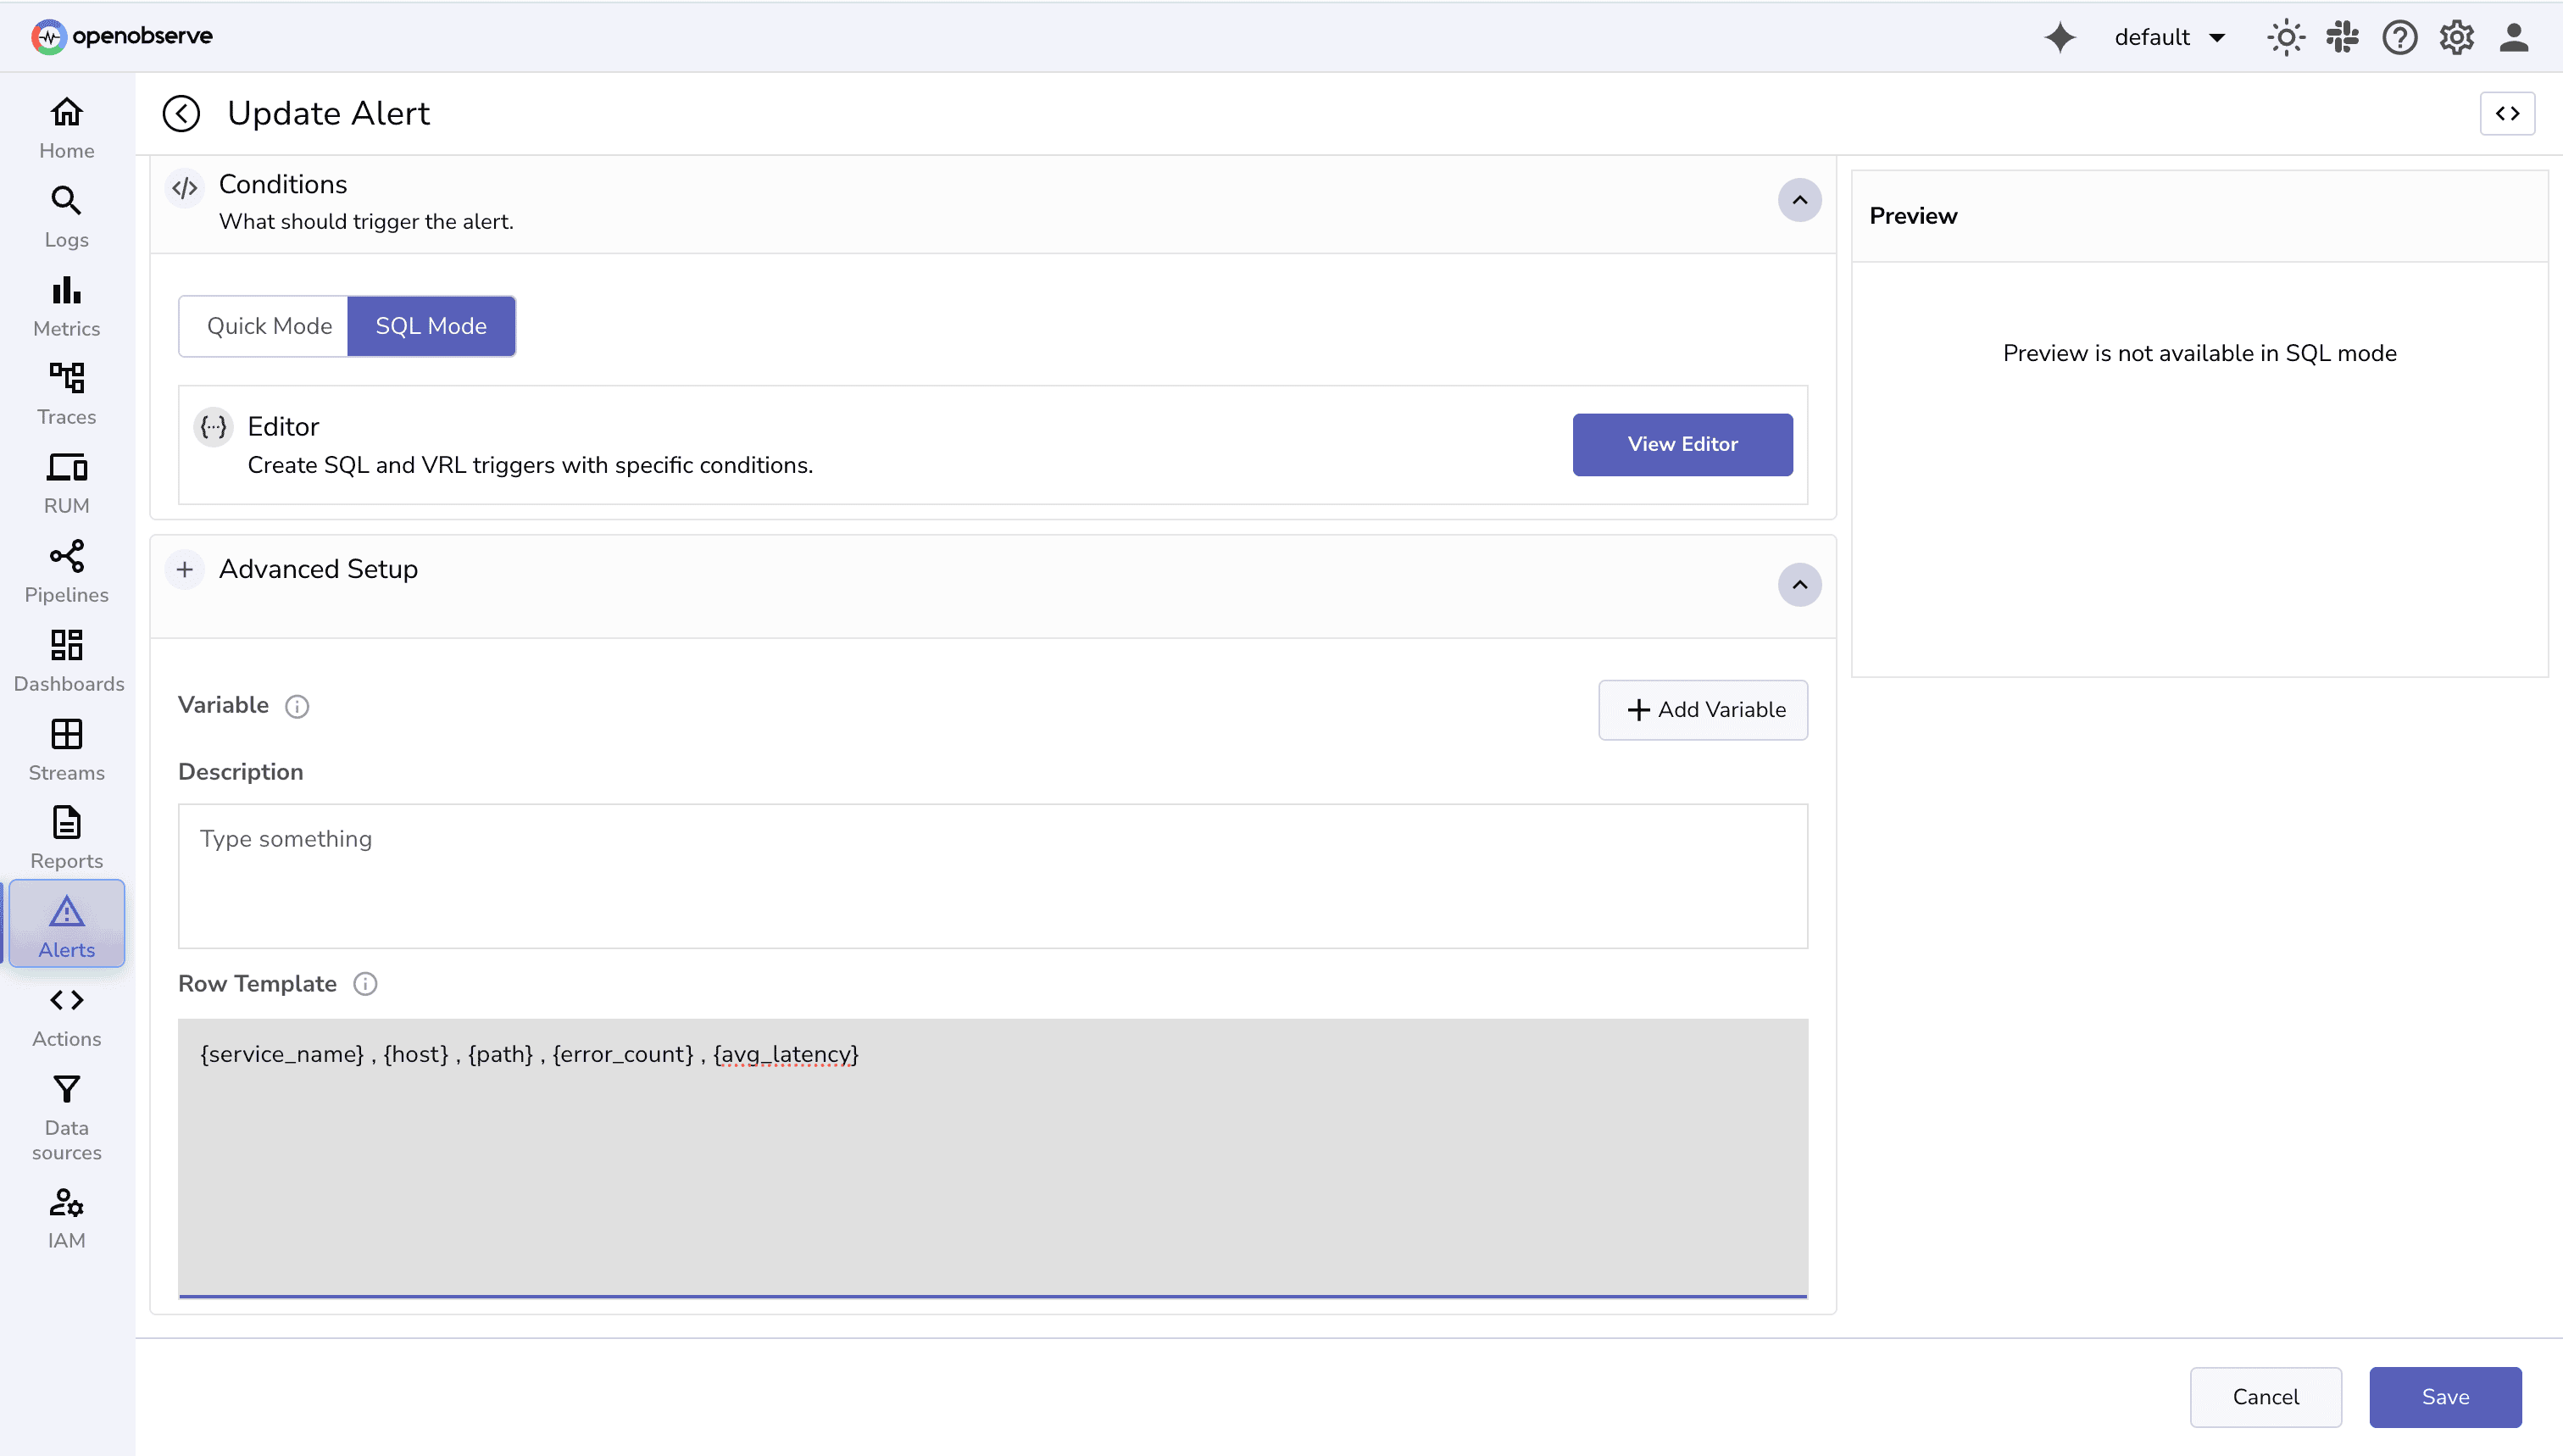
Do specify the row template with the variables you want to include in the alert rows:
Tip: For more advanced scenarios, you can use multi-window evaluation to check multiple overlapping time periods. This helps catch issues that persist across different intervals, ensuring alerts trigger for both short-term spikes and longer-term trends.
See: Multi-Window Selector for Scheduled Alerts
Step 5: Fire Test Logs
Send multiple log entries within a short time window (5 or more in 2 minutes). Once the threshold condition is met, the alert will trigger and post a message to your Slack channel.
Example Slack output:
Alert Best Practices
- Use variables in templates for clarity.
- Limit the number of rows in messages to avoid overload.
- Combine real-time and scheduled alerts strategically.
- Send alerts to multiple destinations as needed.
- Include URLs for quick debugging.
Conclusion
OpenObserve’s alerting system is flexible, powerful, and easy to extend. By combining alerts, templates, and destinations, you can ensure that your team receives meaningful, actionable notifications without being overwhelmed by noise. The demo above shows the complete cycle, making it easier to implement in real scenarios.
Start small, test with a few critical events, and scale up your alerting strategy gradually to cover all critical observability needs.For more in-depth guidance, check out:
- Import and Export Alerts – Easily move alerts between environments.
- Alert Conditions – Learn about quick mode and defining precise thresholds.
- Multi-Window Selector & Scheduled Alerts – Fine-tune alert evaluation windows.
- Telegram Alert Notifications – See a practical messaging integration.
- PagerDuty Integration – Automate incident creation for on-call teams.
- Email Alerts Setup – Configure standard notifications for your team.
Take your alerting to the next level with SLO-based alerts in OpenObserve. Read here to learn how to set up error-budget-driven alerts and keep your services reliable.
Get Started with OpenObserve Today!
Sign up for a 14 day cloud trial. Check out our GitHub repository for self-hosting and contribution opportunities.
About the Author
Simran Kumari

Passionate about observability, AI systems, and cloud-native tools. All in on DevOps and improving the developer experience.
Follow OpenObserve on Google
Add OpenObserve as a preferred source to see more of our articles in Google Search and Top Stories.












