Top 10 Dynatrace Alternatives in 2026: Complete Comparison Guide




Ready to get started?
Try OpenObserve Cloud today for more efficient and performant observability.
Dynatrace is one of the most powerful observability platforms on the market. Its signature OneAgent auto-instrumentation, the AI-powered Davis engine, and enterprise-grade support for complex hybrid environments have made it a go-to choice for large organizations. But "powerful" doesn't always mean "the right fit."
As engineering teams evolve toward cloud-native architectures, OpenTelemetry standards, and tighter observability budgets, a growing number of organizations are actively evaluating Dynatrace alternatives. Whether you're a lean startup, a mid-size SaaS company, or an enterprise looking to reduce vendor lock-in, this guide is for you.
TL;DR
OpenObserve is the best Dynatrace alternative in 2026. It delivers unified logs, metrics, and traces in a single platform with no DDU billing, no per-user fees, OpenTelemetry-native ingestion, and full self-hosted or cloud deployment.
- Best overall Dynatrace alternative: OpenObserve: unified observability, no DDU complexity, SQL-based querying
- Best for cost savings: OpenObserve: 60-90% cost reduction vs Dynatrace with no per-unit or per-user billing
- Best open-source alternative: OpenObserve: Apache 2.0 licensed, fully self-hostable, no feature gating
- Best for Kubernetes and cloud-native: OpenObserve: lightweight, CNCF-compatible, no heavyweight OneAgent required
- Best for OpenTelemetry migration: OpenObserve: native OTLP ingestion, migrate without touching application code
- Best for compliance and data sovereignty: OpenObserve: deploy on your own infrastructure, full data ownership
Why Teams Look for Dynatrace Alternatives
Despite its capabilities, several recurring pain points drive teams away from Dynatrace:
1. DDU Pricing Complexity
Dynatrace's Davis Data Unit (DDU) billing model makes cost forecasting extremely difficult. Dashboard queries, alert evaluations, log ingestion, and metric processing all consume DDUs in opaque ways frequently resulting in bill shock at the end of the month.
2. Vendor Lock-In
Dynatrace's proprietary OneAgent and closed data formats make migrating to other platforms a significant investment. This discourages teams from exploring alternatives even when dissatisfied, creating a classic lock-in trap.
3. Steep Learning Curve
Mastering DQL (Dynatrace Query Language), Smartscape topology, and full platform configuration requires weeks of dedicated onboarding. For smaller or faster-moving teams, this is a real productivity barrier.
4. Not Suited for Lean or Cloud-Native Stacks
Dynatrace is designed for large, complex enterprises. Startups and mid-size teams often find it overpowered and expensive relative to their actual observability footprint especially in Kubernetes-first environments where lighter tooling excels.
5. OpenTelemetry Preference
As CNCF's OpenTelemetry becomes the de-facto instrumentation standard, teams want observability backends that natively support OTLP without proprietary agent translation layers. Dynatrace's support remains partial and agent-centric.
6. Limited Developer Experience
Many engineers find Dynatrace's UI optimized for operations managers and SRE leads rather than hands-on debugging by individual developers a frustration particularly common on developer-centric teams.
What to Look for in a Dynatrace Alternative
Before choosing a replacement, evaluate these critical dimensions:
| Criterion | Why It Matters | What to Evaluate |
|---|---|---|
| Unified Observability | Reduces tool sprawl | Single pane for metrics, logs, traces, and RUM |
| Transparent Pricing | Budget predictability | No DDU surprises; clear cost per GB or host |
| OTel Support | Vendor-neutral instrumentation | Native OTLP ingestion without agent translation |
| Auto-Instrumentation | Reduces developer burden | Automatic service discovery and dependency mapping |
| AI/ML Insights | Faster root cause analysis | Anomaly detection, baselines, causal AI |
| Scalability | Grows with your infrastructure | High cardinality, high ingest volume performance |
| Deployment Flexibility | Compliance and data control | SaaS, self-hosted, or hybrid options |
| Migration Ease | Minimizes downtime and rewrites | OTel compatibility, import tools, phased rollout support |
| Community & Ecosystem | Long-term platform viability | Integrations, plugins, GitHub activity, documentation quality |
Top 10 Dynatrace Alternatives
1. OpenObserve
Type: Open Source · Self-Hosted / Cloud
Best For: Cost-conscious engineering teams, cloud-native and Kubernetes environments
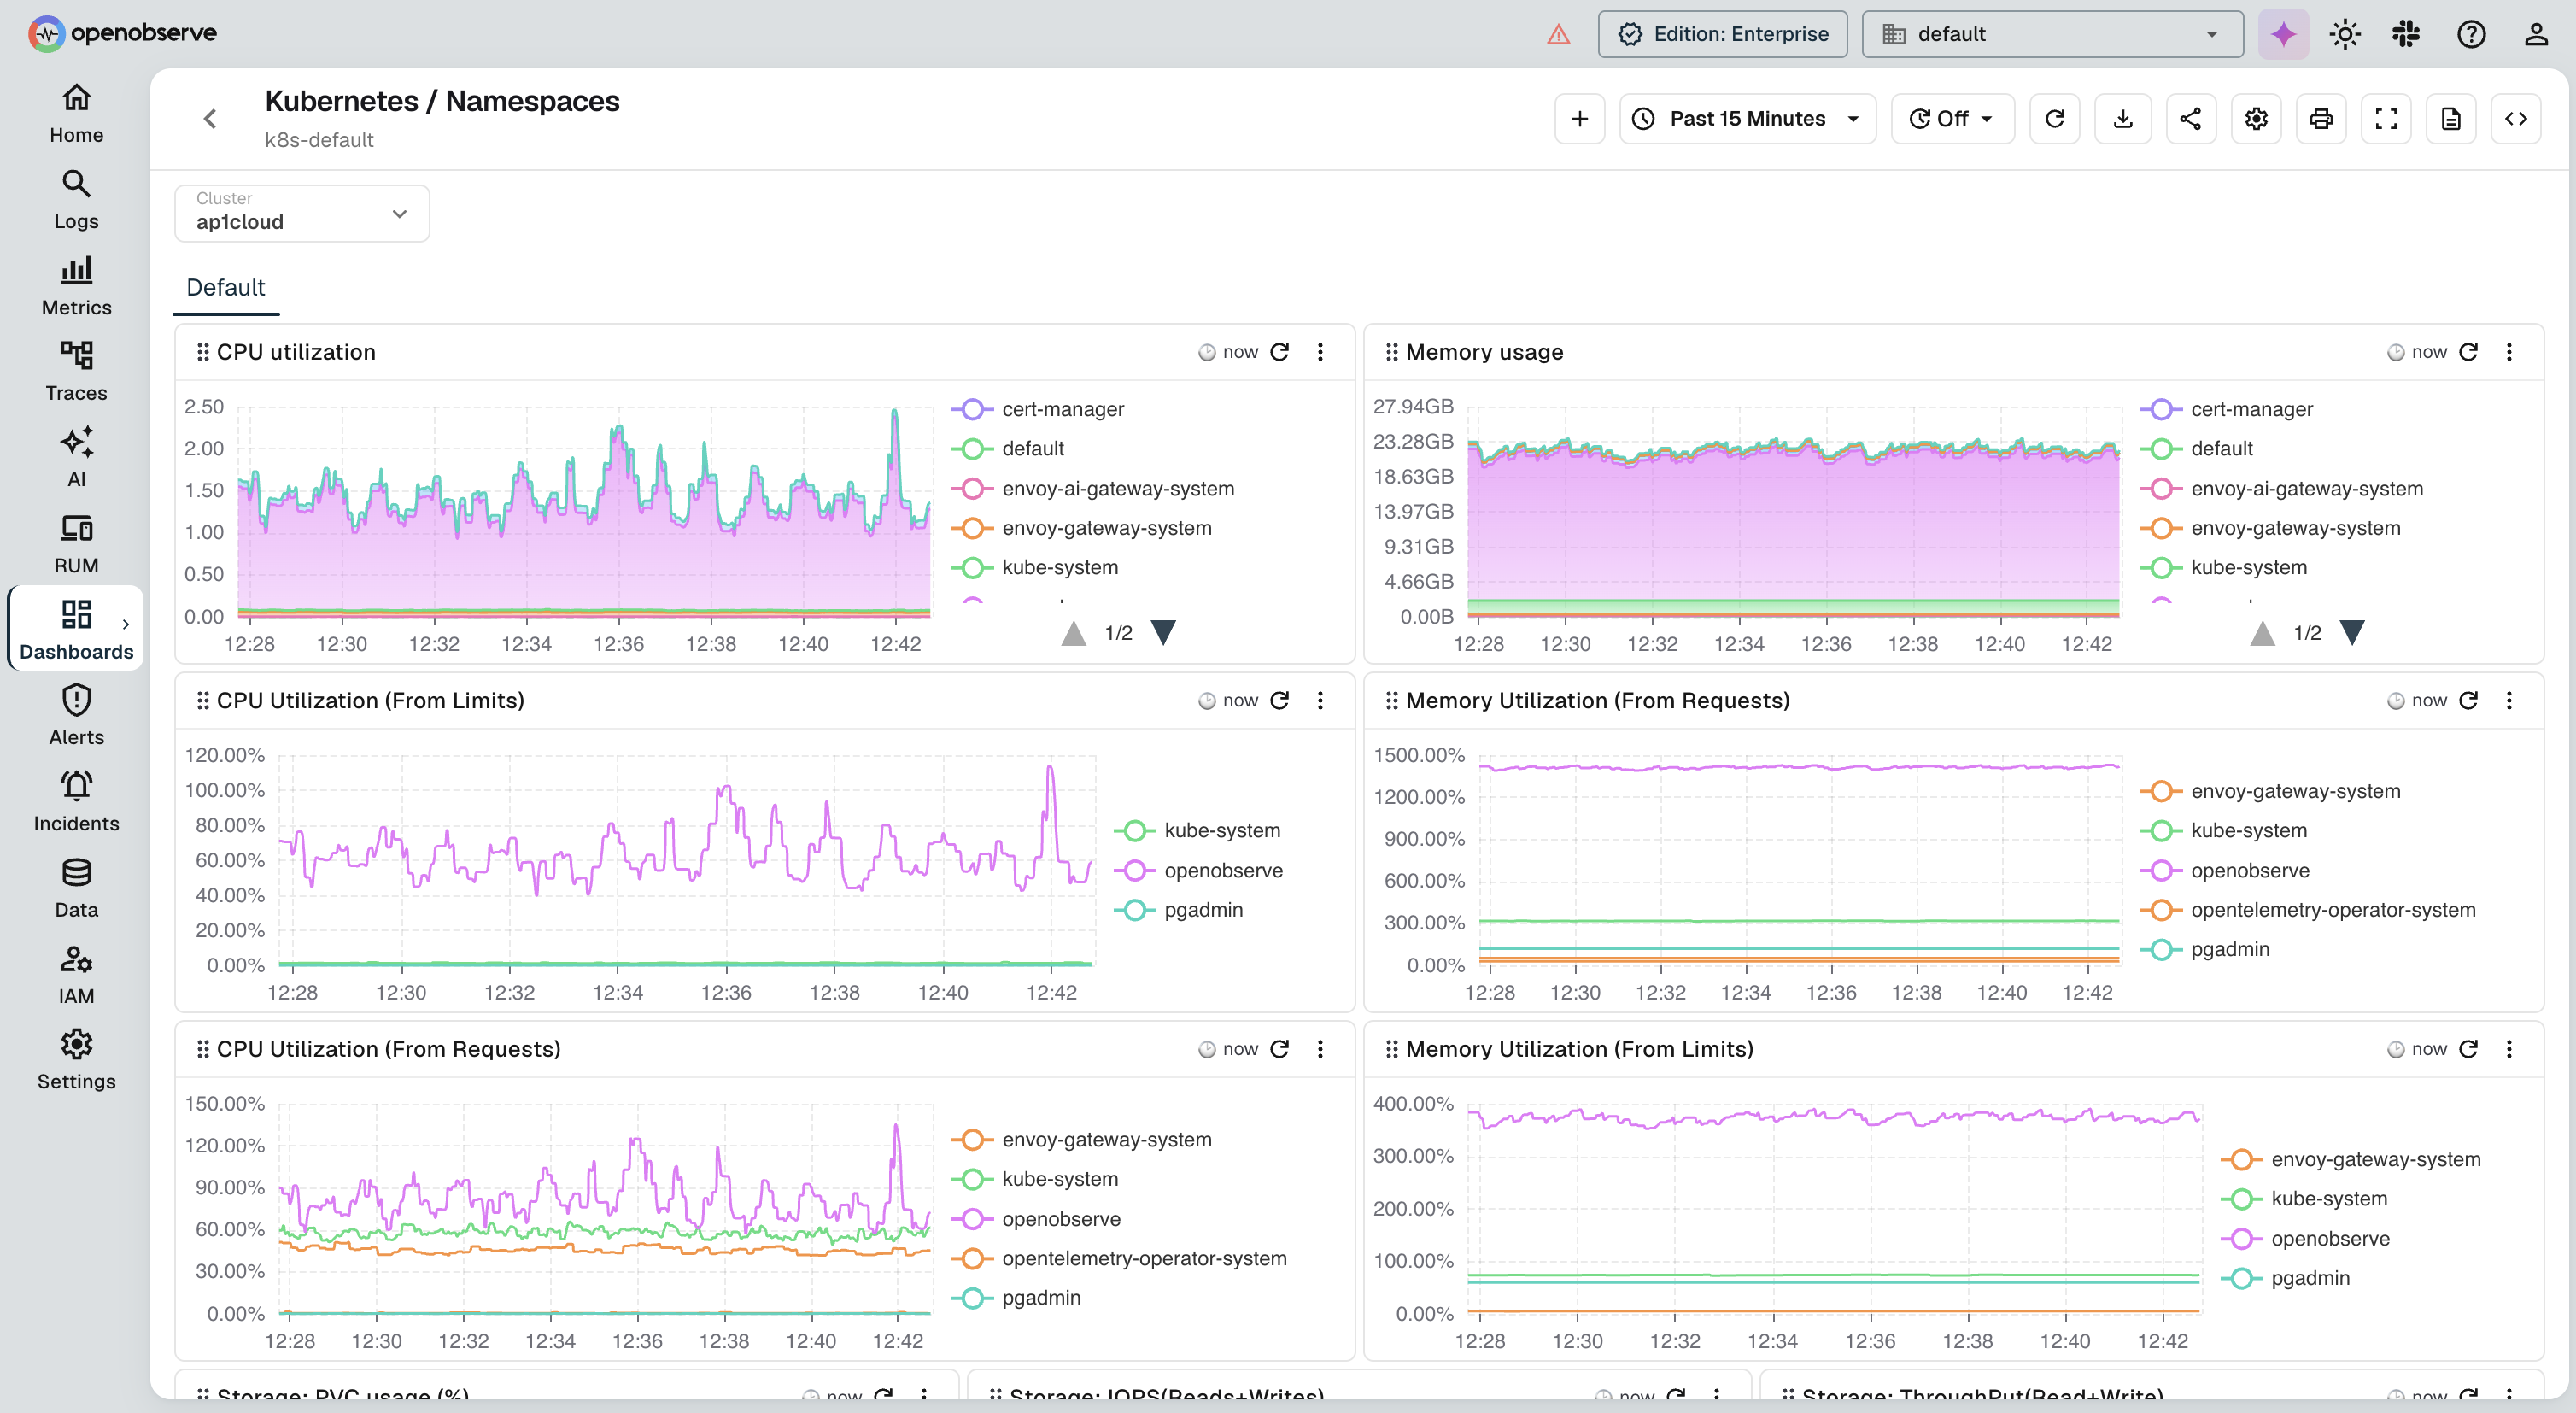
OpenObserve is the leading open-source observability platform for teams seeking a true Dynatrace alternative without vendor lock-in, DDU billing, or proprietary agents. It provides unified logs, metrics, and traces in a single platform with highly efficient storage compression, delivering 60-90% cost savings compared to commercial alternatives like Dynatrace.
Unlike Dynatrace's opaque DDU model, OpenObserve offers a transparent, usage-based pricing structure with no per-user fees. Its SQL-based query language is far more accessible than DQL, and its native OpenTelemetry ingestion means your existing instrumentation works from day one without any agent replacement.
OpenObserve Pros
- No DDU or per-user licensing entire team access included
- Approximately 140x lower storage costs in typical log workloads compared to Elasticsearch-based stacks; actual results vary based on data entropy and cardinality
- OpenTelemetry-native works with existing OTel collectors instantly
- SQL-based queries; no need to learn DQL or NRQL
- Unified logs, metrics, and traces in one platform
- Self-hosted or managed cloud for full data residency control
- Pre-built dashboards for Kubernetes, AWS, GCP, and more
- Predictable, usage-based pricing with no surprise charges
- Synthetic Monitoring: scheduled uptime, API, and browser checks from public or private locations, plus status pages
OpenObserve Cons:
- Smaller integration marketplace compared to Dynatrace
- Newer platform with growing enterprise feature set
Migration Tip: OpenObserve accepts data from the OpenTelemetry Collector via OTLP. You can dual-export to both Dynatrace and OpenObserve during a phased migration to validate parity before full cutover.
2. Datadog
Type: SaaS · Enterprise
Best For: Enterprises wanting feature-rich commercial observability with a more developer-centric UX
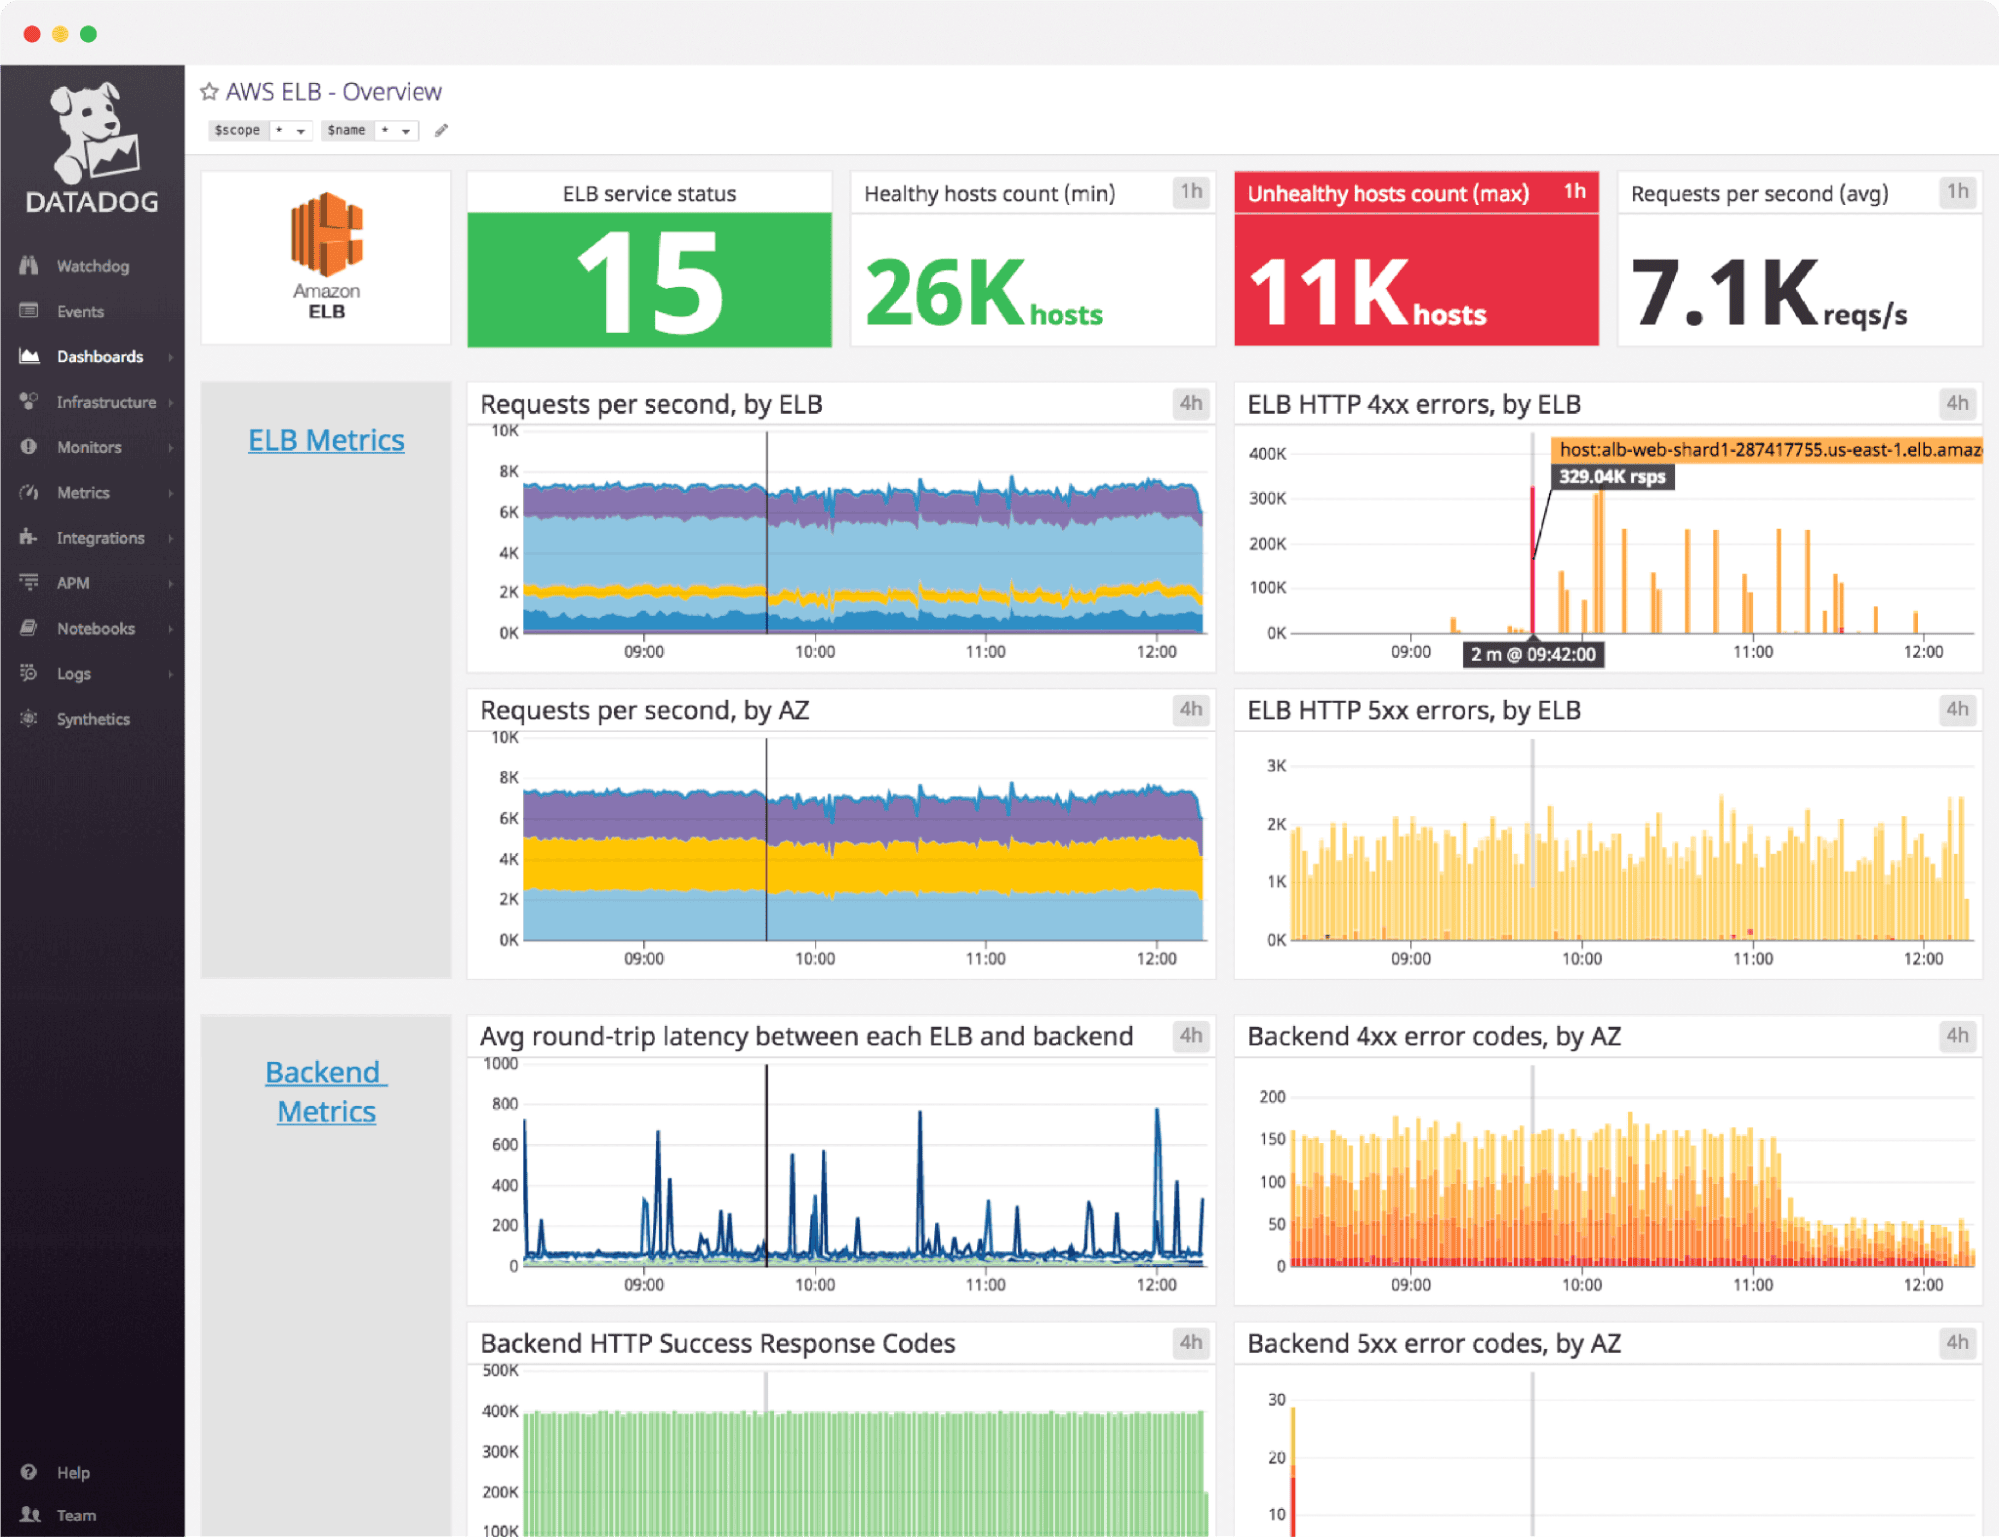
Datadog is Dynatrace's most direct commercial competitor in the enterprise observability space. It offers a comprehensive platform spanning infrastructure monitoring, APM, log management, distributed tracing, security monitoring, real user monitoring (RUM), and synthetics all unified in a single SaaS interface with 900+ integrations.
Compared to Dynatrace, Datadog tends to be more developer-friendly and easier to get started with, while offering similar depth across cloud and hybrid environments. The trade-off is cost: Datadog can become equally or more expensive at scale.
Datadog Pros:
- 900+ integrations broadest ecosystem of any commercial platform
- Excellent APM with distributed tracing and code-level profiling
- Built-in security monitoring (CSPM, SIEM) alongside observability
- Strong RUM and synthetics capabilities
- More intuitive developer experience than Dynatrace
- Watchdog AI for automated anomaly detection
- 14-day free trial available
Datadog Cons:
- Can be as expensive or more costly than Dynatrace at scale
- Custom metrics charges create unpredictable billing at high cardinality
- Per-host pricing penalizes ephemeral cloud and serverless workloads
- Proprietary agents introduce some vendor lock-in
See our top Datadog alternatives guide and Datadog vs OpenObserve comparison for a deeper analysis.
3. New Relic
Type: SaaS · Full-Stack Observability
Best For: Teams moving away from Dynatrace's complexity who still want a feature-rich commercial SaaS platform
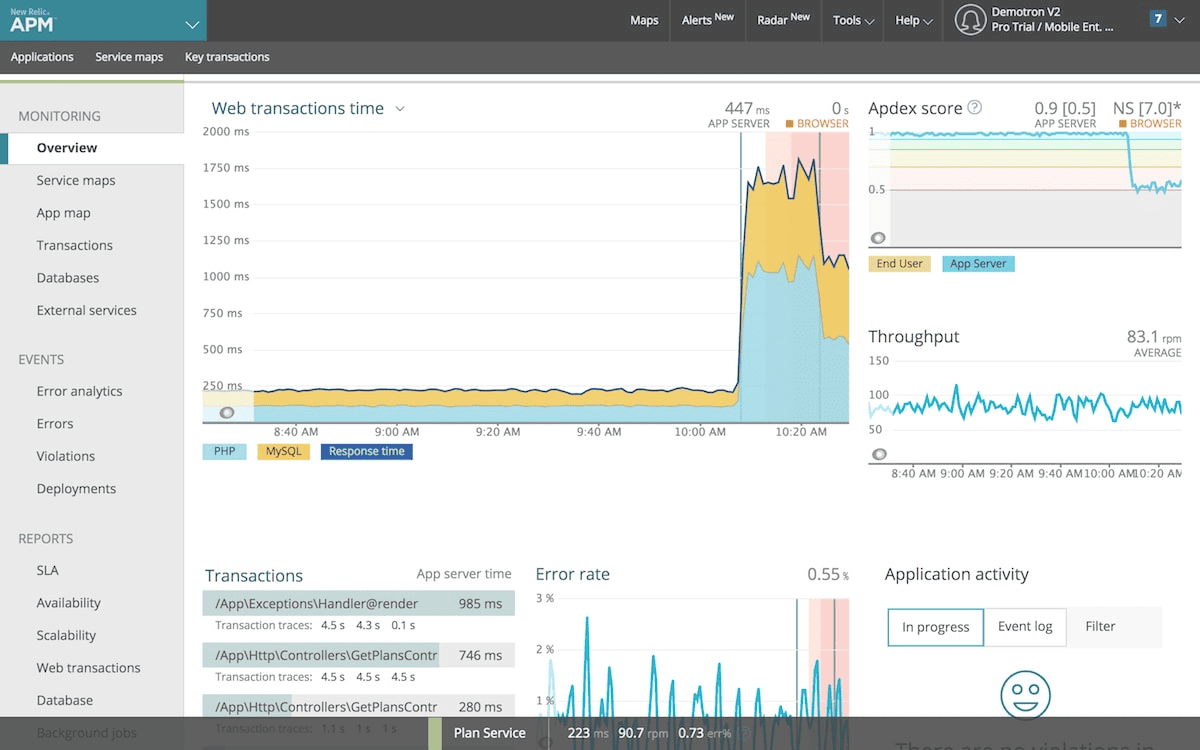
New Relic is a mature full-stack observability platform that covers APM, infrastructure, logs, traces, real user monitoring, and synthetic testing under one roof. With over 780 integrations and broad OpenTelemetry support, it is a strong commercial Dynatrace alternative particularly for teams wanting unified observability without Dynatrace's enterprise complexity.
New Relic's key strength is its powerful NRQL query language, which enables deep cross-signal analysis across all telemetry types from a single interface. It also has a more approachable learning curve than Dynatrace, making it easier to onboard large development teams.
New Relic Pros
- 780+ integrations and 50+ observability capabilities in one platform
- Strong APM with distributed tracing, error tracking, and profiling
- NRQL provides powerful ad-hoc cross-signal analysis
- OpenTelemetry support for partial vendor neutrality
- Generous free tier (100 GB/month + 1 free user)
- More approachable learning curve than Dynatrace
New Relic Cons
- Per-user pricing ($99/user/month) gets expensive for large teams
- CCU billing model introduces unpredictability similar to Dynatrace DDUs
- Less sophisticated AI-driven root cause analysis than Davis AI
- NRQL is proprietary less portable than SQL or PromQL
See our top New Relic alternatives guide for a full comparison of New Relic vs other platforms.
4. Grafana Stack
Type: Open Source · Self-Hosted / Grafana Cloud
Best For: Kubernetes-native organizations, DevOps teams with strong operational capacity, maximum vendor flexibility
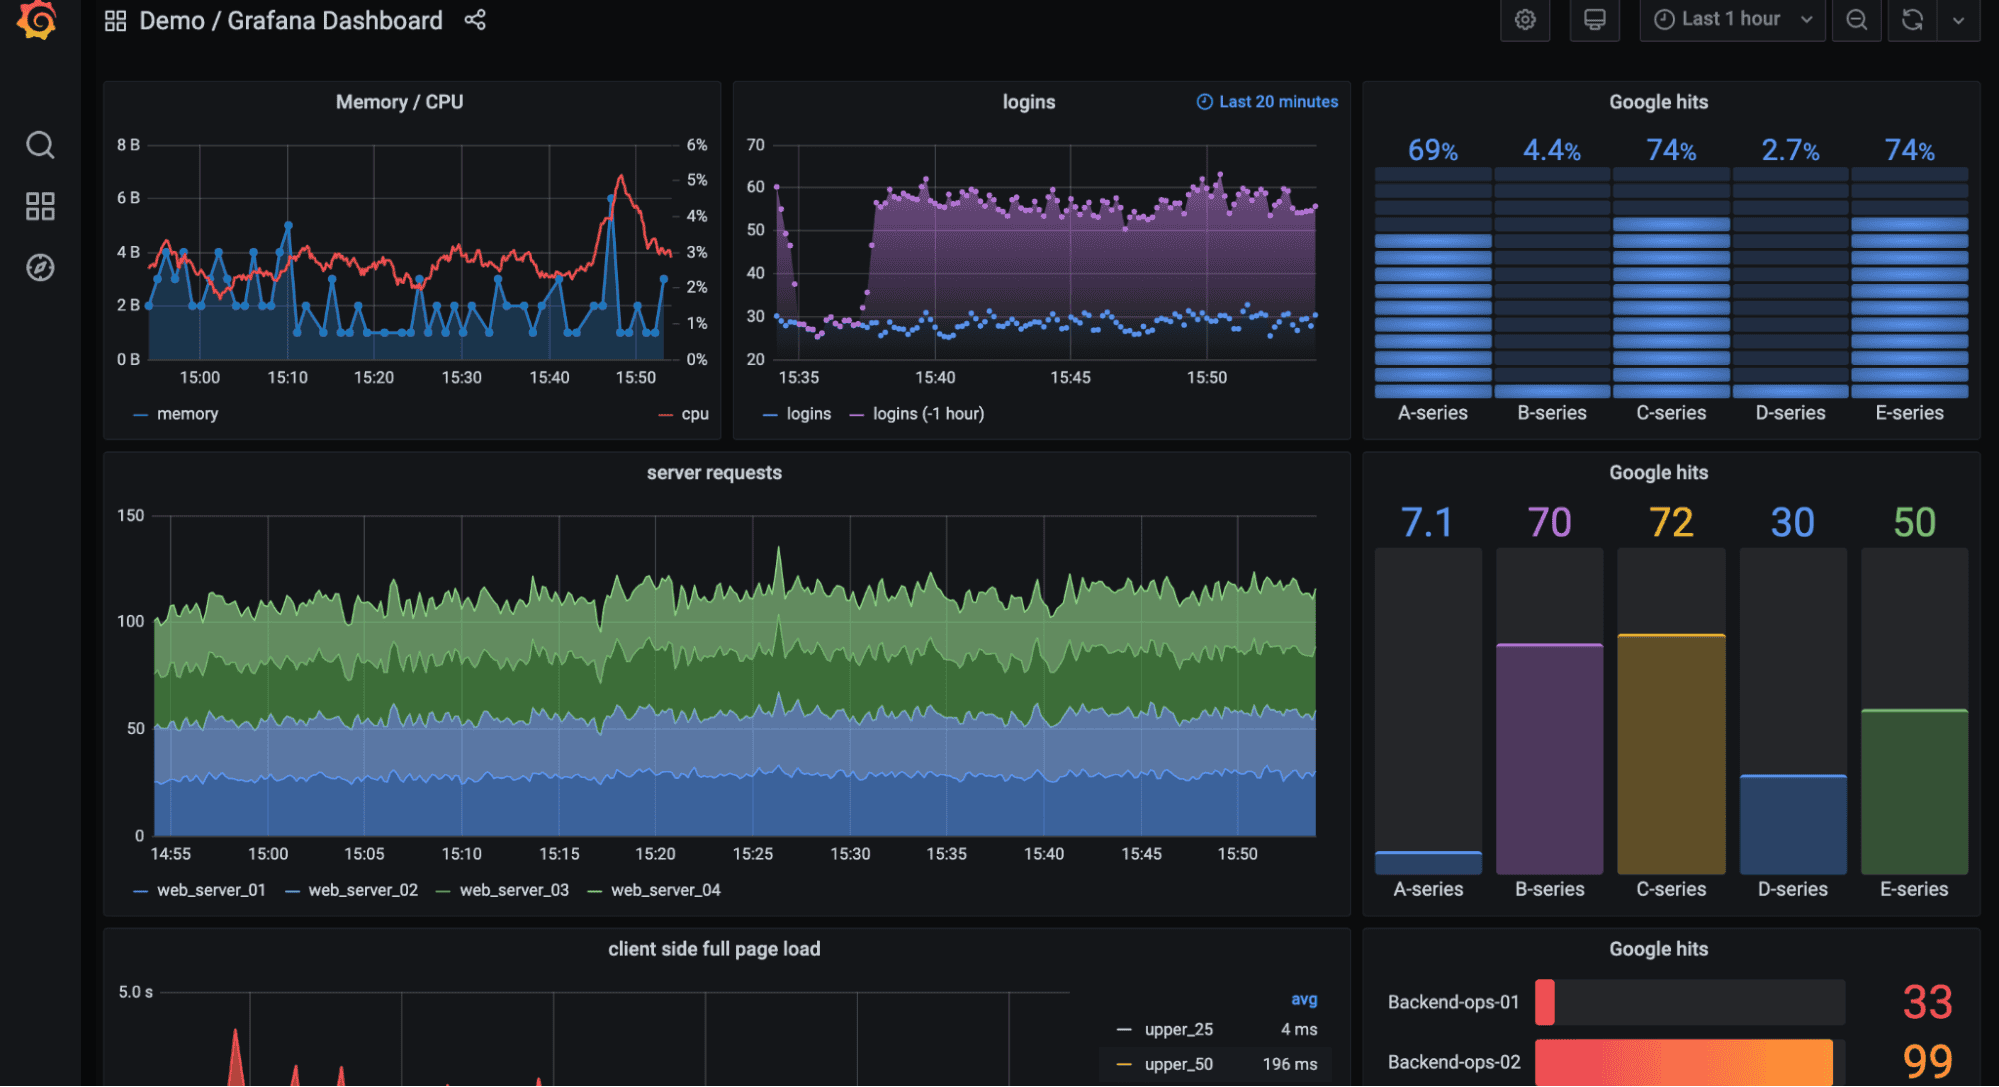
The Grafana Observability Stack built around Grafana, Prometheus, Loki, and Tempo is the most popular open-source Dynatrace alternative for cloud-native and Kubernetes-centric teams. Each component is a best-in-class tool for its respective signal type, and together they form a powerful, vendor-neutral observability platform.
Unlike Dynatrace's all-in-one opaque model, the Grafana stack is modular and transparent. Teams choose exactly what they ingest, store, and query. Grafana Cloud offers a fully managed path for teams who want open-source benefits without the operational overhead of self-managing multiple backends.
Grafana Pros
- Prometheus is the CNCF standard for Kubernetes and cloud metrics
- Grafana dashboards far exceed Dynatrace's visualization flexibility
- Fully open-source no proprietary formats or lock-in whatsoever
- Massive ecosystem: thousands of exporters, plugins, and integrations
- Grafana Cloud offers managed option to reduce operational burden
- Strong community; battle-tested at enormous scale globally
Grafana Cons
- Not a single product requires managing Prometheus, Loki, and Tempo separately
- No automated service discovery or one-click instrumentation like OneAgent
- Correlating data across tools requires significant configuration effort
- Multiple query languages (PromQL, LogQL, TraceQL) to learn
See our top Grafana alternatives guide and OpenObserve vs Grafana comparison for more detail.
5. Honeycomb
Type: SaaS · Distributed Tracing
Best For: Microservices teams needing deep distributed tracing, high-cardinality analysis, and fast incident debugging
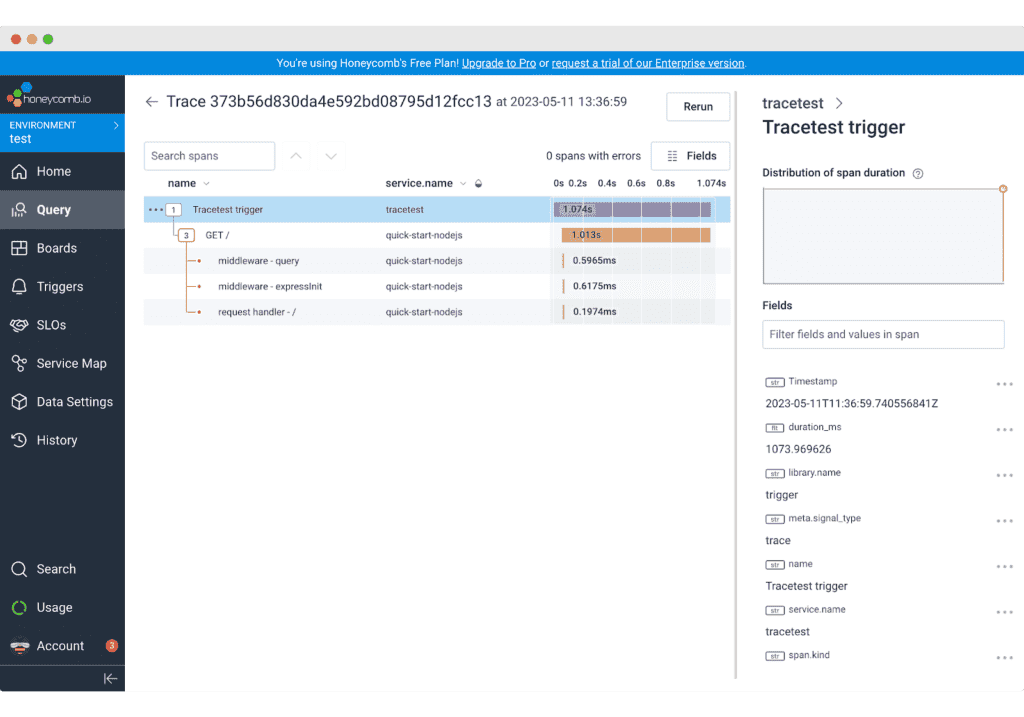
Honeycomb is a modern observability platform built for debugging distributed systems through high-cardinality, event-based telemetry. Where Dynatrace automates observability through AI topology, Honeycomb empowers developers to explore unknown unknowns through blazing-fast, ad-hoc querying over raw event data.
It is purpose-built for microservices and cloud-native environments where traditional APM sampling loses critical context. Honeycomb's philosophy "sample less, observe more" is fundamentally different from Dynatrace's automated intelligence approach but highly effective for developer-centric teams.
Honeycomb Pros
- Industry-leading high-cardinality tracing handles millions of unique dimensions
- Extremely fast exploratory queries for root cause analysis
- OpenTelemetry-native ingestion from day one
- First-class SLO and error budget workflows
- Developer-first UX built for incident investigation
- Bubble Up AI for automated unknown-unknown discovery
- Free tier available for evaluation
Honeycomb Cons
- SaaS-only no self-hosted option for data residency requirements
- Limited traditional infrastructure metrics monitoring
- Event-based pricing scales with high-volume microservices
- Different mental model requires mindset shift from traditional APM thinking
6. Elastic Observability
Type: Open Source / SaaS · Log-Centric Observability
Best For: Teams with heavy log analytics requirements or existing Elasticsearch expertise
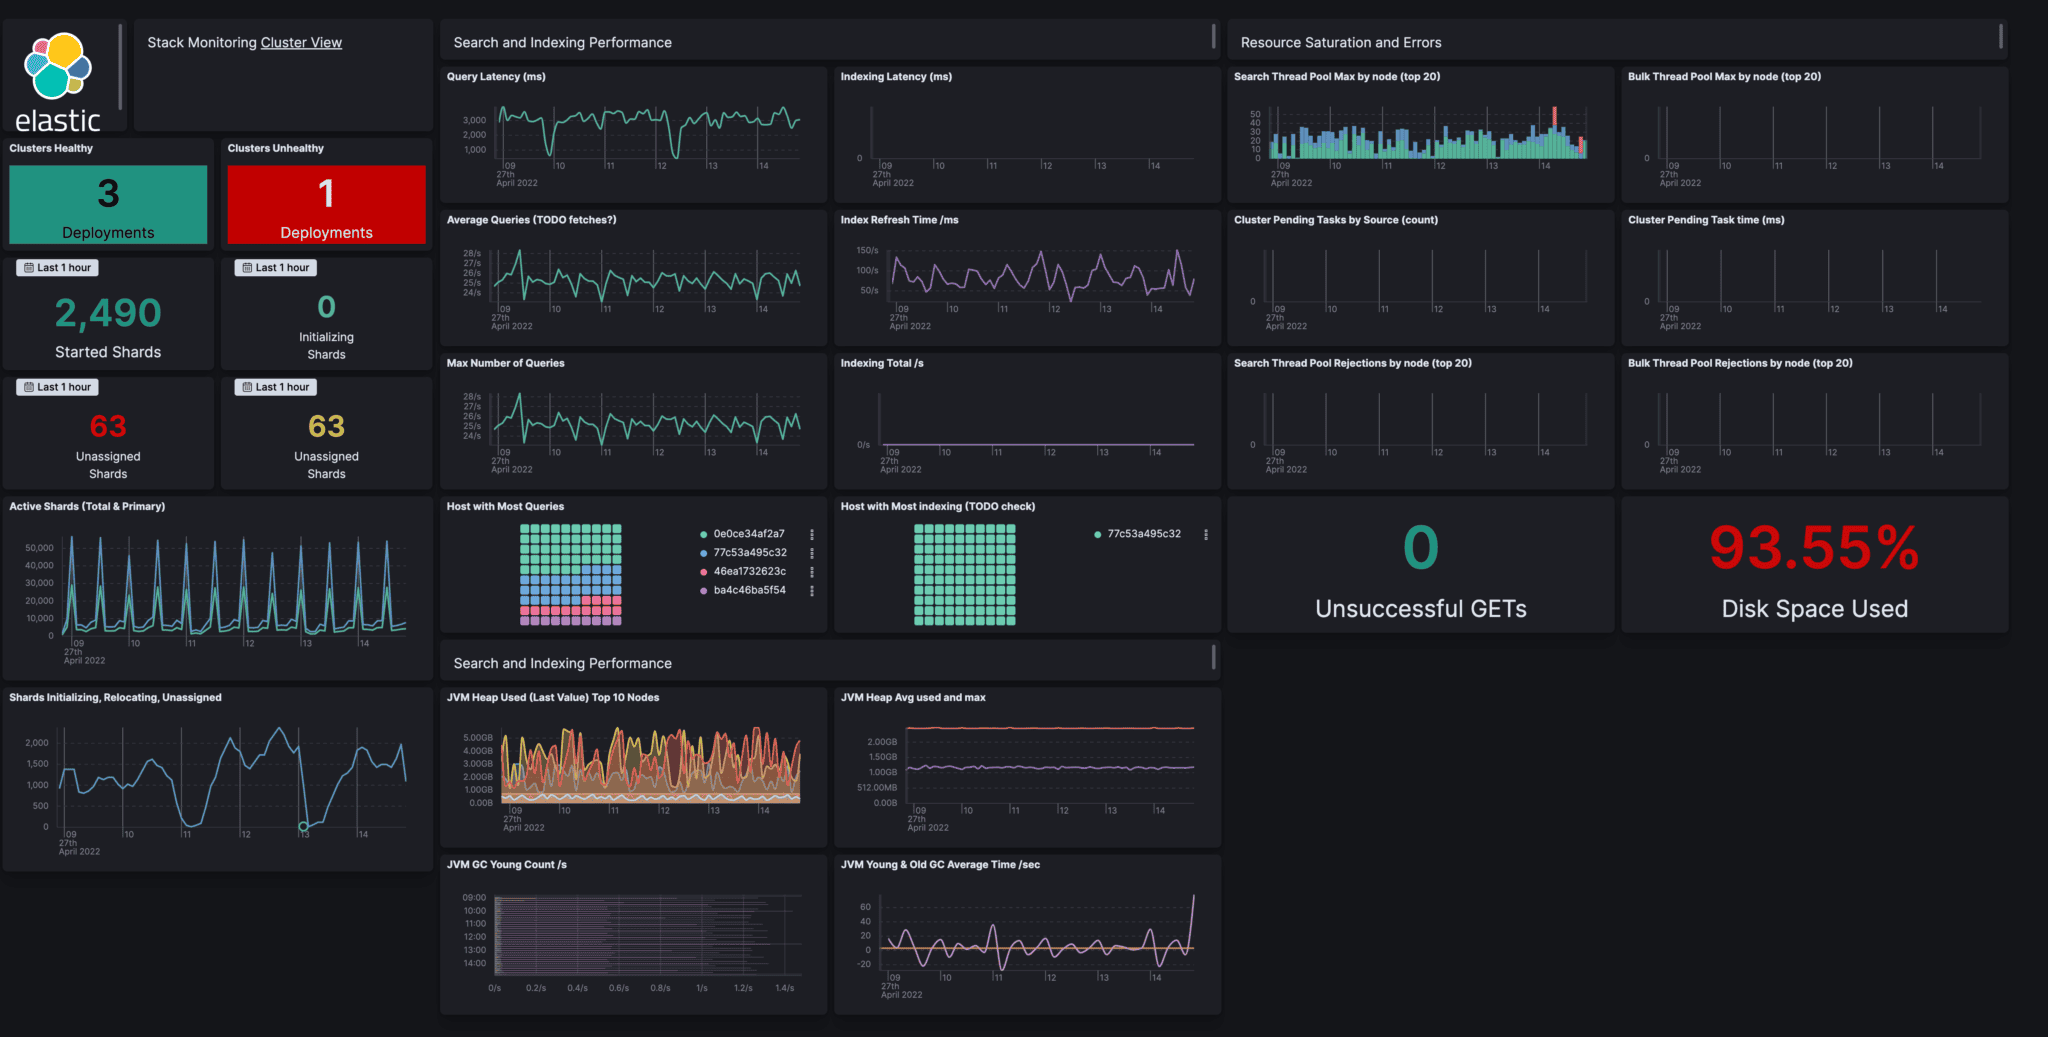
Elastic Observability (part of the ELK / Elastic Stack) is a powerful Dynatrace alternative for teams whose observability needs are anchored in log search and analytics. Built on Elasticsearch's world-class full-text search engine, it provides unified APM, infrastructure metrics, log management, and uptime monitoring.
Elastic's appeal lies in its exceptional search depth and the breadth of its ecosystem Beats, Logstash, and Kibana. For teams already invested in Elasticsearch, extending into full observability is a natural evolution with significant operational leverage.
Elastic Pros
- Unmatched full-text and structured log search capabilities
- Unified APM, metrics, logs, and uptime monitoring in one stack
- Flexible deployment: cloud, self-hosted, or hybrid
- Strong SIEM capabilities alongside observability
- Massive community and integration ecosystem
- OpenTelemetry ingestion support
Elastic Cons
- Resource-intensive: Elasticsearch clusters are expensive to self-manage
- High operational overhead for large-scale self-hosted deployments
- No automated service discovery comparable to Dynatrace OneAgent
- KQL query language differs significantly from DQL; migration learning curve
See our Elasticsearch alternatives guide for a cost and capability comparison.
7. Splunk Observability Cloud
Type: SaaS / On-Premises · Enterprise Compliance
Best For: Large enterprises in regulated industries requiring combined observability, SIEM, and compliance auditing
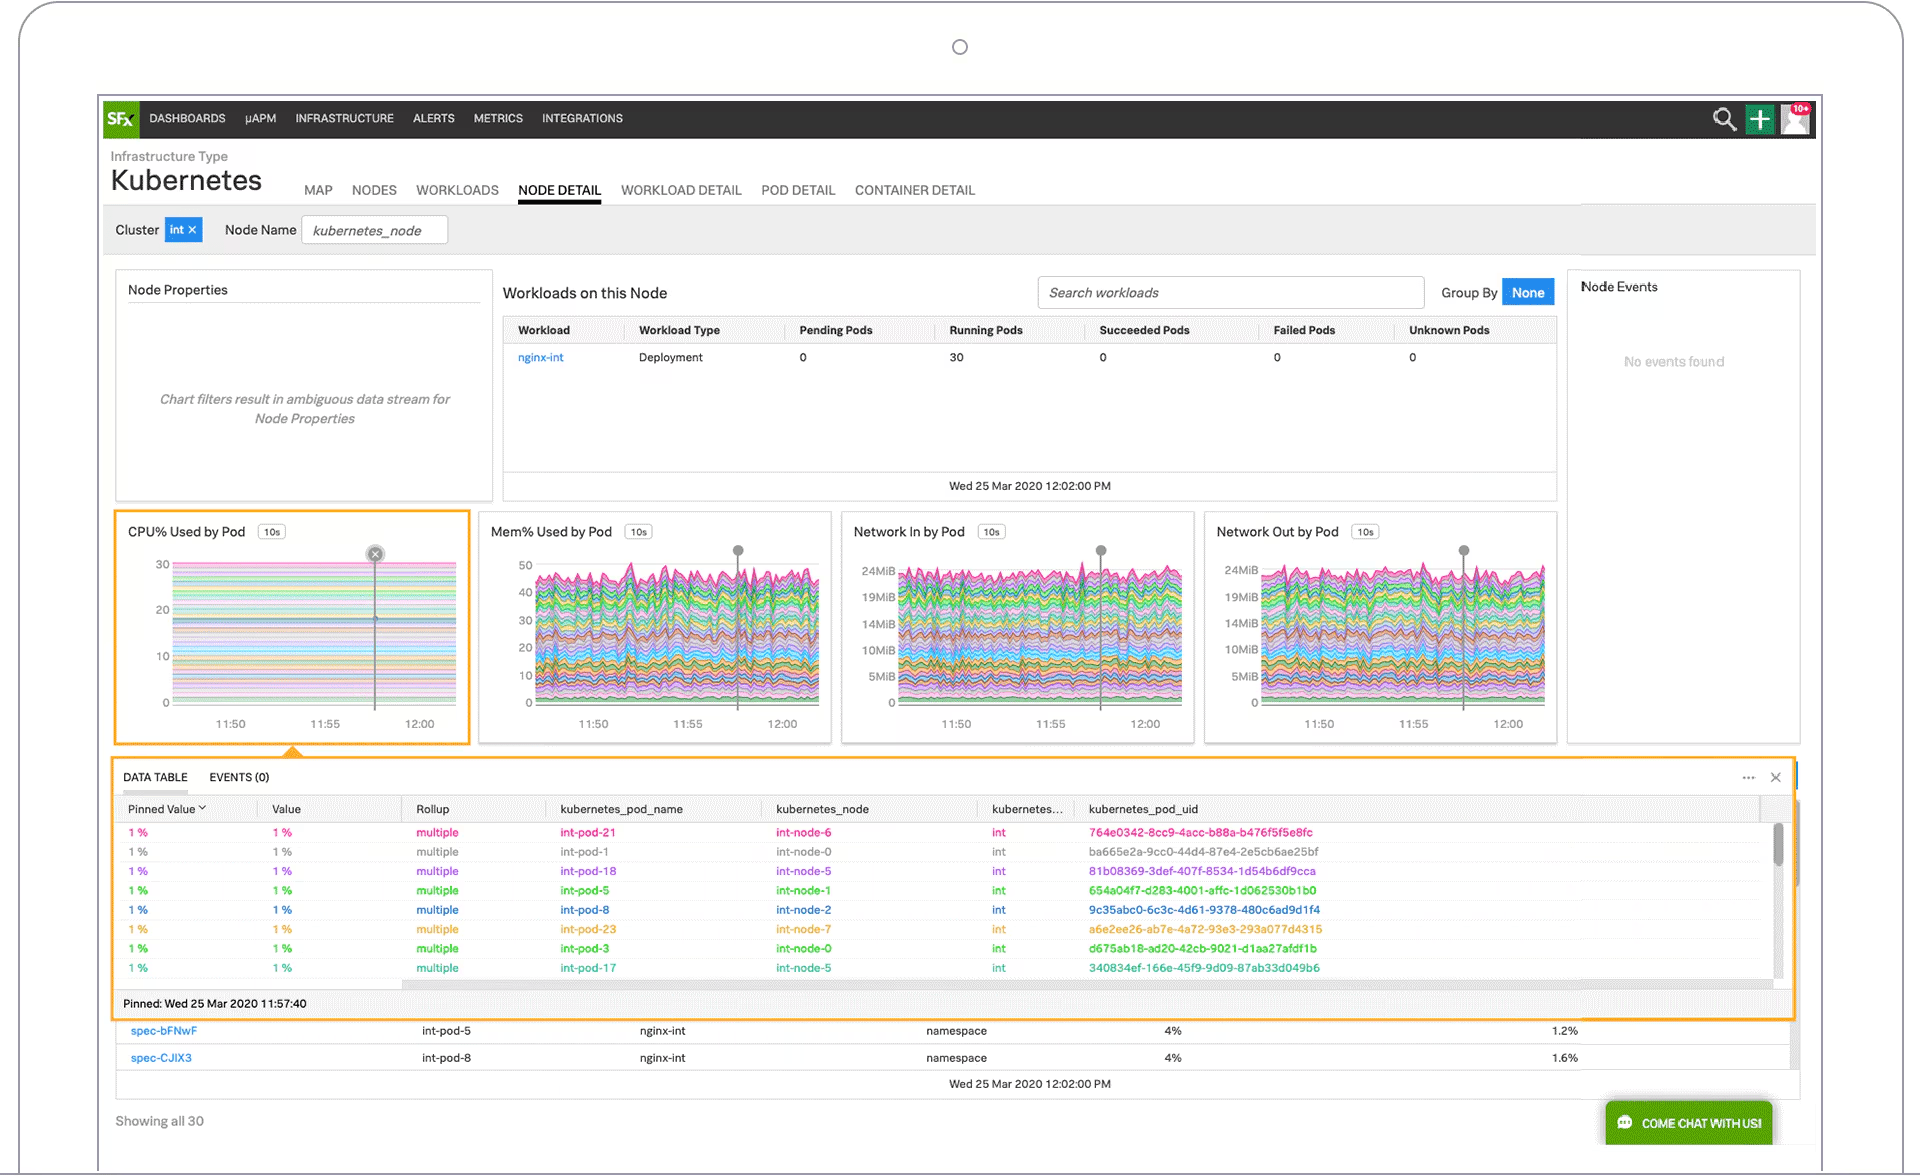
Splunk Observability Cloud (combining SignalFx APM, Infrastructure Monitoring, and Log Observer) is a battle-tested enterprise platform for full-stack observability. As a Dynatrace alternative, Splunk brings exceptional analytics depth through SPL (Search Processing Language), enterprise-grade compliance capabilities, and mature on-premises deployment support.
Splunk shines in scenarios where observability must coexist with security operations, compliance auditing, and large-scale log forensics use cases where Dynatrace's more focused APM heritage shows limitations.
Splunk Pros
- Industry-leading log analytics and compliance audit capabilities
- SPL enables extremely deep correlation and custom investigation workflows
- Proven reliability at massive enterprise scale
- Strong on-premises and air-gapped deployment support
- Real-time metrics and APM through SignalFx technology
- Tight SIEM integration for security + observability convergence
Splunk Cons
- One of the most expensive observability options available
- SPL has a notoriously steep learning curve
- Pricing complexity rivals or exceeds Dynatrace's DDU model
- Often excessive for teams primarily needing APM and infrastructure monitoring
See our Splunk alternatives guide for a full breakdown of options.
8. Coralogix
Type: SaaS · Cost-Optimized Observability
Best For: Teams with high log volumes seeking predictable pricing and flexible data pipeline control
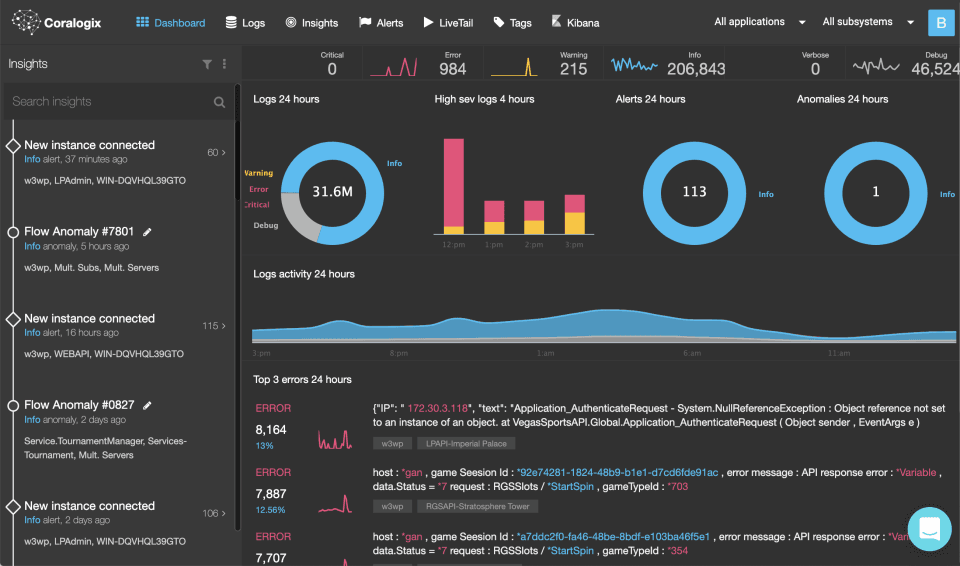
Coralogix is a modern observability platform distinguished by its Streama™ technology an architecture that decouples log indexing from log storage, enabling teams to control costs by routing data to different processing tiers based on priority and business value.
For teams frustrated by Dynatrace's DDU billing unpredictability, Coralogix offers a refreshingly transparent cost model. Non-critical logs can be routed to cheap cold storage while high-priority data is indexed for real-time querying a level of cost governance simply not possible with Dynatrace's unified billing.
Coralogix Pros
- Streama™ data tiering slashes log costs by routing non-critical data cheaply
- Native OTLP and Prometheus-compatible metric ingestion
- Transparent, predictable pricing without DDU-style surprises
- Real-time stream processing for immediate alerting on live data
- Flexible enrichment and filtering pipelines pre-storage
- Growing APM and tracing capabilities
Coralogix Cons
- Less brand recognition than Dynatrace, Datadog, or New Relic
- APM depth not yet on par with dedicated APM-first platforms
- Streama architecture requires a learning investment to optimize effectively
- Smaller enterprise reference customer base
9. AppDynamics (Cisco)
Type: SaaS / On-Premises · Business-Centric APM
Best For: Enterprises already in the Cisco ecosystem that need to connect application performance to business KPIs
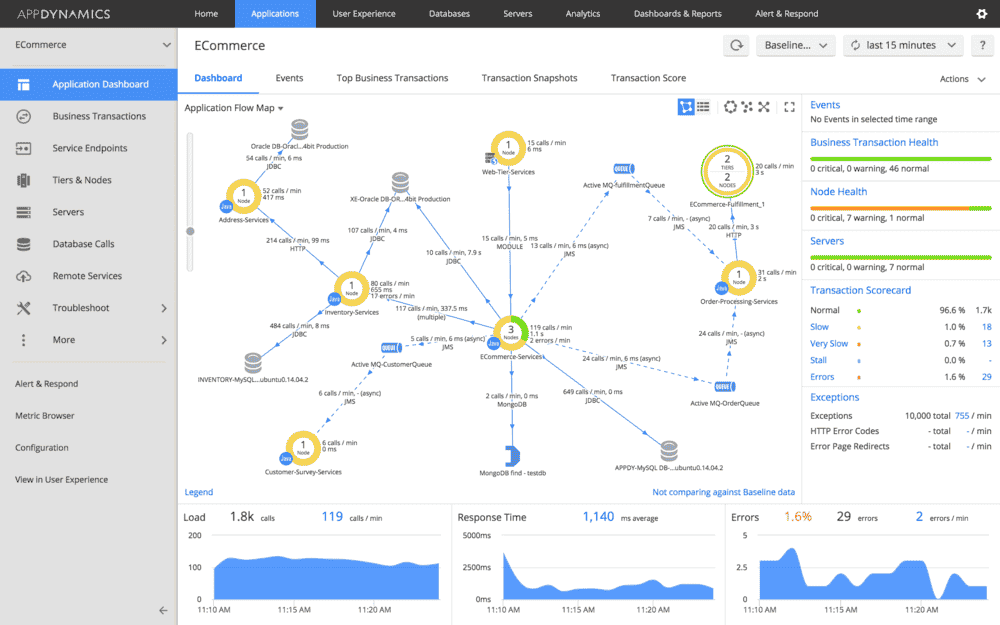
AppDynamics, now part of Cisco's portfolio, is a direct Dynatrace competitor in the enterprise APM space. Its key differentiator is the ability to correlate technical application performance with business outcomes mapping transaction slowdowns to revenue impact, conversion rates, and customer satisfaction scores.
For organizations that must report observability ROI directly to business stakeholders, AppDynamics' business transaction mapping is a genuinely unique capability. Its integration with Cisco's networking and security portfolio also makes it a natural consolidation choice for Cisco-centric enterprises.
AppDynamics Pros
- Industry-leading business transaction monitoring tied to revenue metrics
- Deep code-level APM with method-level performance visibility
- Cognition Engine AI for automated anomaly correlation and RCA
- Strong support for hybrid and legacy application environments
- Tight Cisco ecosystem integration (networking, security, SD-WAN)
- Proven reliability at large enterprise scale
AppDynamics Cons
- Premium enterprise pricing, often comparable to Dynatrace
- Heavy agent-based approach consumes significant application resources
- Less optimized for modern Kubernetes-first architectures
- Complex unit-based licensing model requires careful planning
10. Uptrace
Type: Open Source · OTel-Native Distributed Tracing
Best For: Developers and DevOps teams wanting a lightweight, fast, OTel-native tracing backend
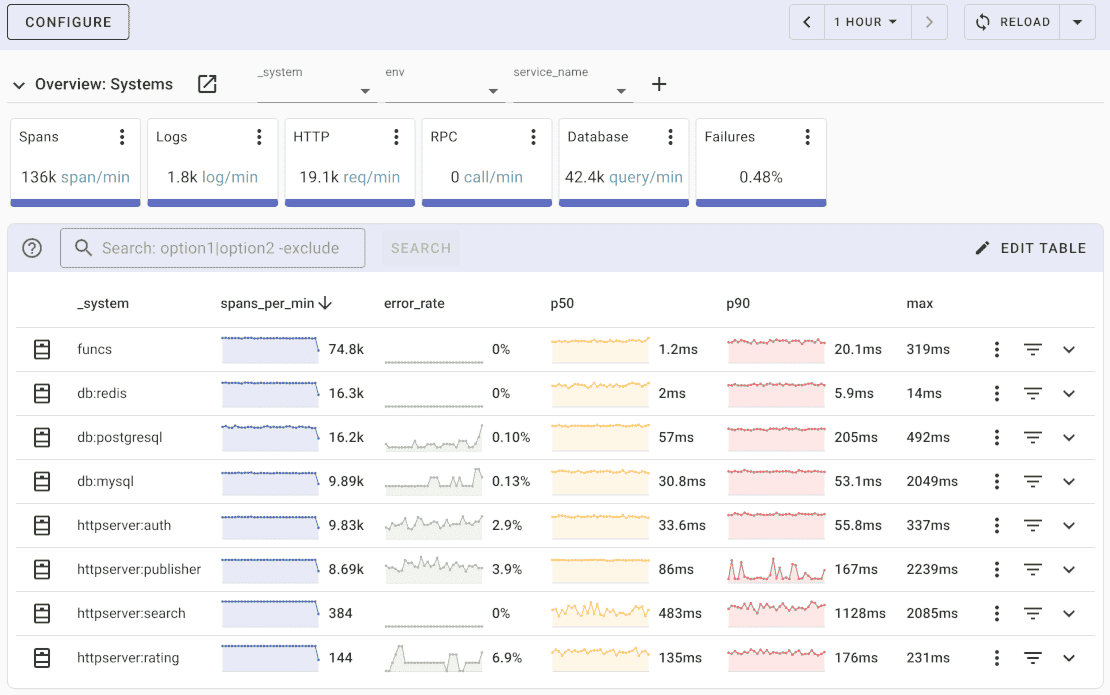
Uptrace is a lightweight, OpenTelemetry-native observability platform built on ClickHouse for high-performance analytics. It's an excellent Dynatrace alternative for teams that primarily need fast distributed tracing and APM without the complexity, cost, or operational overhead of a full enterprise platform.
Uptrace's simplicity is its strength. Where Dynatrace aims to be the single source of truth for an entire enterprise, Uptrace excels as a focused tracing and metrics backend that can be deployed in minutes and paired with other best-of-breed tools for full observability coverage.
Uptrace Pros
- Built natively for OpenTelemetry no proprietary agents needed whatsoever
- ClickHouse backend delivers extremely fast query performance at scale
- Significantly lower cost than Dynatrace for trace-heavy workloads
- Self-hosted or cloud deployment options for data control
- Clean, focused UI designed specifically for tracing and debugging workflows
- Docker and Kubernetes deployment in minutes
Uptrace Cons
- No automated service discovery or one-click instrumentation
- Less mature alerting and dashboarding than Dynatrace
- Narrower scope focused on tracing, not full-stack observability out of the box
- Smaller community and fewer enterprise integrations than major platforms
Full Comparison Table: Dynatrace Alternatives 2026
| Tool | Deployment | Metrics | Logs | Traces | Pricing Model | Key Advantage Over Dynatrace | Migration Ease |
|---|---|---|---|---|---|---|---|
| OpenObserve | Self-hosted / Cloud | ✅ | ✅ | ✅ | Usage-based, no per-user | 60–90% cost savings, OTel-native, no DDUs | ⭐⭐⭐⭐⭐ |
| Datadog | SaaS | ✅ | ✅ | ✅ | Host + usage-based | 900+ integrations, richer developer UX | ⭐⭐⭐⭐ |
| New Relic | SaaS | ✅ | ✅ | ✅ | User + data ingestion | 780+ integrations, easier team onboarding | ⭐⭐⭐⭐ |
| Grafana Stack | Self-hosted / Cloud | ✅ | ✅ | ✅ | OSS free + Grafana Cloud | Maximum flexibility, zero vendor lock-in | ⭐⭐⭐ |
| Honeycomb | SaaS only | ⚠️ | ⚠️ | ✅ | Event-based | Best high-cardinality tracing for microservices | ⭐⭐⭐⭐⭐ |
| Elastic Observability | Self-hosted / Cloud | ✅ | ✅ | ✅ | Data-volume based | Superior log search, existing ELK expertise | ⭐⭐⭐ |
| Splunk Obs. Cloud | SaaS / On-prem | ✅ | ✅ | ✅ | Data-volume based | Enterprise compliance, SIEM convergence | ⭐⭐⭐ |
| Coralogix | SaaS | ✅ | ✅ | ✅ | Usage + tiering | Streama cost optimization, transparent billing | ⭐⭐⭐⭐ |
| AppDynamics | SaaS / On-prem | ✅ | ✅ | ✅ | Unit-based | Business transaction mapping, Cisco ecosystem | ⭐⭐⭐ |
| Uptrace | Self-hosted / Cloud | ✅ | ✅ | ✅ | Open Source + Cloud | Lightweight OTel-native APM, ClickHouse speed | ⭐⭐⭐⭐⭐ |
⚠️ = Partial support
How to Choose the Right Dynatrace Alternative
The ideal replacement depends on your team's unique constraints and priorities. Use this decision framework:
- Budget is the Primary Driver
If Dynatrace's DDU pricing is causing bill shock, prioritize alternatives with transparent, usage-based billing. OpenObserve and the Grafana Stack eliminate per-unit billing entirely at the open-source tier. Coralogix is the best commercial option for predictable, optimized log costs with tiered data routing.
- You Want to Keep Enterprise-Grade AI Insights
If Dynatrace's Davis AI is a key part of your SRE workflow, Datadog (Watchdog AI) and AppDynamics (Cognition Engine) offer the closest commercial equivalents both providing automated anomaly detection and root cause suggestions, though with different methodologies.
- You Need OpenTelemetry-Native Migration
For teams wanting to escape proprietary agents and instrument via OTel standards, the smoothest migrations are to OpenObserve, Honeycomb, and Uptrace all built natively for OTLP ingestion. Simply point your OpenTelemetry Collector at the new backend with no application code changes.
- Team Size and Access Democratization
If Dynatrace's per-user licensing is restricting access across your engineering organization, choose platforms with no seat-based pricing: OpenObserve, Grafana Stack, Honeycomb, or Coralogix.
- You Are in a Regulated Industry
For HIPAA, SOC2, FedRAMP, or air-gapped requirements, self-hosted options like OpenObserve, Grafana Stack, and Elastic provide full data residency control. Commercial options with strong compliance certifications include Splunk and Datadog.
- Kubernetes and Cloud-Native Workloads
OpenObserve and the Grafana Stack (Prometheus + Loki + Tempo) are the most widely adopted in Kubernetes-native environments. Both have deep CNCF ecosystem integrations and treat OpenTelemetry as a first-class citizen.
- You Need Business-Level APM Reporting
If connecting technical performance to business KPIs is critical, AppDynamics is the only platform that natively maps transaction health to revenue metrics and customer conversion outcomes at the application level.
💡 Best Practice: The safest migration approach is to run your new platform in parallel alongside Dynatrace for 2–4 weeks. Configure the OpenTelemetry Collector to dual-export telemetry to both backends simultaneously. Validate alert parity, dashboard coverage, and query performance before cutting over fully.
Conclusion
Dynatrace is a powerful enterprise observability platform, but it is far from the only option in 2026. The market has matured significantly, and today's best Dynatrace alternatives match or exceed its capabilities in specific domains at a fraction of the cost and complexity.
Key takeaways:
- OpenObserve stands out as the best open-source alternative for cost savings and OTel-native unified observability with no DDU billing
- Datadog and New Relic are the strongest like-for-like commercial SaaS alternatives for teams wanting enterprise features
- Grafana Stack provides maximum open-source flexibility for Kubernetes-native teams with strong operational capacity
- Honeycomb is unmatched for high-cardinality microservices tracing and developer-centric debugging workflows
- OpenTelemetry adoption makes migration significantly easier and prevents future vendor lock-in regardless of which platform you choose
If you're evaluating adjacent tools, see our top 10 APM tools comparison, top 10 Kubernetes monitoring tools, and top 10 AIOps platforms guide.
Frequently Asked Questions
About the Author
Simran Kumari

Passionate about observability, AI systems, and cloud-native tools. All in on DevOps and improving the developer experience.
Follow OpenObserve on Google
Add OpenObserve as a preferred source to see more of our articles in Google Search and Top Stories.












