Stream AWS Lambda Logs to OpenObserve with OpenObserve Lambda Extension




Ready to get started?
Try OpenObserve Cloud today for more efficient and performant observability.
Stream AWS Lambda Logs to OpenObserve with OpenObserve Lambda Extension
What You Will Learn
This hands-on guide shows you how to stream AWS Lambda logs to OpenObserve without CloudWatch using the OpenObserve Lambda Extension. You’ll learn how to:
- Stream AWS Lambda logs to OpenObserve in real time, no CloudWatch needed.
- Attach and configure the OpenObserve Lambda Extension for x86_64 or arm64 architectures.
- Set environment variables for secure, reliable log delivery.
- Verify Lambda logs in OpenObserve, including function and platform logs.
- Troubleshoot common issues like architecture mismatches or missing logs.
- Gain full observability for serverless workloads, correlating logs, metrics, and traces.
Introduction
AWS Lambda is one of the most popular ways to run applications in the cloud without provisioning servers. It’s great for scalability and cost efficiency, but monitoring it can be tricky. By default, Lambda logs go to CloudWatch, and digging through them for errors, latency issues, or performance bottlenecks can be frustrating.
But what if you could:
- Ship Lambda logs directly to OpenObserve (skipping CloudWatch)
- Get real-time log search alongside your app logs and metrics
- Keep costs lower by avoiding CloudWatch retention
That’s exactly what the OpenObserve Lambda Extension does. It’s a lightweight AWS Lambda layer (written in Rust) that captures your function’s logs and streams them straight into OpenObserve.
In this guide, we’ll walk through an end-to-end setup , from building the extension to attaching it to a Lambda function and verifying logs in OpenObserve.
OpenObserve Lambda Layer
A high-performance AWS Lambda Extension written in Rust that automatically captures and forwards Lambda function logs to OpenObserve in real time.
Overview
This Lambda layer runs as a separate process alongside your Lambda function, capturing all logs and telemetry without impacting your function’s performance. It uses AWS Lambda’s Extensions API to collect logs and forwards them to OpenObserve as structured JSON.
How It Works
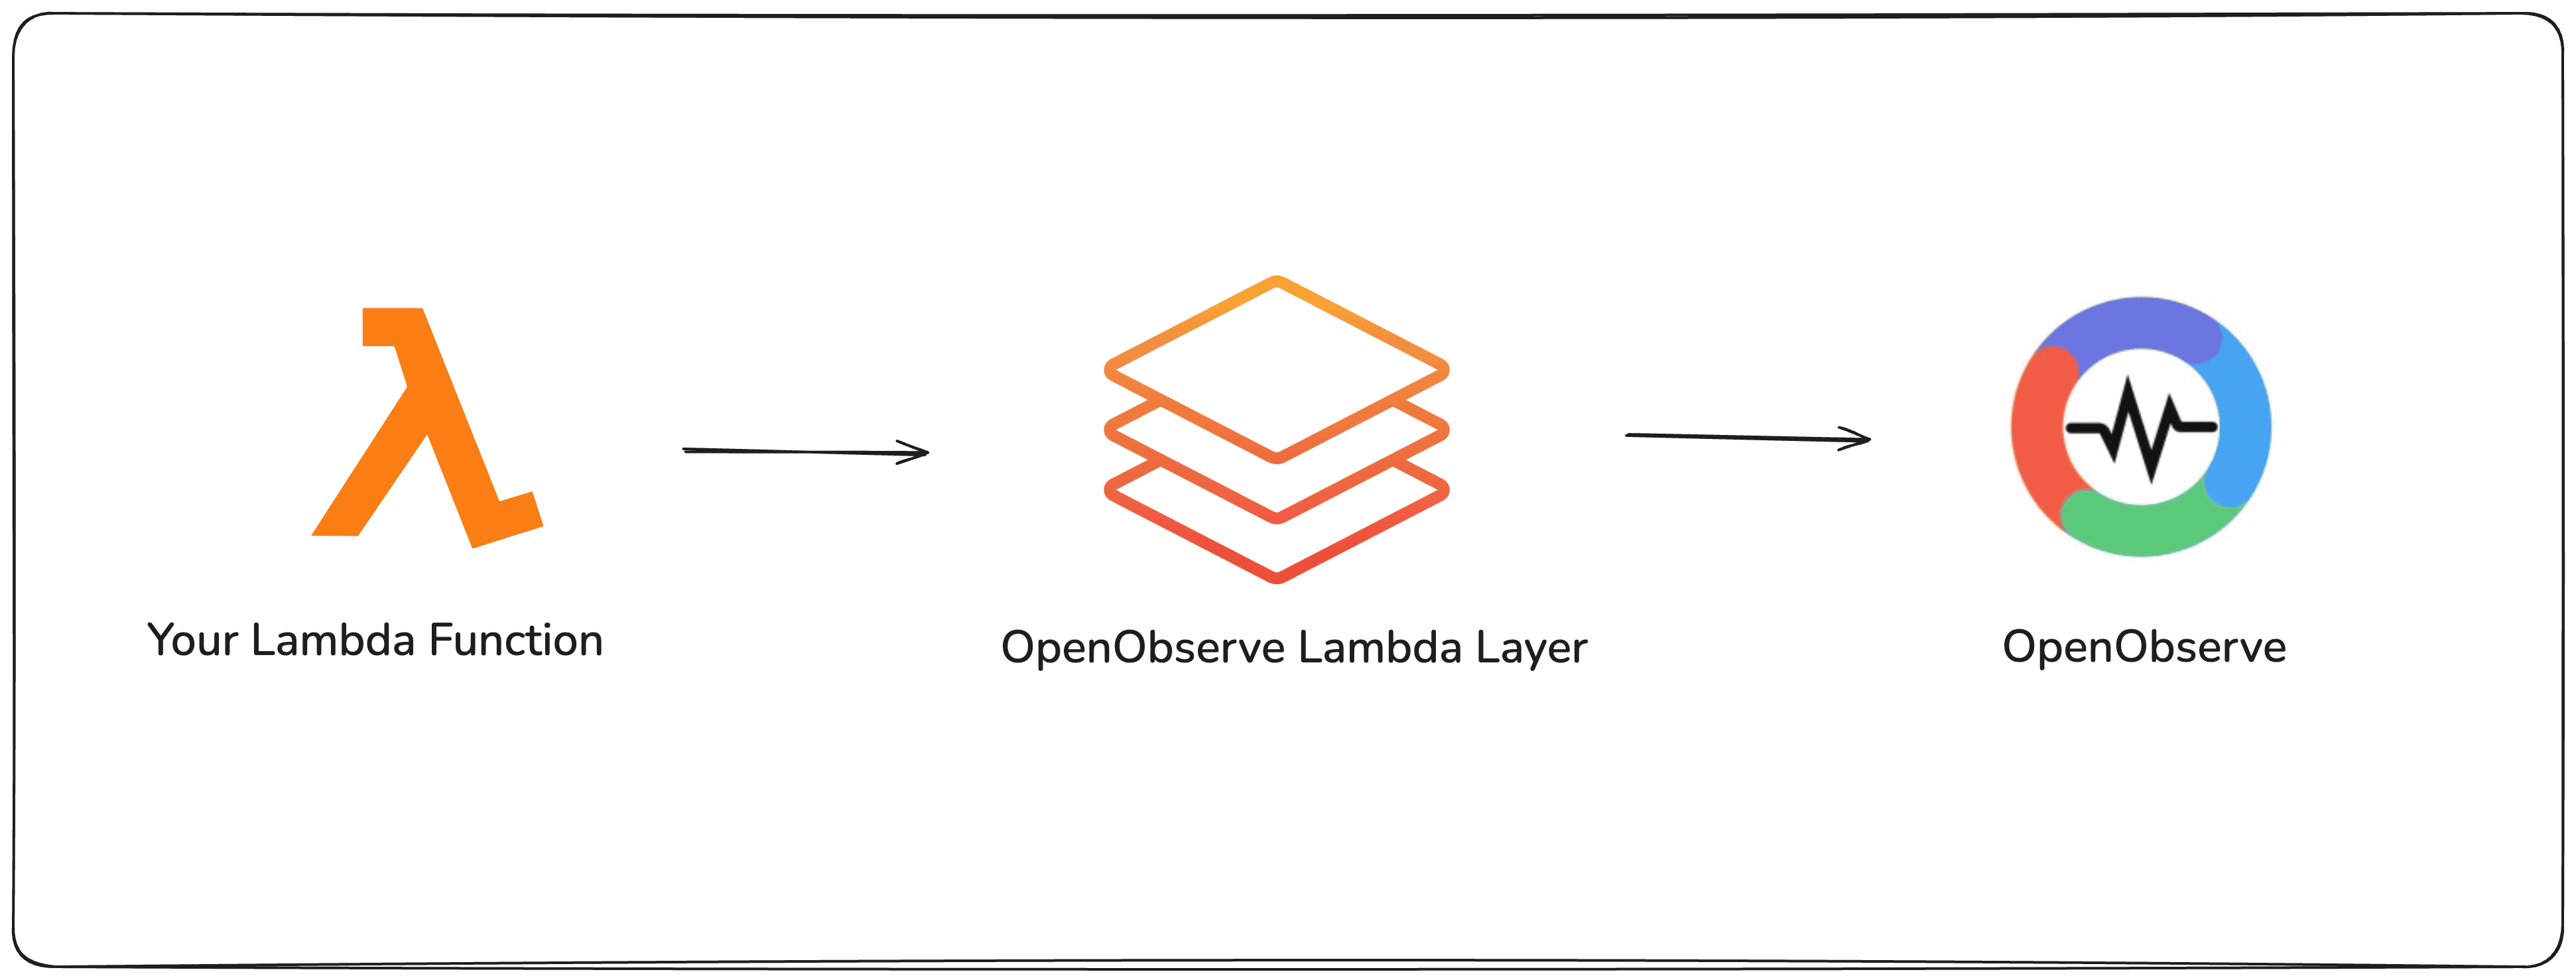
- Extension Registration → Registers with the Lambda Extensions API
- Log Subscription → Subscribes to Lambda Logs API to receive all function + platform logs
- Smart Buffering → Collects logs in memory with overflow protection
- Adaptive Flushing → Flushes based on invocation patterns
- Reliable Delivery → Retries with exponential backoff to ensure logs reach OpenObserve
Now that you know what the extension does, let’s see how to get it running in your Lambda function.
Prerequisites
Before you start, make sure you have:
- AWS account with Lambda + IAM permissions
- AWS CLI installed and configured
- OpenObserve account (self-hosted or cloud)
Step 0: Create a Test Lambda Function (Optional)
If you already have a Lambda function that you want to use you can skip this step and go to Step 1: Check Your Lambda Architecture. If not, let’s quickly create a Lambda function so we can attach the extension layer to it.
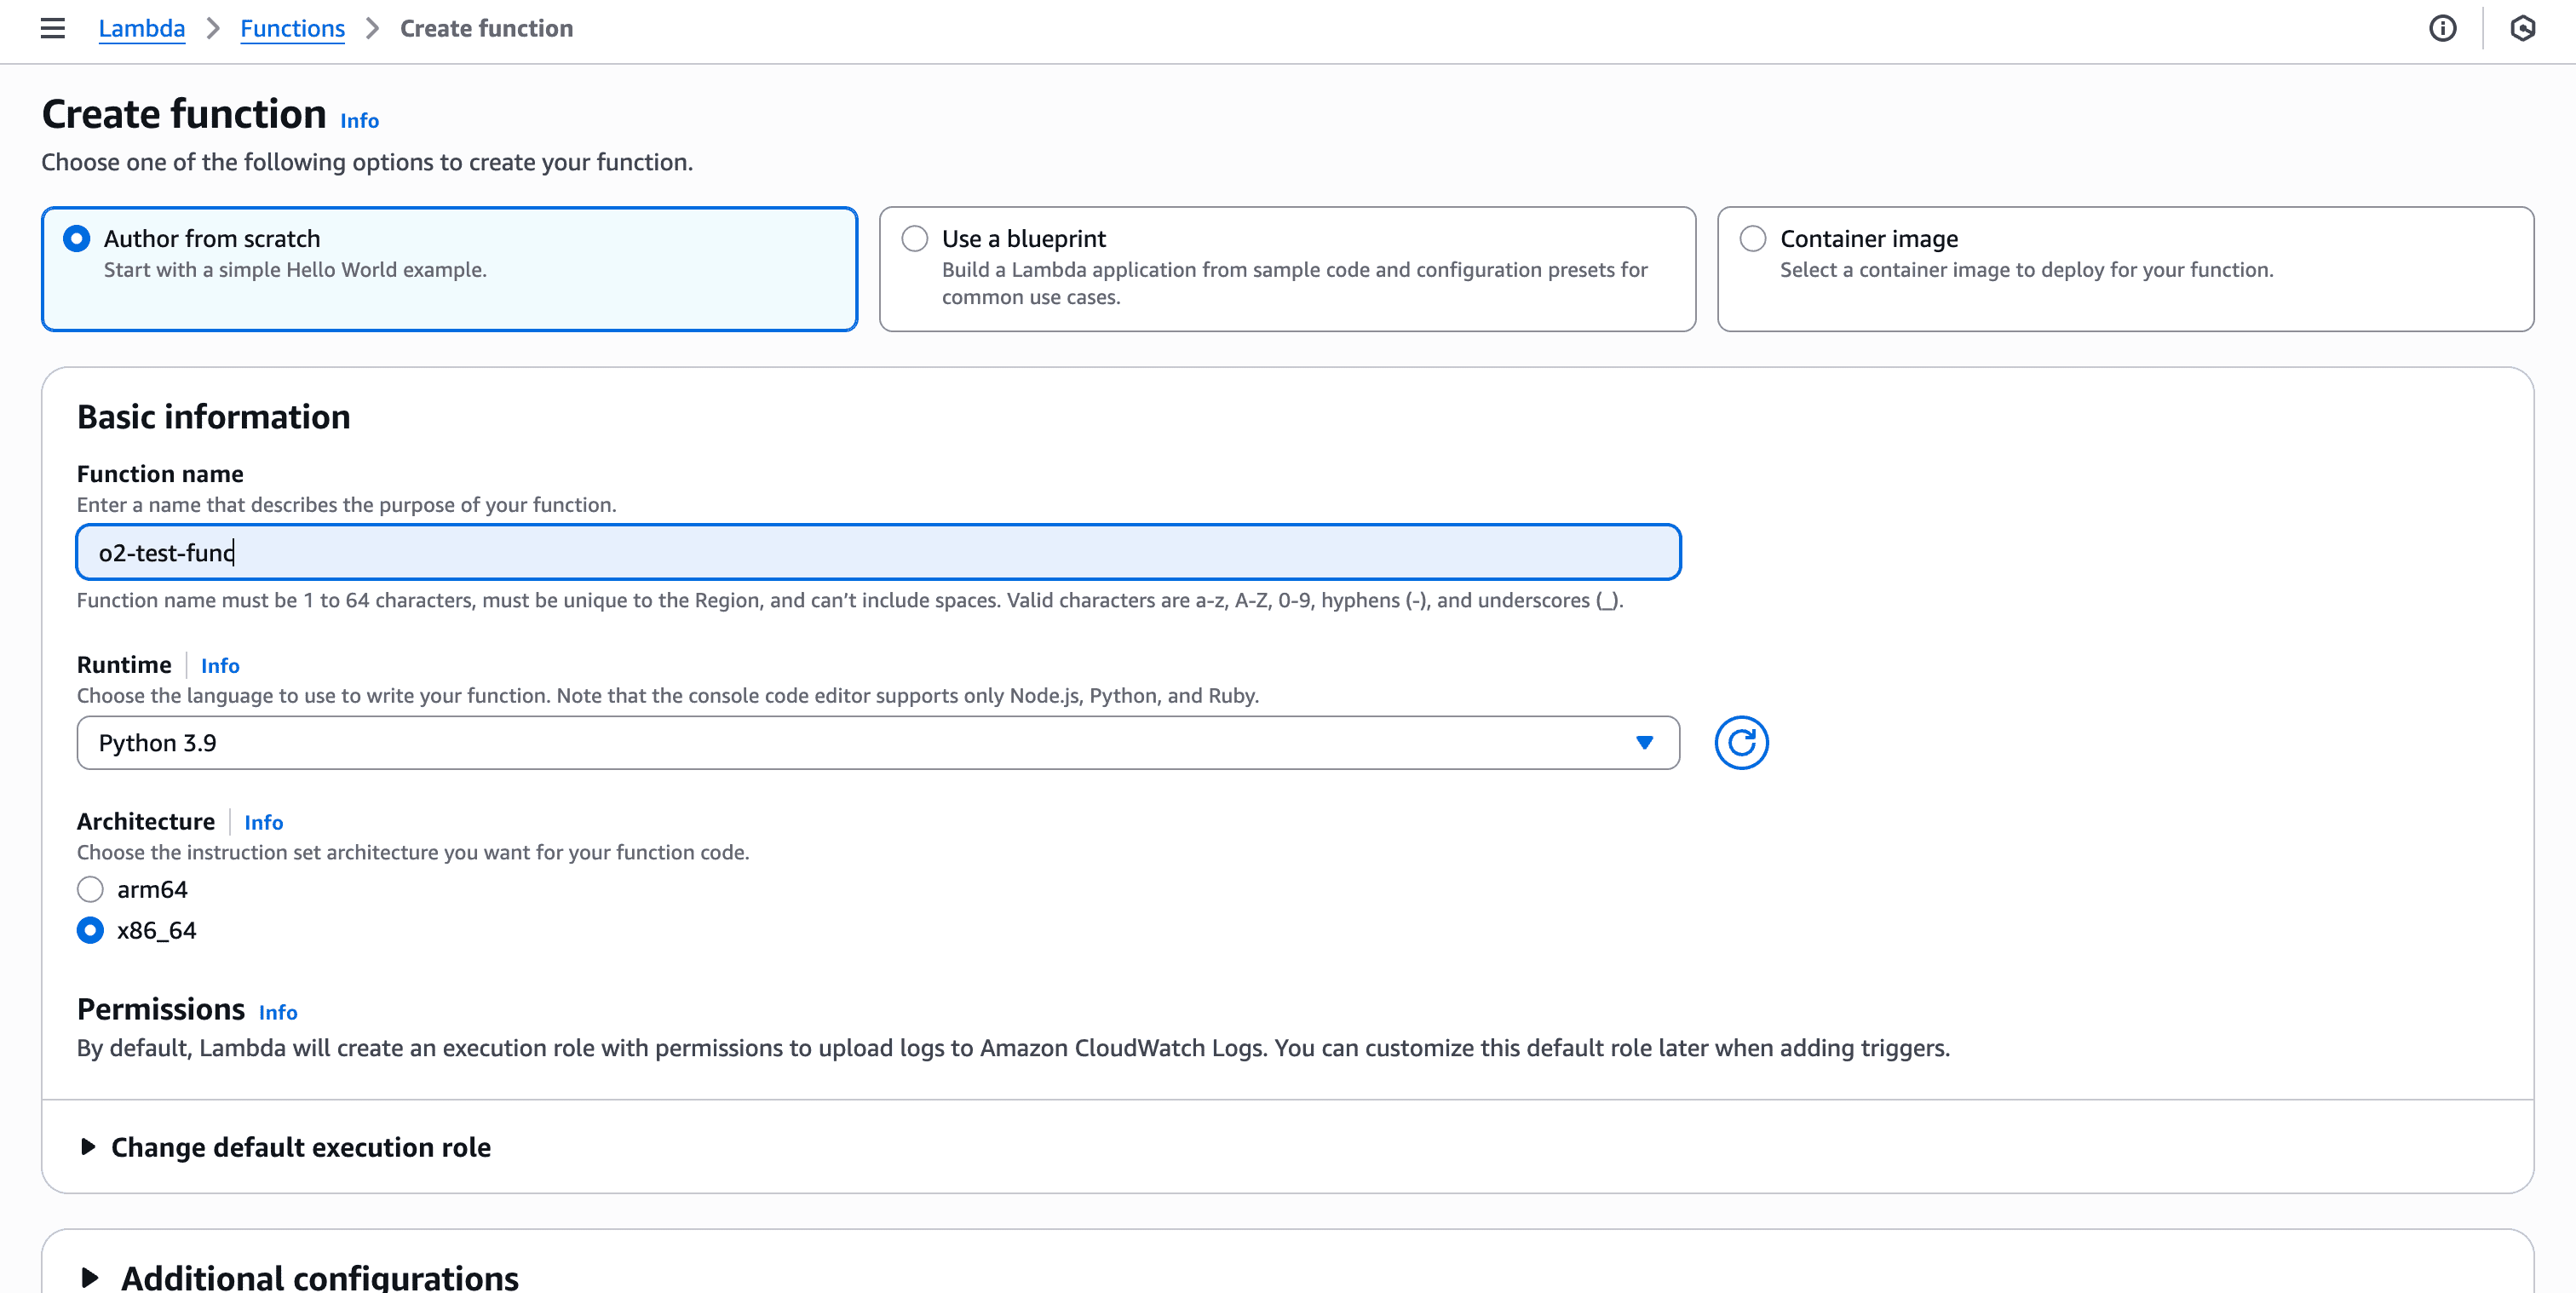
- In the AWS Console, go to Lambda dashboard → Functions → Create function
- Choose `Author from Scratch`, provide function name, environment, architecture, etc and create the function.
Example: lambda_function.py
import json
import logging
import time
import random

logger = logging.getLogger()
logger.setLevel(logging.INFO)

def lambda_handler(event, context):
    logger.info("Lambda invoked", extra={"event": event})

    # Simulated work
    latency = random.randint(50, 500)  # fake processing time in ms
    time.sleep(latency / 1000)

    response = {
        "status": "ok",
        "latency_ms": latency,
        "timestamp": int(time.time())
    }

    logger.info("Request processed", extra=response)
    return {
        "statusCode": 200,
        "body": json.dumps(response)
    }
Deploy the function. Once deployed you will see a success message:
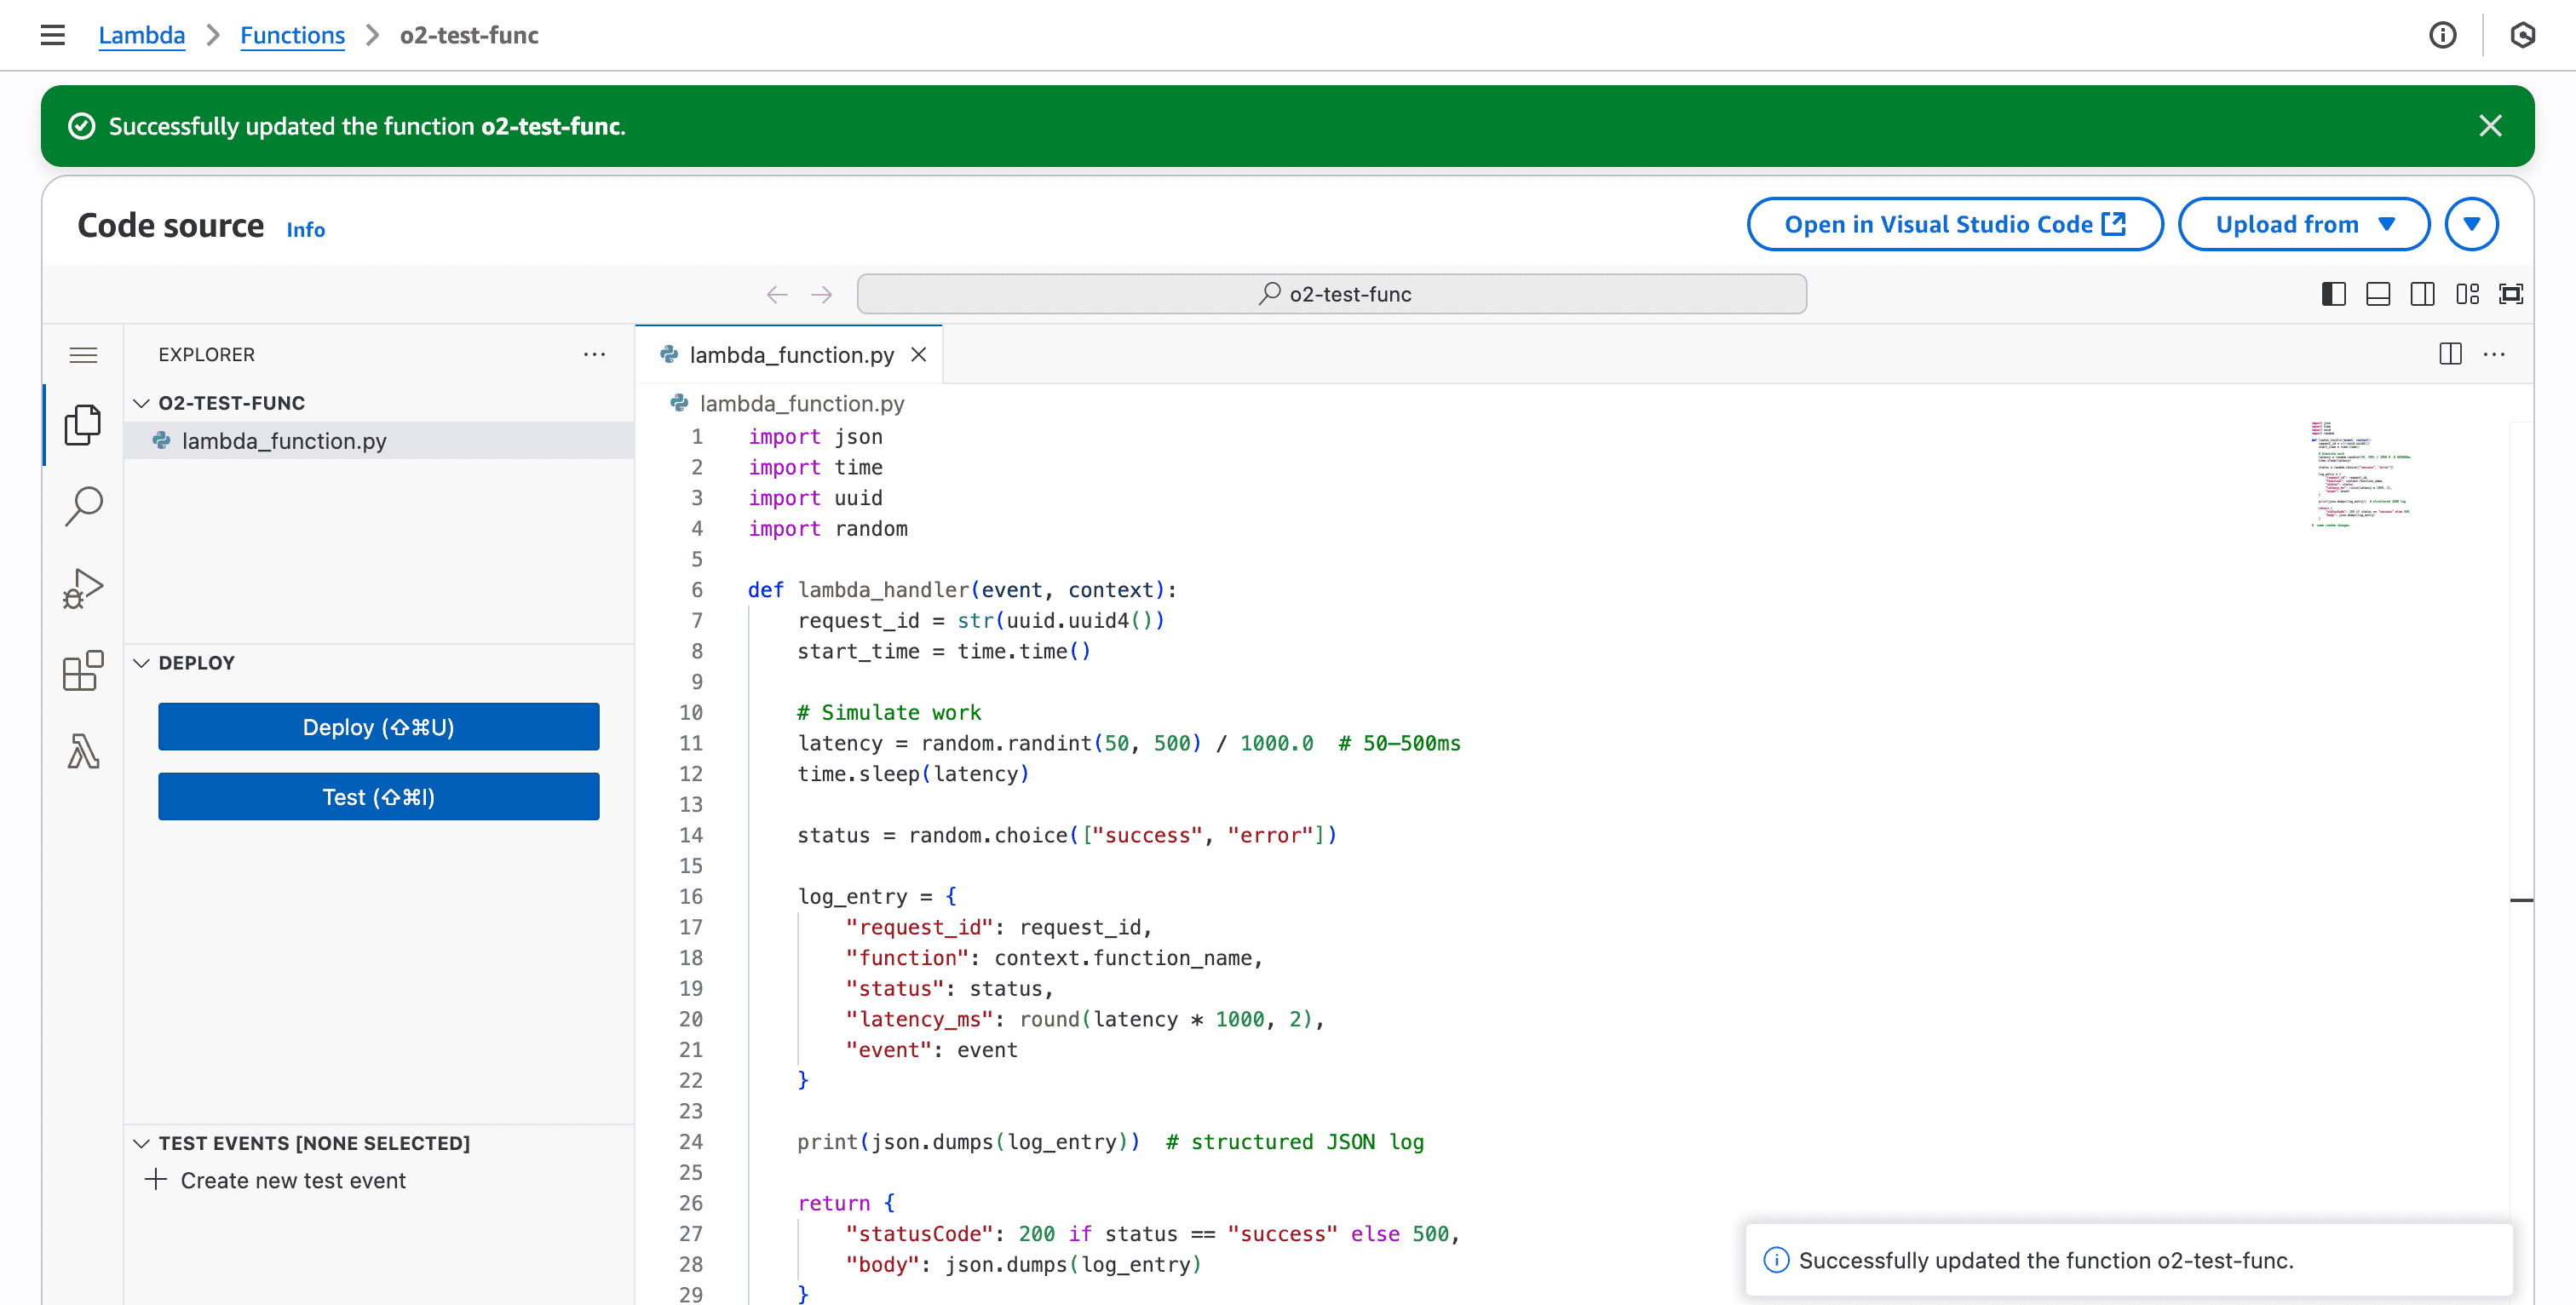
Now you have a simple Lambda that emits structured logs every time it’s invoked.
Step 1: Check Your Lambda Architecture
You can check your Lambda architecture using the command:
aws lambda get-function-configuration --function-name <function_name> --query 'Architectures'

Based on the returned architecture (x86_64 or arm64), copy the compatible ARN values for the OpenObserve Lambda Extension layer.
- For x86_64: arn:aws:lambda:<aws_region_id>:325553860333:layer:openobserve-extension-x86_64:1
- For arm64: arn:aws:lambda:<aws_region_id>:325553860333:layer:openobserve-extension-arm64:1
Note: Make sure <aws_region_id> matches the region where your Lambda function is deployed, as Lambda layers are regional. Using an ARN from a different region will not work.
Step 2: Attach the Extension Layer
Now we need to attach the extension layer to our Lambda function. This layer intercepts Lambda logs and ships them to OpenObserve.
Go to the AWS Console → Lambda → Your function, click Layers
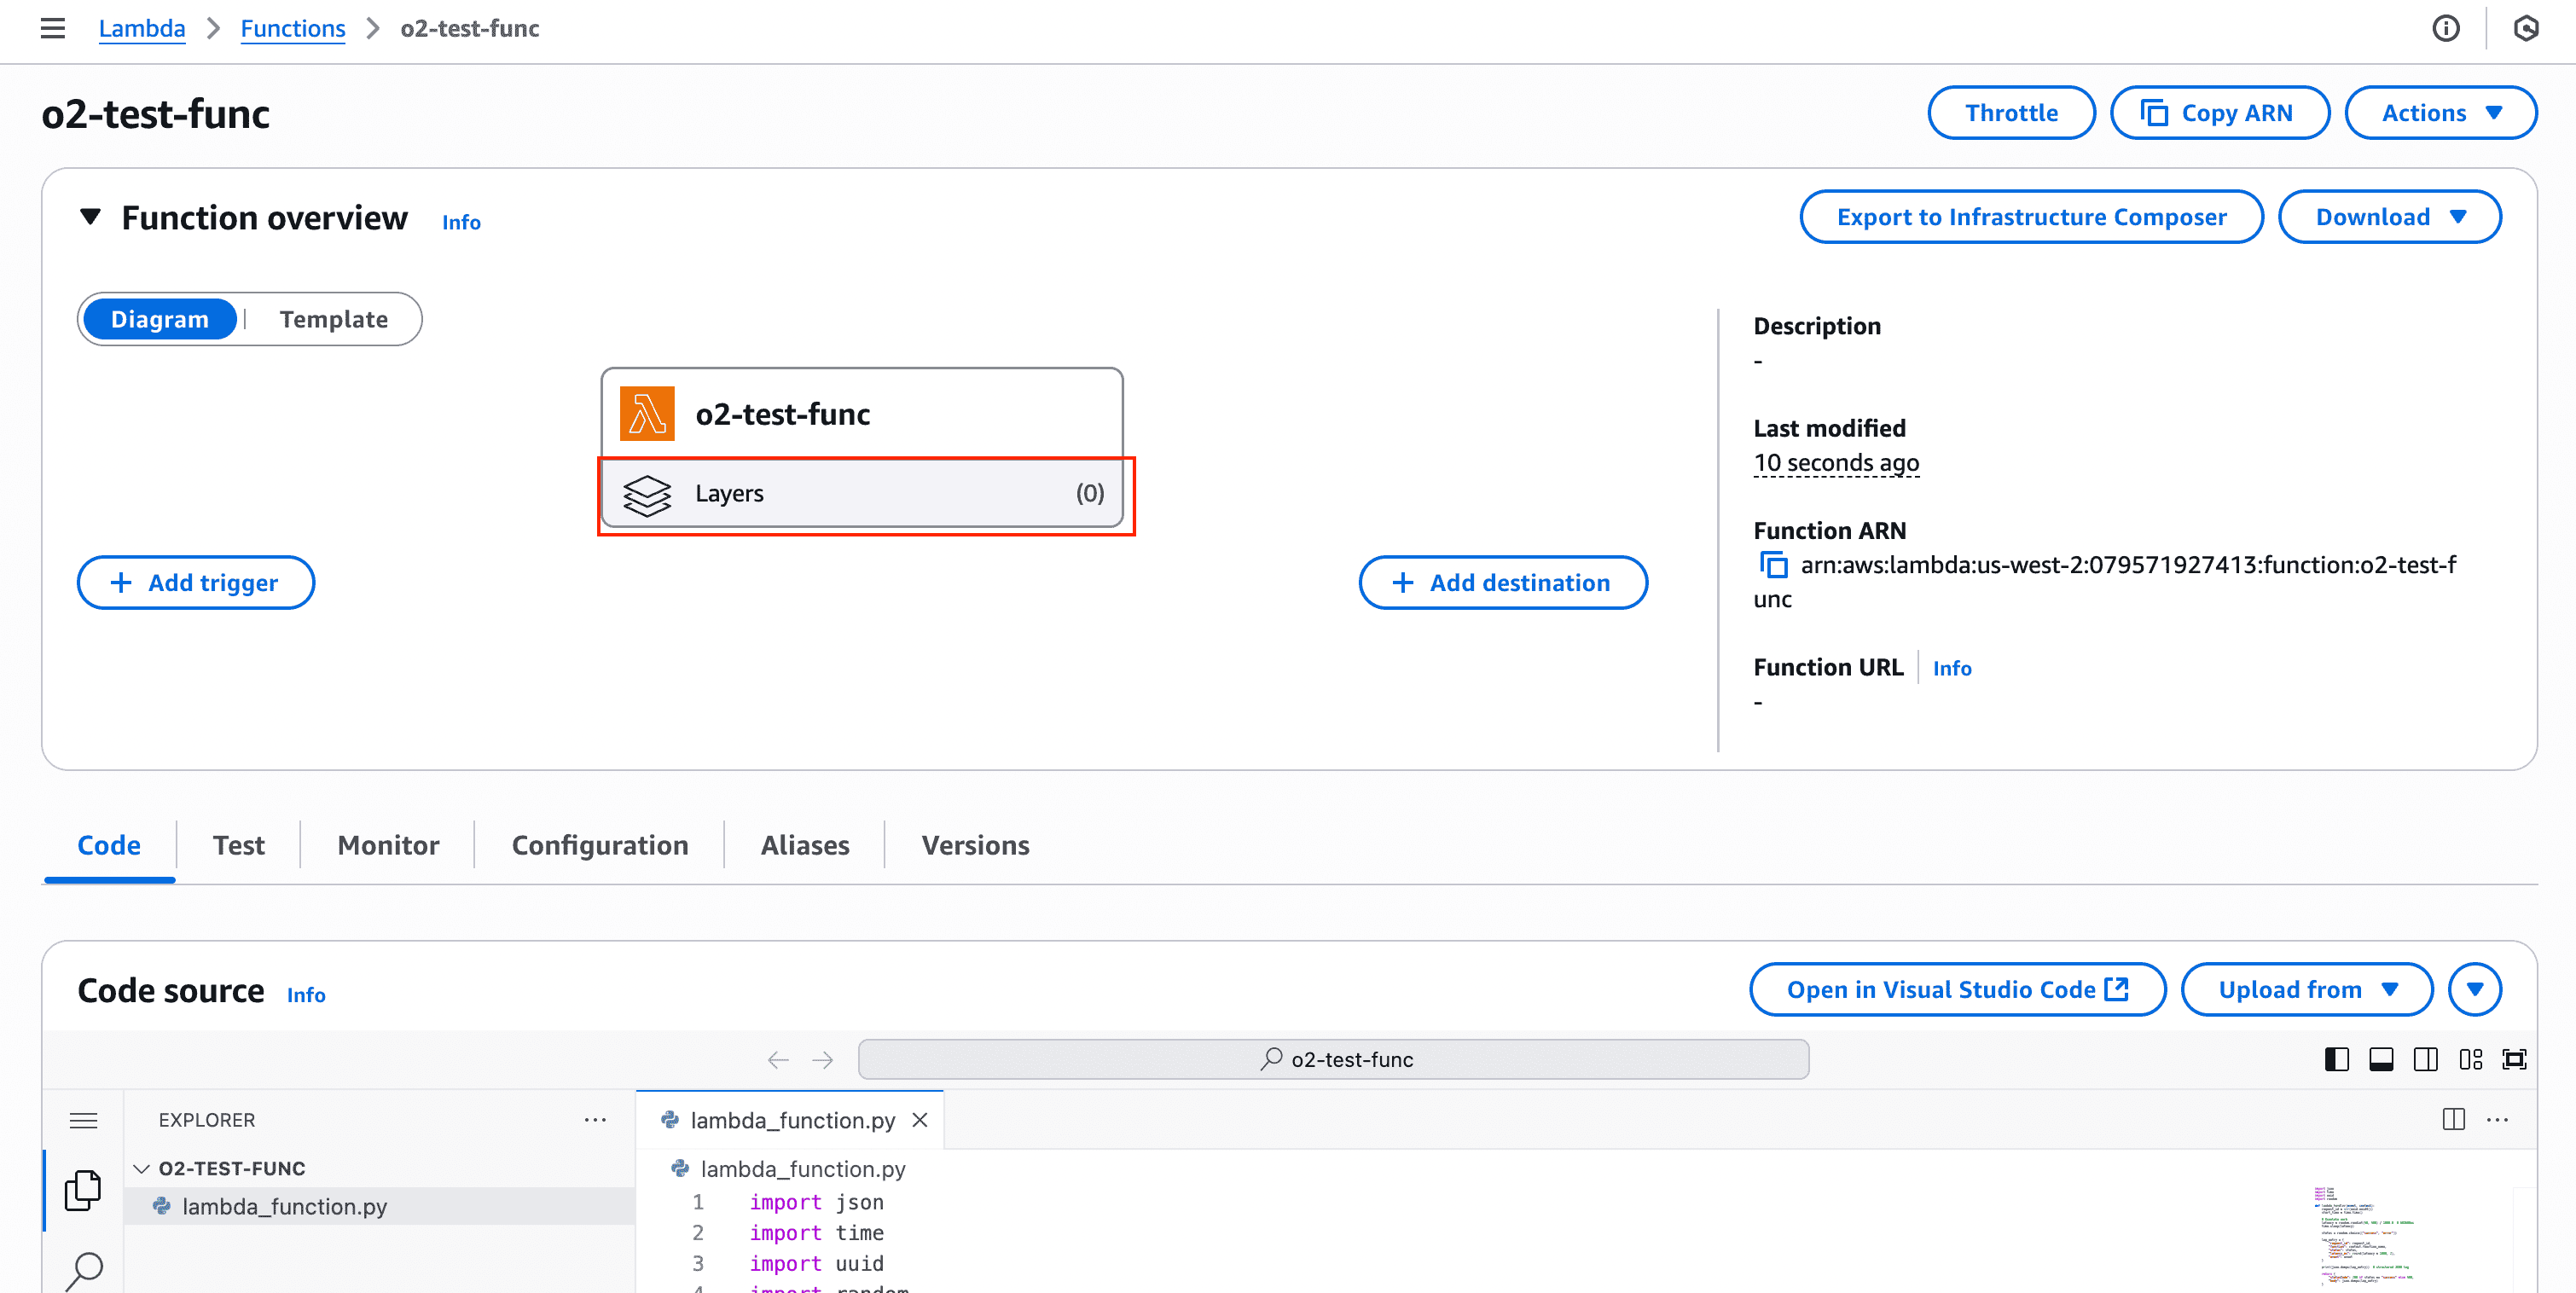
Click Add a layer

Choose “Specify an ARN”
Paste the ARN you got from Step 1 (like
arn:aws:lambda<aws_region_id>:325553860333:layer:openobserve-extension-x86_64:1)Save changes
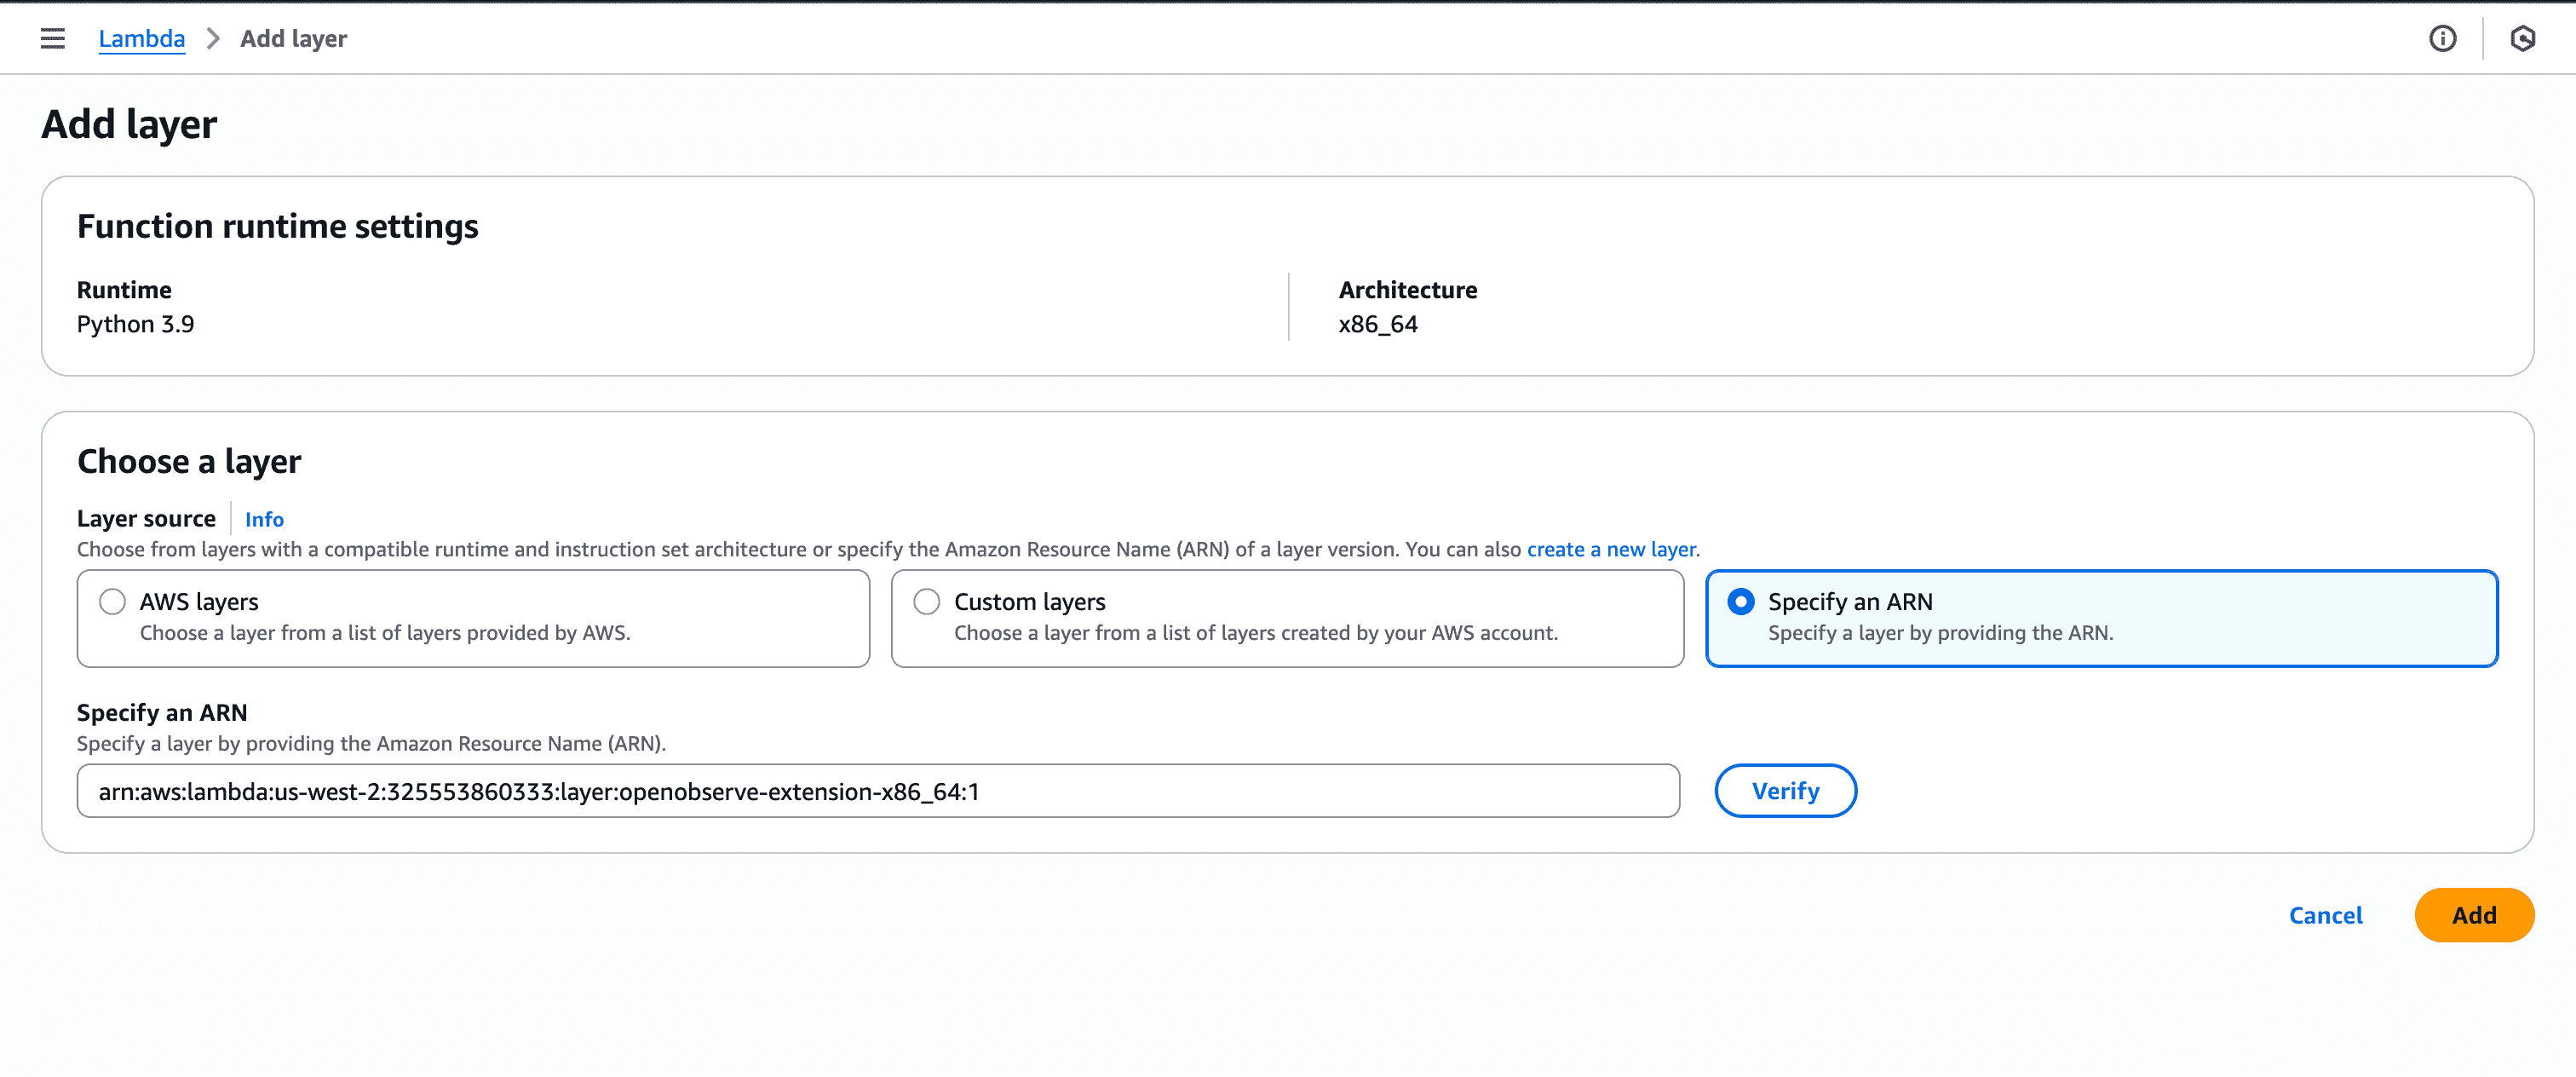
Note: Make sure you select the matching architecture for your Lambda function (x86_64 or arm64). If you deployed both earlier, you’ll have two ARNs, pick the right one.
Step 3: Configure OpenObserve Environment Variables
The extension needs to know where to send logs and how to authenticate. For that, we configure environment variables:
- Go to your Lambda function → Configuration tab → Environment variables
- Add the following:
| Key | Value | Notes |
|---|---|---|
O2_ENDPOINT |
https://api.openobserve.ai | Your OpenObserve API endpoint. If using self-hosted, use http(s)://<host>:5080 |
O2_AUTHORIZATION_HEADER |
Basic <your_base64_encoded_credentials> | API token for authentication |
O2_ORGANIZATION_ID |
<org> (e.g., default) |
Your OpenObserve org ID. If you never created one, it’s usually default. |
O2_STREAM |
lambda_logs |
The name of the stream in OpenObserve where Lambda logs will be stored. You can customize this. |
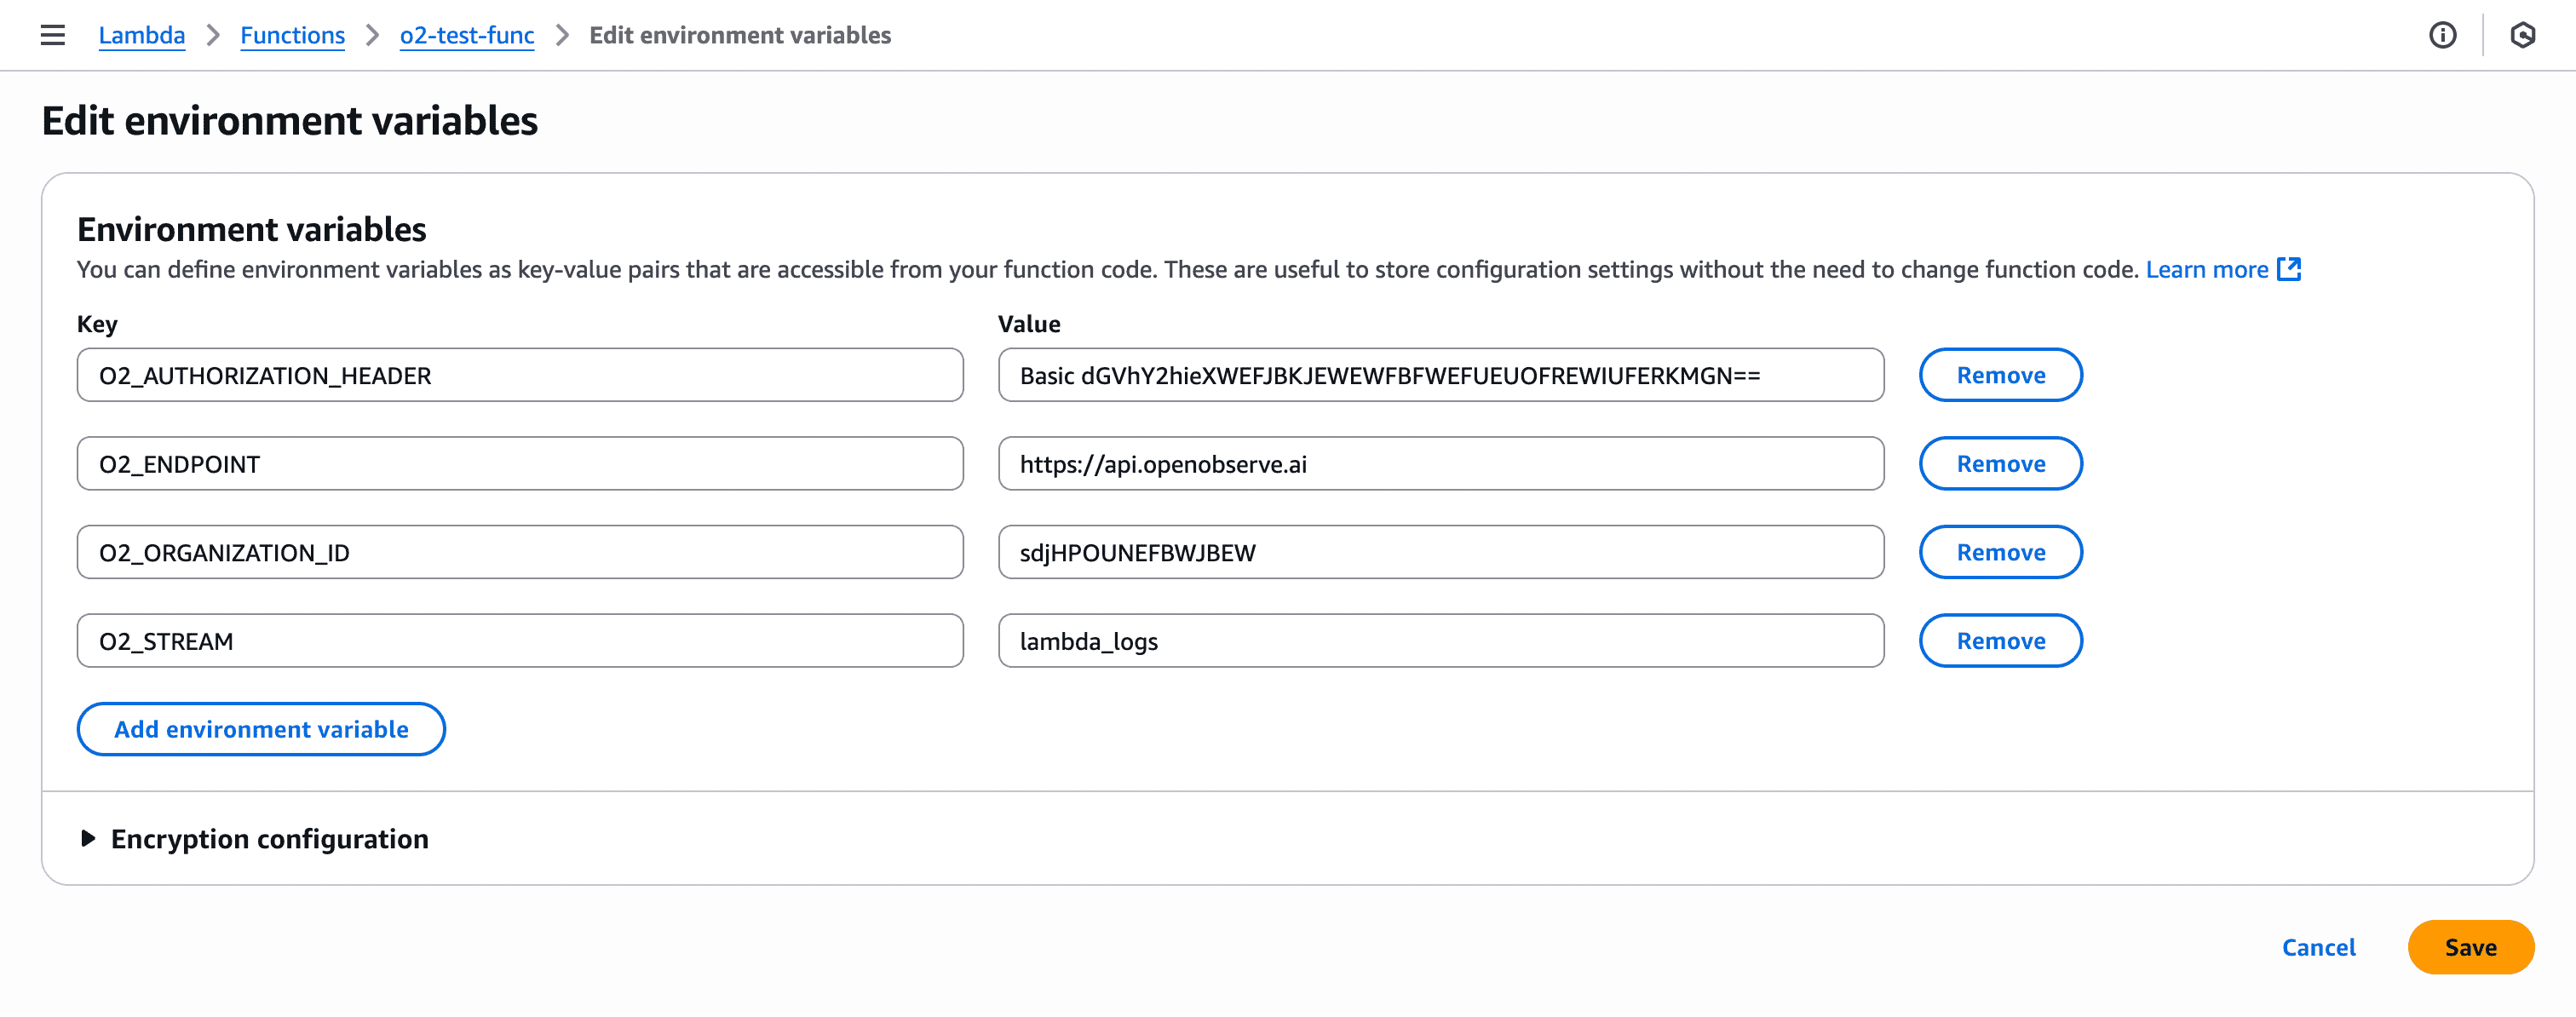
Save the environment variables. Now the extension knows where to forward your logs.
Security Note: Use AWS Secrets Manager to store credentials like O2_AUTHORIZATION_HEADER securely.
Step 4: Invoke the Function
Now that your Lambda is ready and the OpenObserve extension is attached, let’s generate some logs.
Run a test event from your terminal:
aws lambda invoke \
  --function-name <function-name>\
  response.json
- This executes your function once.
- The response will be saved into a file called
response.json.
Tip: You can also test multiple times or with random payloads to see more varied data. For example:
for i in {1..5}; do \
  aws lambda invoke --function-name o2-test-func response.json; \
done
This will trigger five invocations back-to-back, creating multiple log entries in OpenObserve.
Step 5: Verify in OpenObserve
Finally, let’s check if the logs are flowing into OpenObserve.
- Log in to your OpenObserve UI
- Go to Logs Explorer
- Select the stream you configured in Step 4 (e.g.,
lambda-logs)
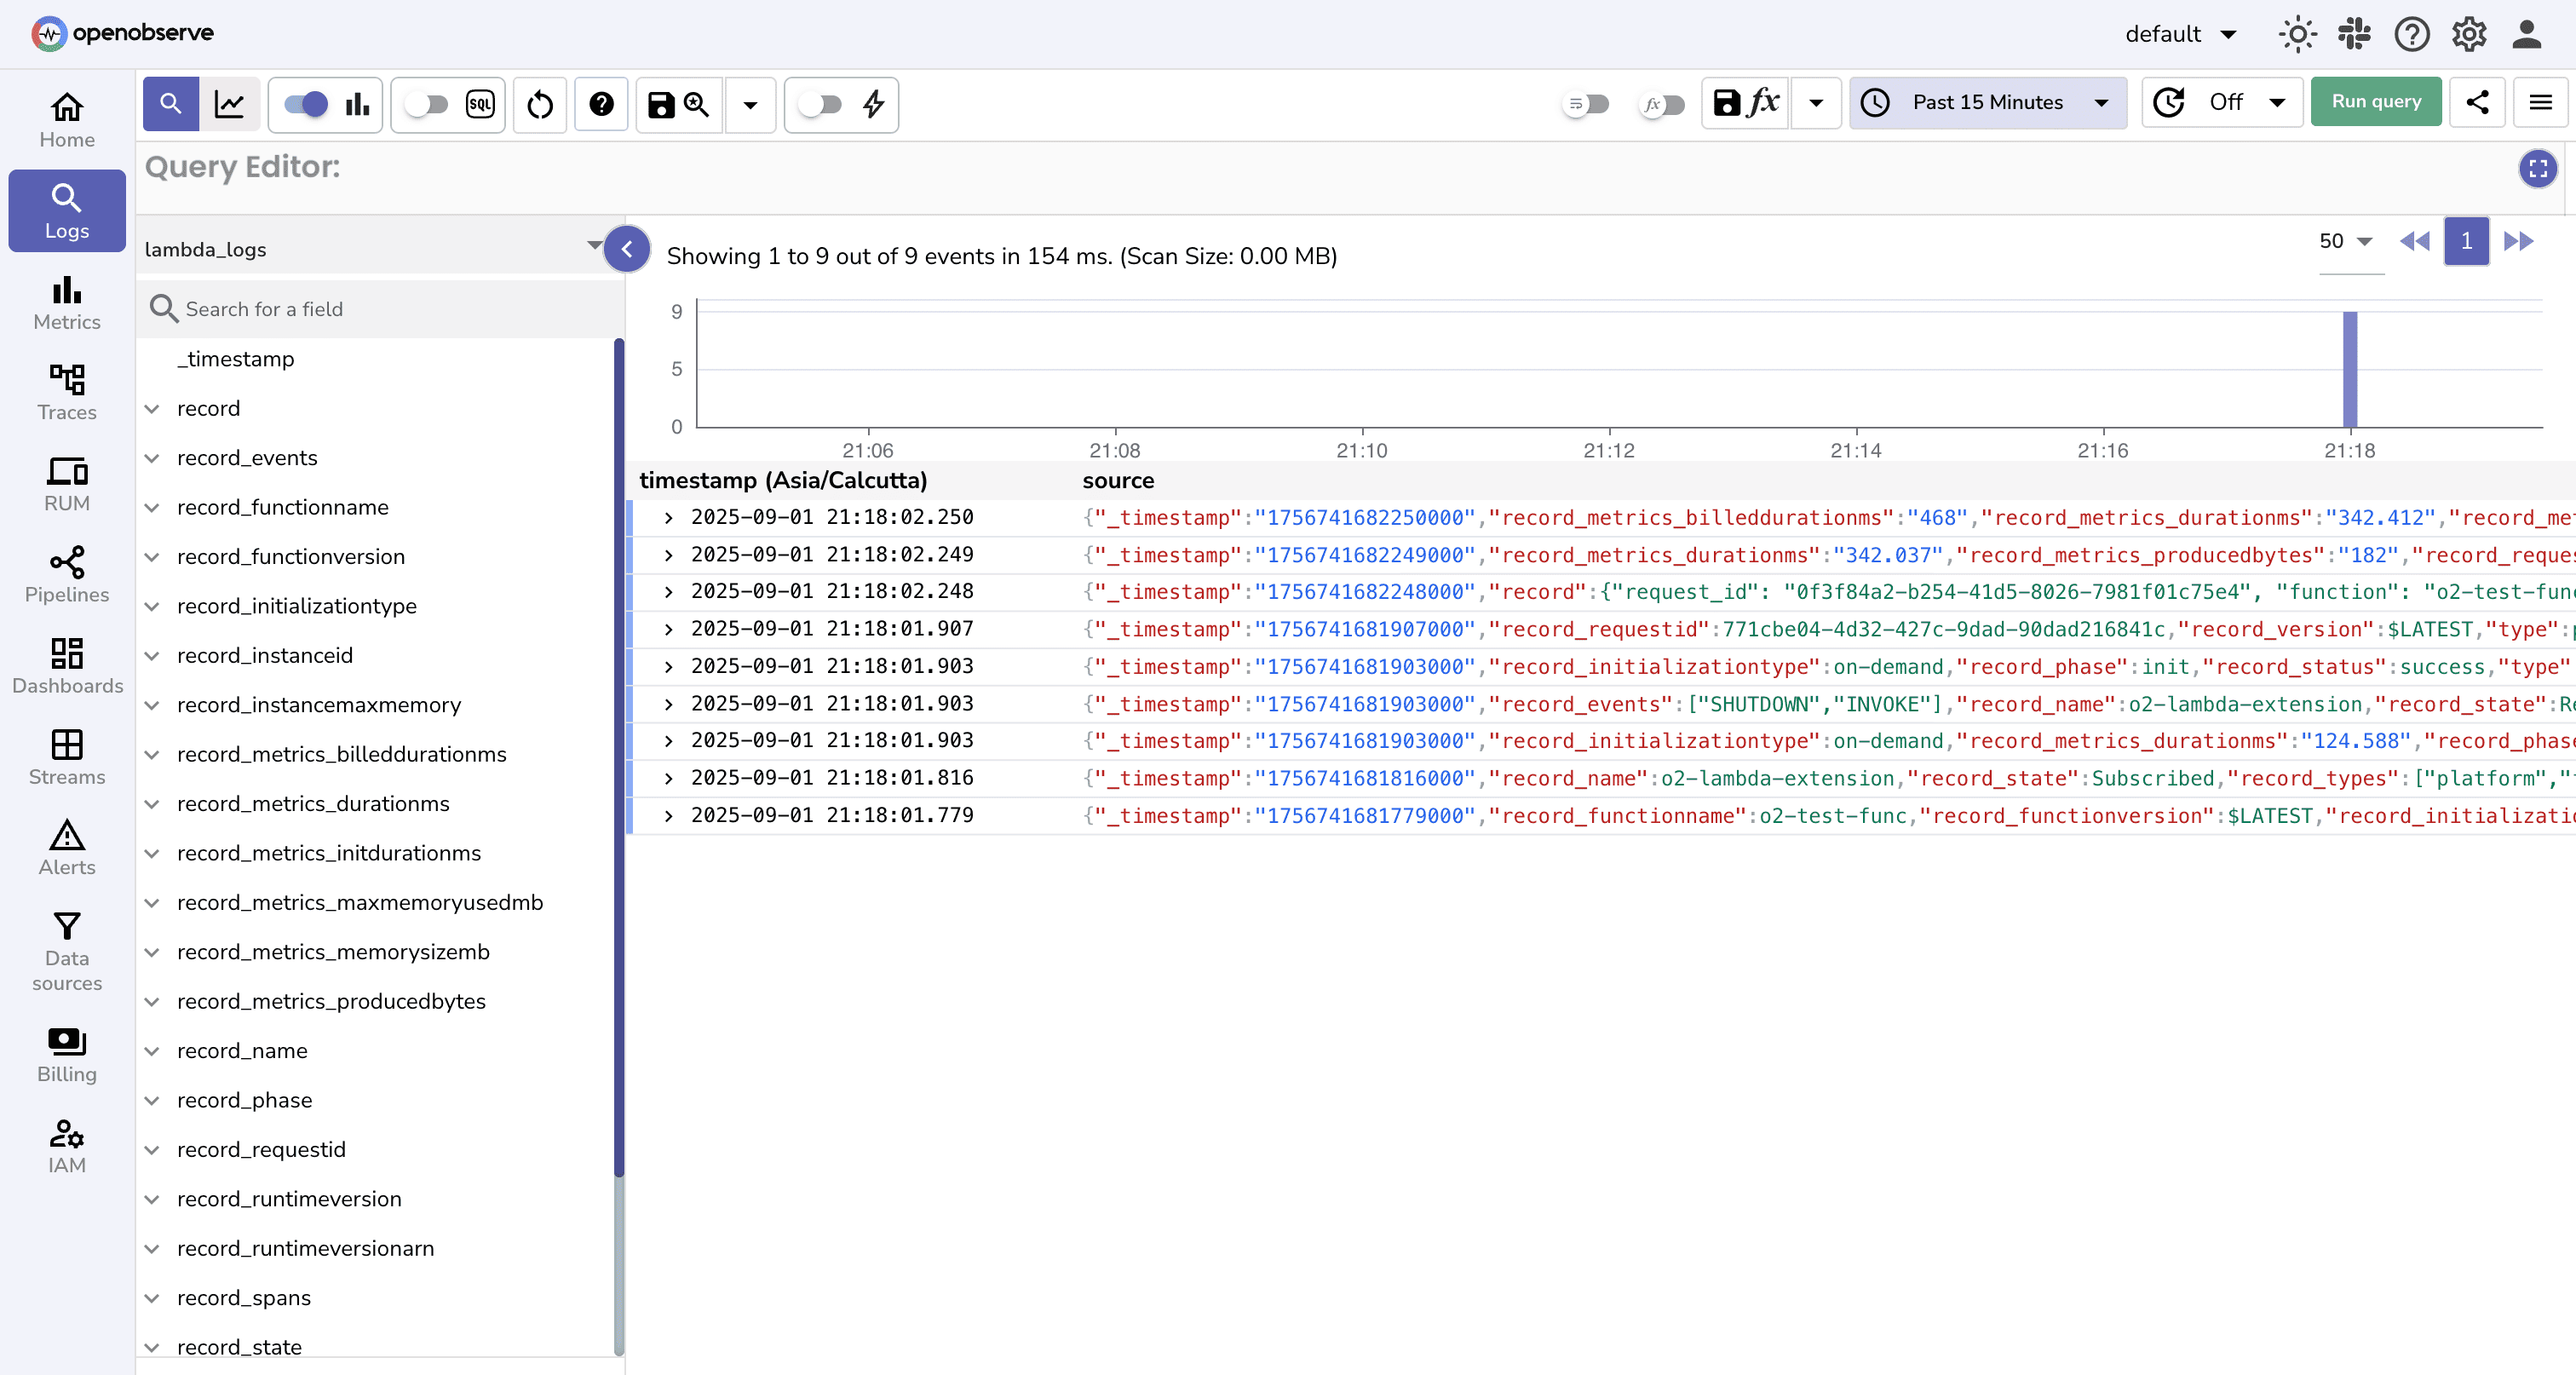
If you see logs here, congrats ! your Lambda is now fully integrated with OpenObserve!
You’ll notice two types of log entries:
Function logs (from your Lambda code)
These are what you explicitly log with logger.info (or print in other languages).
Filter out on logs where type= function using SQL query:
SELECT * FROM "lambda_logs" where type = 'function'
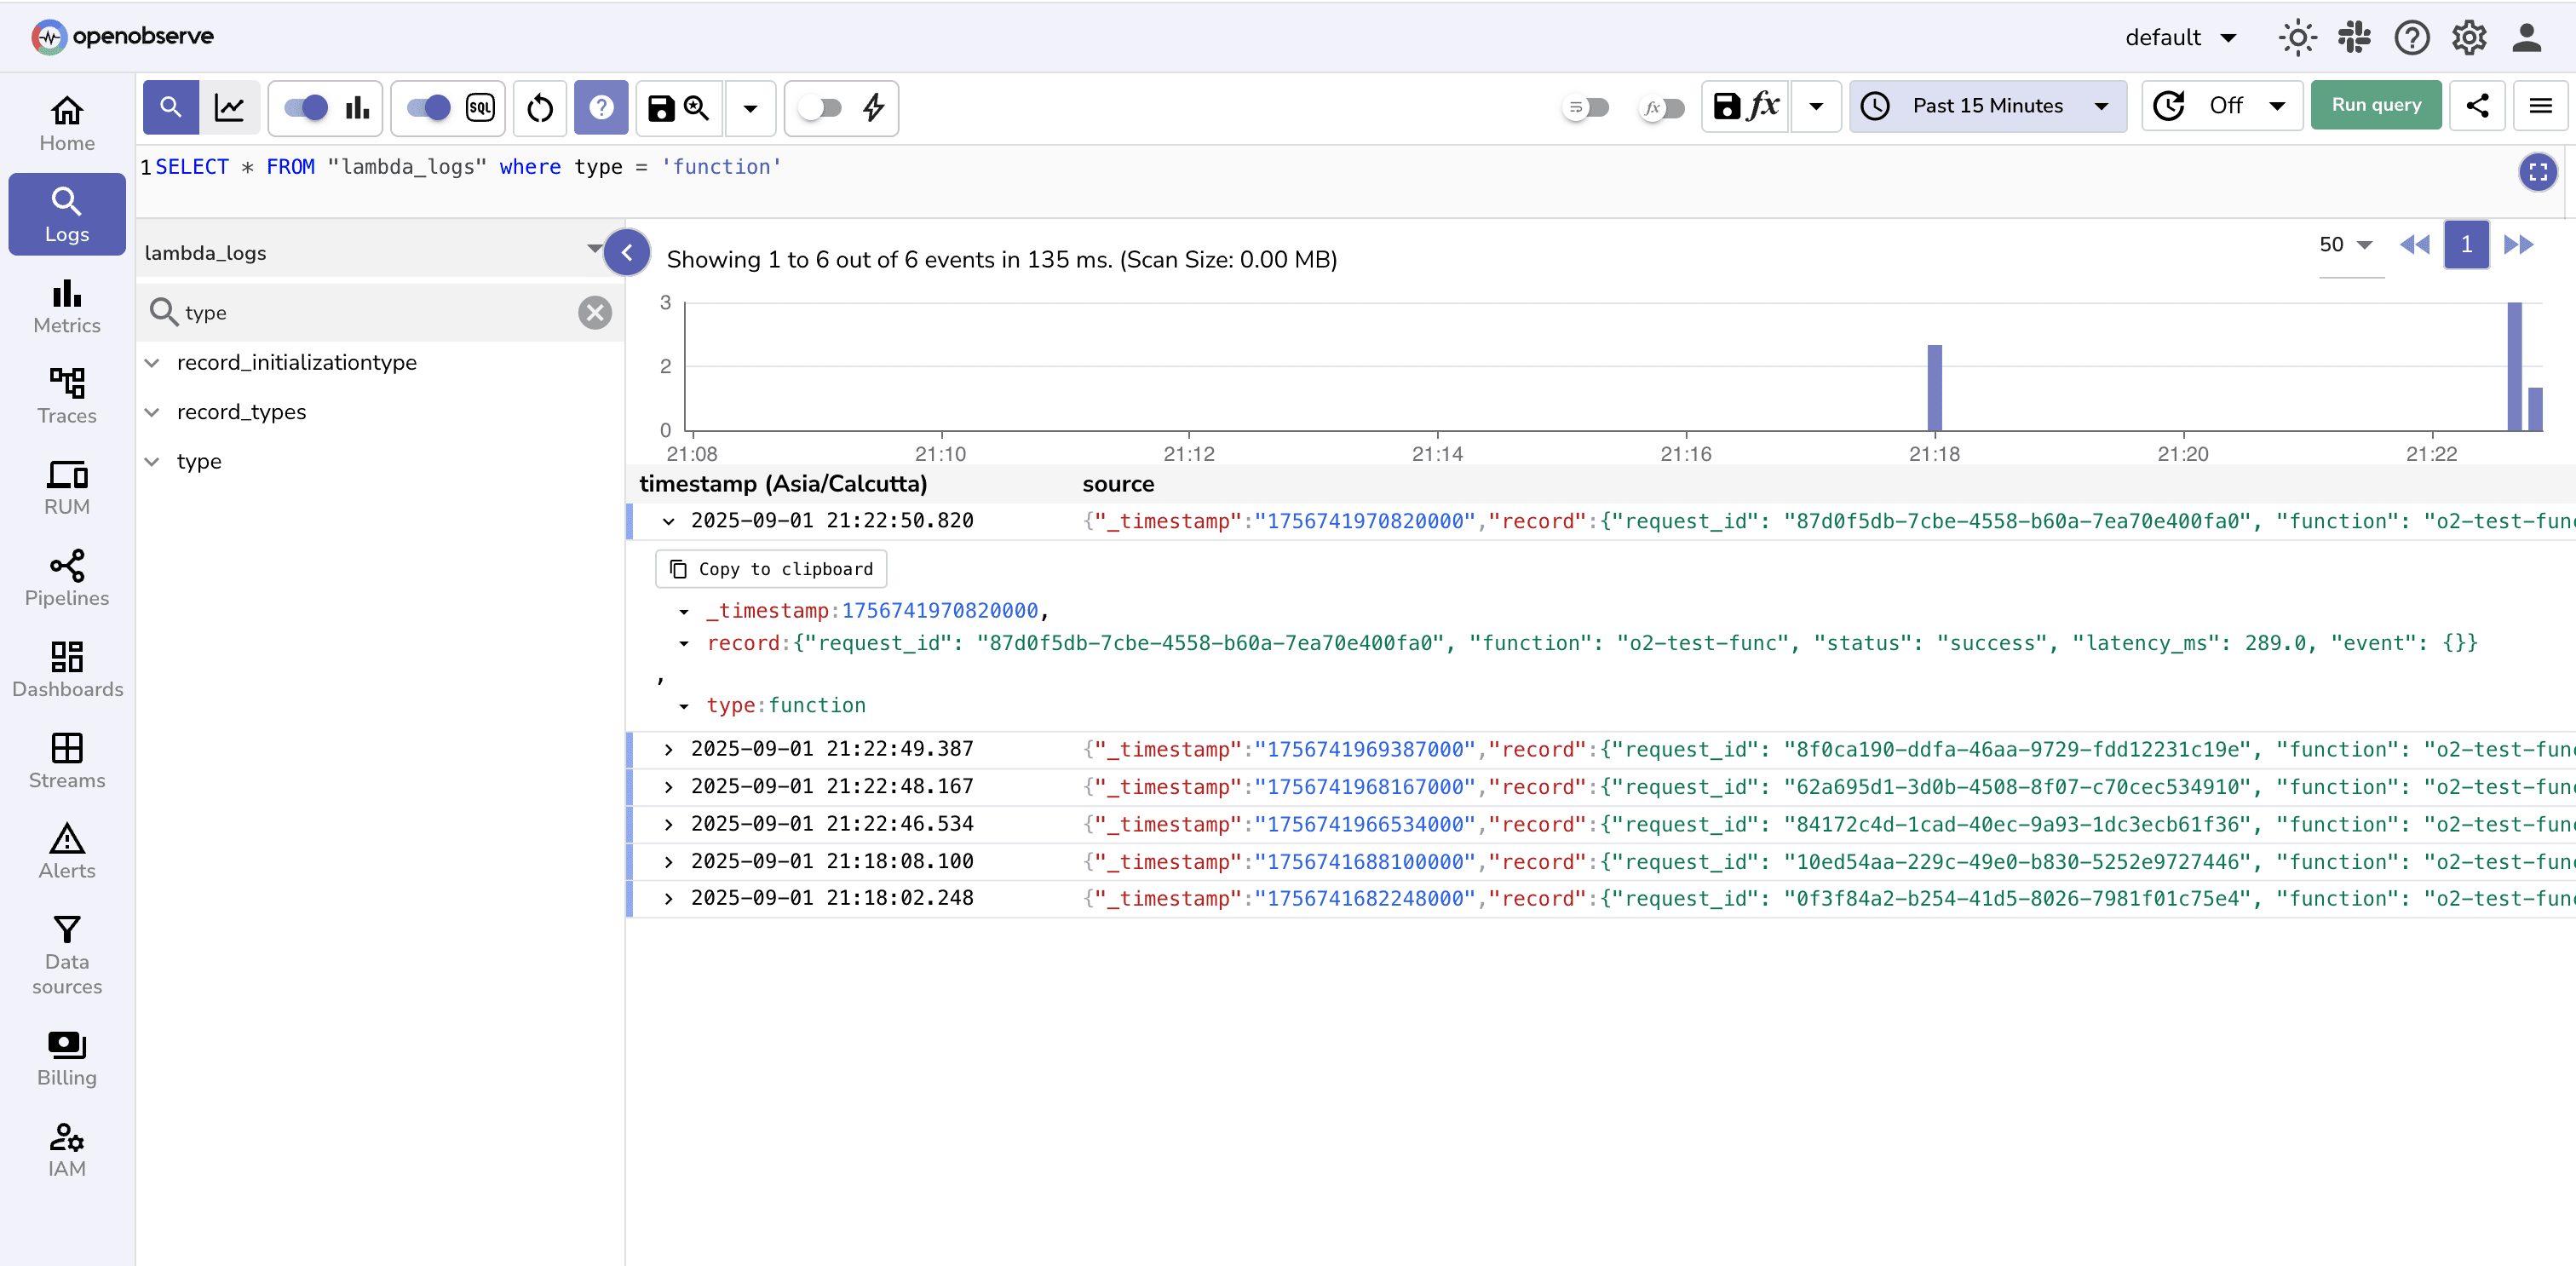
Note: These will look different for every Lambda since they depend entirely on how your function code logs.
Platform logs (from AWS)
These are automatically generated by the Lambda runtime. They include performance, billing, and resource usage details like:
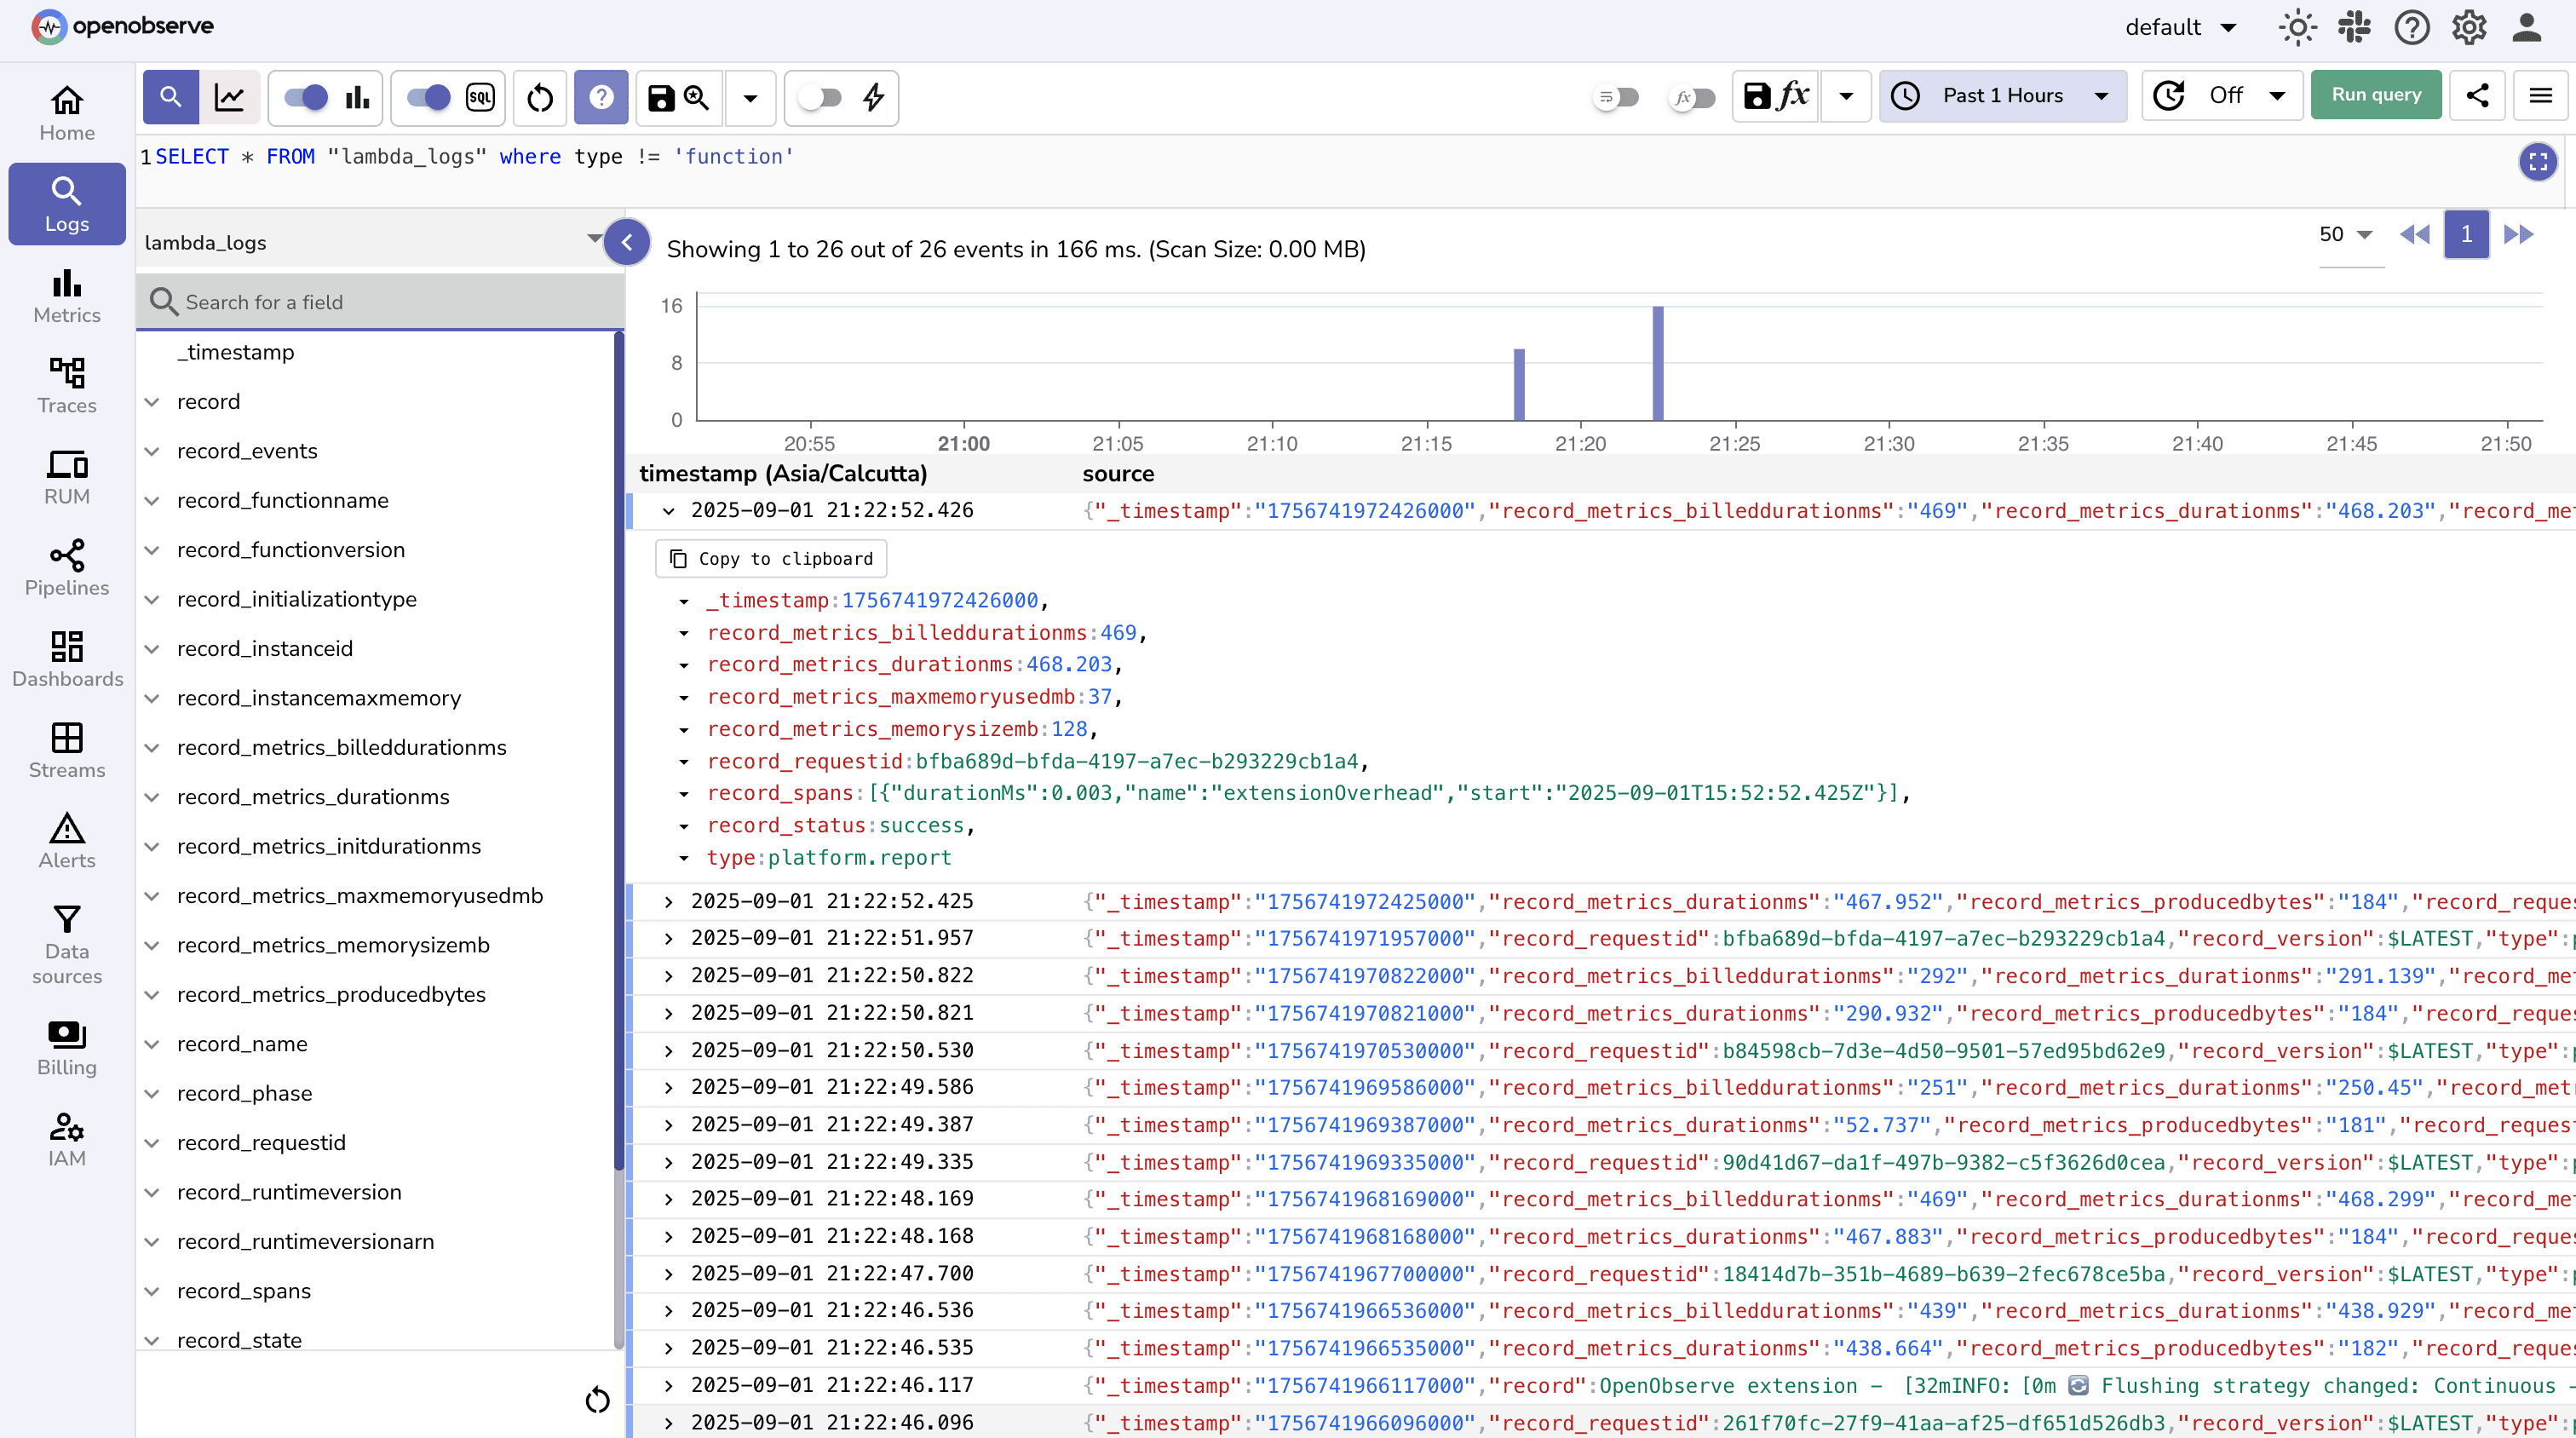
Note: These will always be present, even if your Lambda code doesn’t log anything.
Troubleshooting
Even after setup, you may not see logs in OpenObserve right away. Here are common issues and fixes:
No logs showing in OpenObserve
- Double-check that the stream you selected in UI matches with the one used in configuration (
O2_STREAM). - Make sure environment variables (
O2_ENDPOINT,O2_AUTHORIZATION_HEADER,O2_ORGANIZATION_ID) are set correctly.
- Double-check that the stream you selected in UI matches with the one used in configuration (
Architecture mismatch
- If you attached the wrong extension layer (x86_64 vs arm64), the function will still run, but the extension won’t load.
- Use:
aws lambda get-function-configuration \
  --function-name <function_name> \
  --query 'Architectures'
to confirm the correct architecture.
Conclusion
With the OpenObserve Lambda Extension, you can bypass CloudWatch , stream logs directly into OpenObserve, and gain real-time observability into your serverless workloads. Benefits include:
- Fast Insights: No digging through CloudWatch
- Cost Savings: Cost Efficient (no log retention fees)
- Unified Insights: Unified logs, metrics, and traces in OpenObserve
Tip: To bypass CloudWatch, you can remove or restrict the Lambda function’s IAM permissions for CloudWatch logging (logs:CreateLogGroup, logs:CreateLogStream, logs:PutLogEvents), ensuring logs are sent only through the OpenObserve Lambda Extension.
This setup makes it much easier to monitor performance, debug issues, and correlate Lambda behavior with the rest of your system. Once logs are flowing, you can:
- Build dashboards around function latency, memory usage, and errors
- Set up alerts on anomalies or failures
- Combine Lambda logs with application logs and metrics for full-stack observability
Ready to Get More from Your Logs, Metrics, and Traces?
- Sign up for a 14-day free Cloud trial and integrate your metrics, logs, and traces into one powerful platform to boost your operational efficiency and enable smarter, faster decision-making.
- Get an OpenObserve Demo
About the Author
Simran Kumari

Passionate about observability, AI systems, and cloud-native tools. All in on DevOps and improving the developer experience.
Follow OpenObserve on Google
Add OpenObserve as a preferred source to see more of our articles in Google Search and Top Stories.












