How to Monitor Kubernetes Logs at Scale




Ready to get started?
Try OpenObserve Cloud today for more efficient and performant observability.
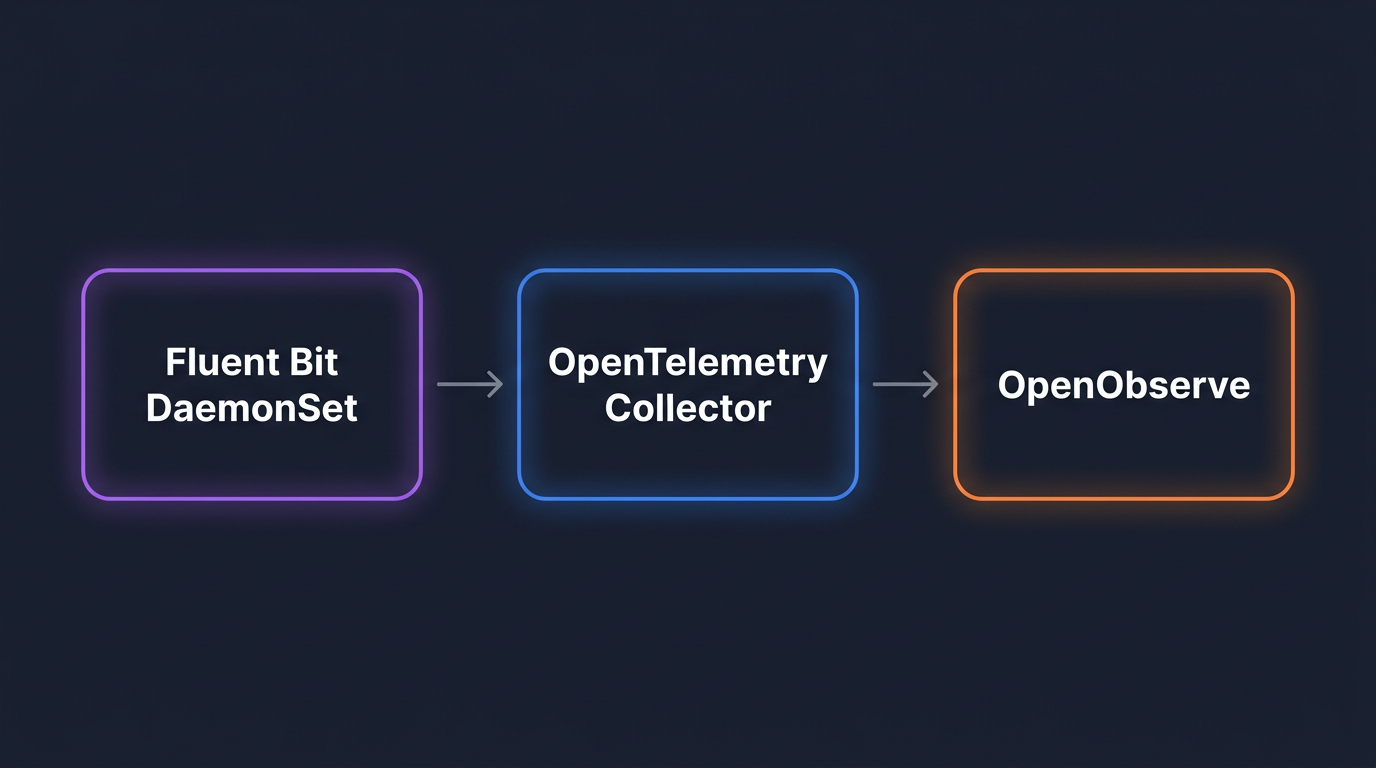
TLDR
- The fast path: install the
openobserve-collectorHelm chart. It ships an OpenTelemetry Collector configured as a node-level agent and a cluster gateway, withk8sattributesand the right processors already wired in. - The custom path: assemble Fluent Bit as a DaemonSet and an OpenTelemetry Collector as a gateway yourself. Choose this when you need lower per-node memory, edge filtering by namespace or regex, or topologies the chart does not cover.
- Either way, send logs to a backend whose storage cost does not scale linearly with retention. Object-store-native systems like OpenObserve keep 12+ months of logs affordably.
- Inject a
k8s.cluster.nameattribute at the gateway so multi-cluster queries actually work. - Filter at source: drop debug logs, noisy namespaces, and health-check spam before they leave the node.
- Monitor the pipeline itself: dropped records, queue depth, export errors, and ingestion lag are the metrics that page you at 3 AM.
This guide is a working tutorial for platform engineers running Kubernetes in production. By the end you will have a working log pipeline forwarding to OpenObserve over OTLP/HTTP - installed either as a single Helm chart or hand-assembled from Fluent Bit and the OpenTelemetry Collector - with multi-cluster labels, namespace-level filtering, and a retention plan that is not going to surprise finance.
If you also need metrics and traces from your clusters, the metrics and traces side of the pipeline follows the same shape.
Why Kubernetes logging breaks at scale
Three things change when you go from a single staging cluster to a fleet.
Volume. Log volume per node varies widely with workload chattiness, but busy nodes routinely push multiple GB per day. A 200-node cluster averaging 5 GB per node per day is 1 TB per day. Multiply by a year and you are talking about 365 TB to retain. Most logging stacks were not designed for that retention curve.
Cardinality. Pods are short-lived. A cluster with 500 pods and 10 deployments per week produces tens of thousands of unique pod_name values per month. If your backend indexes labels per log line, your index gets fat and your queries slow down.
Operational distance. Logs in kubectl logs are not durable. The container restarts and the logs are gone. The kubelet rotates files. Pods get evicted. Any monitoring that depends on shelling into a node is not a strategy.
What "at scale" actually means in this post: 5+ clusters, 500+ GB per day total ingest, 90+ day retention, and a need to query across all of it without a Kafka cluster between you and your terminal.
The pipeline: agent, gateway, backend
Each scale problem above maps to a specific layer of the pipeline below. The volume problem is handled by filtering and sampling close to the source, before logs leave the node. The cardinality problem is handled by enriching records once at a central gateway instead of indexing labels at the backend. The operational-distance problem is handled by durable forwarding, so the cost of a node failure is "logs delayed" rather than "logs lost."
Any working pipeline has three roles, regardless of which binaries you install.
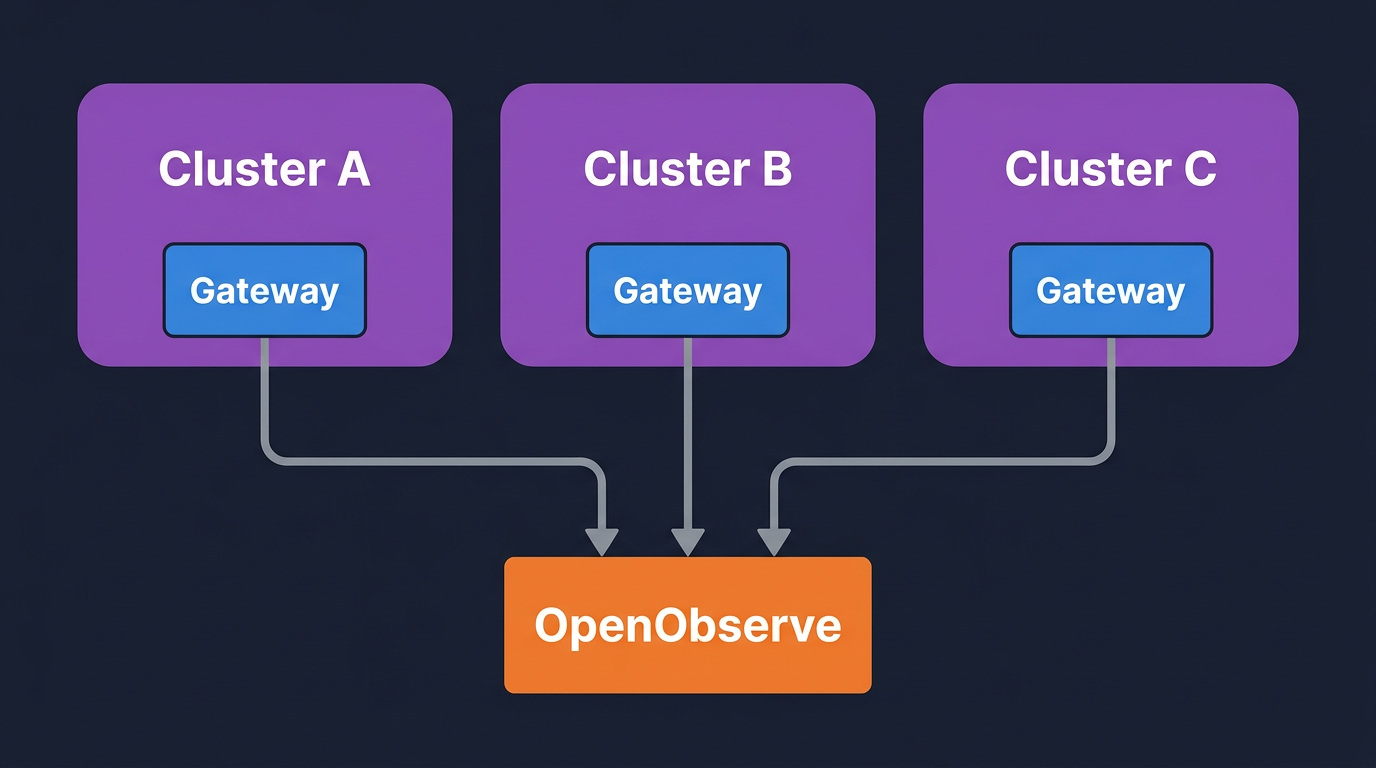
Agent, on every node. Tails /var/log/containers/*.log, parses container metadata, applies cheap filters (drop by namespace, drop health checks), and forwards over OTLP/HTTP to the gateway. Per-node memory footprint matters because you are paying for it on every node.
Gateway, as a cluster-wide Deployment. Receives OTLP from all agents, enriches with k8sattributes, applies the expensive processors (parsing, redaction, severity-based filtering), batches, and exports to the backend. Running enrichment at a few replicas instead of every node is what keeps cardinality and CPU under control.
Backend, with object-store-native storage. OpenObserve stores compressed columnar data on S3 (or any S3-compatible object store) and queries it with SQL. The S3-native model is the reason 12-month retention is affordable - cold data sits on object storage instead of indexed compute.
There are two reasonable ways to install the agent and gateway.
- Use the
openobserve-collectorHelm chart. A single OpenTelemetry Collector deployed in both agent mode (DaemonSet) and gateway mode (Deployment), withk8sattributes,batch,memory_limiter, and retry/queue settings already configured. Onehelm install, opinionated defaults, recommended for most clusters. Covered in the next section. - Assemble Fluent Bit + OpenTelemetry Collector yourself. Fluent Bit handles the per-node tailing job (lower memory - roughly 50 MiB less RAM than the OTel Collector under comparable workloads, per the VictoriaMetrics 2026 benchmark) and a separate OTel Collector handles transform and routing. Choose this when you need edge filtering by namespace/regex, per-tenant routing rules, or split topologies the chart does not cover. The "Custom pipeline" sections below walk through this.
Both paths converge on the same backend and the same queries, retention, and health-monitoring patterns later in this post.
Quickstart: the openobserve-collector Helm chart
This is the right path for most clusters. One Helm release installs both the agent (DaemonSet) and the gateway (Deployment), pre-wires k8sattributes and the other processors, and sets sensible defaults for batching, memory limits, and retry/queue behaviour.
Prerequisite: the OpenTelemetry Operator. The chart deploys its agent and gateway as OpenTelemetryCollector custom resources, which require the OpenTelemetry Operator CRDs to already exist. Install it once per cluster:
helm repo add open-telemetry https://open-telemetry.github.io/opentelemetry-helm-charts
helm repo update

helm install otel-operator open-telemetry/opentelemetry-operator \
  --namespace opentelemetry-operator-system --create-namespace \
  --set admissionWebhooks.certManager.enabled=false \
  --set admissionWebhooks.autoGenerateCert.enabled=true \
  --set manager.collectorImage.repository=otel/opentelemetry-collector-contrib
The autoGenerateCert flag avoids needing cert-manager. If you already run cert-manager, drop both webhook flags.
Next, base64-encode your OpenObserve credentials. The chart uses Basic auth in an Authorization header:
echo -n 'admin@example.com:YourPasswordHere' | base64
Then install the chart. Two endpoint details matter: include /api/<org> in the URL (OpenObserve's OTLP path is org-scoped - default is the org you get on a fresh install) and set the stream-name header to route records to the k8s_logs stream:
helm repo add openobserve https://charts.openobserve.ai
helm repo update

helm install o2c openobserve/openobserve-collector \
  --namespace openobserve-collector --create-namespace \
  --set k8sCluster=prod-us-east-1 \
  --set exporters."otlphttp/openobserve".endpoint=http://openobserve.example.com:5080/api/default \
  --set exporters."otlphttp/openobserve".headers.Authorization="Basic BASE64_CREDENTIAL" \
  --set exporters."otlphttp/openobserve".headers."stream-name"=k8s_logs \
  --set exporters."otlphttp/openobserve_k8s_events".endpoint=http://openobserve.example.com:5080/api/default \
  --set exporters."otlphttp/openobserve_k8s_events".headers.Authorization="Basic BASE64_CREDENTIAL"
The k8sCluster value is the cluster label that ends up on every record as k8s.cluster.name - set it per cluster if you operate more than one, because multi-cluster queries depend on it.
Within a minute or two, logs start landing in the default org under the k8s_logs stream:
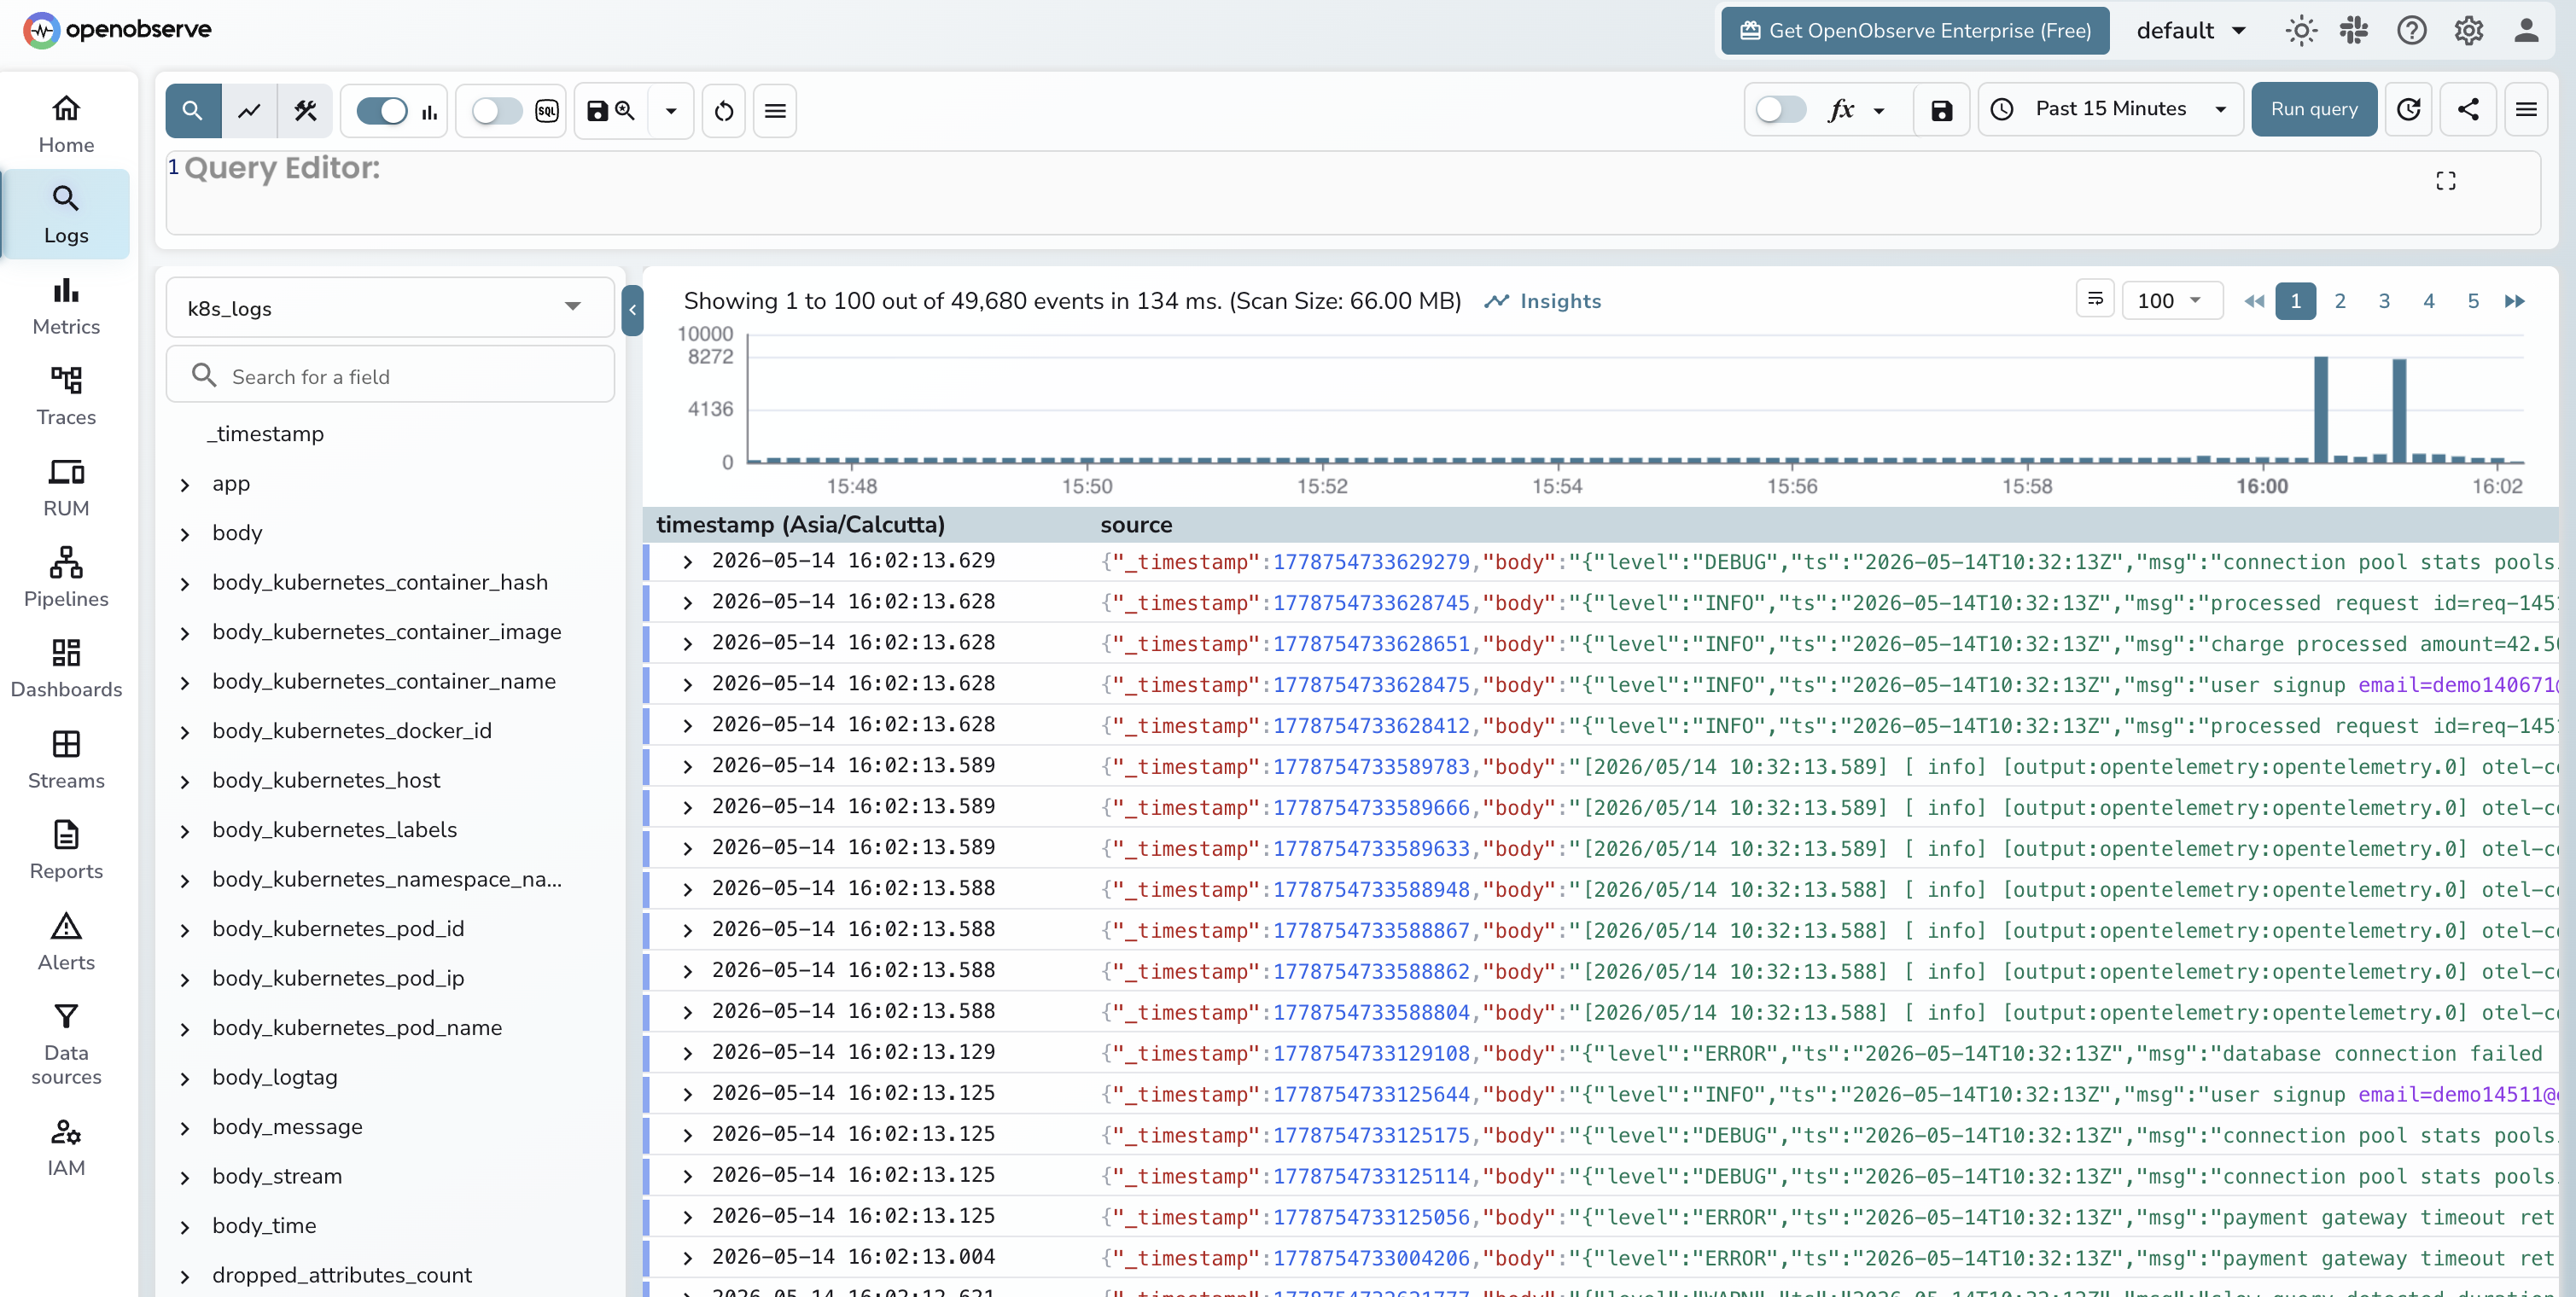
What the chart configures for you, so you know what you would be replacing if you swap it out:
- Agent (DaemonSet) tailing container logs and host metrics on every node, plus
k8sattributesenrichment so each record carriesk8s.namespace.name,k8s.pod.name,k8s.deployment.name, and labels. - Gateway (Deployment) receiving OTLP from agents, applying
memory_limiter,batch, and re-enrichment for any records that arrived without metadata. - Kubernetes events ingestion to a separate
k8s_eventsstream - useful for correlating pod restarts and OOMKills with log spikes. - kube-state-metrics enabled by default for cluster-state metrics.
- Retry, queue, and gzip compression already configured on the OTLP exporter.
If the chart defaults work for you, skip the next two sections and jump to Querying logs in OpenObserve. The rest of this post - querying, multi-cluster patterns, filtering, retention, and health monitoring - applies regardless of which collector path you chose.
Custom pipeline: when to build it yourself
The opinionated chart covers the common case. There are three reasons to assemble the pipeline by hand instead.
- Per-node memory budget. Fluent Bit's footprint is roughly 50 MiB lower per node than the OTel Collector. On large clusters that adds up - 50 MiB × 500 nodes is 25 GiB of RAM you are not paying for. If you are running the agent on memory-constrained nodes (edge clusters, ARM instances, GPU nodes where every MiB belongs to the workload), Fluent Bit at the edge is the better choice.
- Edge filtering and parsing. Fluent Bit's
tail+kubernetes+grepfilter combination lets you drop noisy namespaces, healthz spam, and known-useless message patterns at the node, before any data crosses the network. The OTel Collector can do this too, but Fluent Bit's regex filters are cheaper per record. - Split topologies. If you want one collector pattern at the edge and a different one centrally - for example, edge clusters with only Fluent Bit forwarding into a regional OTel gateway in a hub cluster - you need the pieces separate. The chart bundles them as one unit.
The next two sections walk through the custom path: a Fluent Bit DaemonSet on every node forwarding to a stand-alone OpenTelemetry Collector gateway. The output is the same k8s_logs stream you would get from the chart, so the querying, retention, and dashboard sections later in the post apply unchanged.
Custom pipeline, part 1: Fluent Bit DaemonSet
Add the Helm repo and install with custom values:
helm repo add fluent https://fluent.github.io/helm-charts
helm repo update
helm upgrade --install fluent-bit fluent/fluent-bit \
  -n logging --create-namespace \
  -f fluent-bit-values.yaml
Here is fluent-bit-values.yaml. The interesting parts are the tail input, the kubernetes filter, the grep drops, and the opentelemetry output:
kind: DaemonSet

config:
  service: |
    [SERVICE]
        Flush         5
        Daemon        Off
        Log_Level     info
        Parsers_File  parsers.conf
        HTTP_Server   On
        HTTP_Listen   0.0.0.0
        HTTP_Port     2020
        Health_Check  On

  inputs: |
    [INPUT]
        Name              tail
        Tag               kube.*
        Path              /var/log/containers/*.log
        Parser            cri
        DB                /var/log/flb_kube.db
        Mem_Buf_Limit     50MB
        Skip_Long_Lines   On
        Refresh_Interval  10

  filters: |
    [FILTER]
        Name                kubernetes
        Match               kube.*
        Kube_URL            https://kubernetes.default.svc:443
        k8s-logging.parser  On
        k8s-logging.exclude On
        Annotations         Off
        Labels              On

    [FILTER]
        Name    grep
        Match   kube.*
        Exclude $kubernetes['namespace_name'] ^(kube-system|cert-manager)$

    [FILTER]
        Name    grep
        Match   kube.*
        Exclude message ^.*\"GET /healthz.*$

  outputs: |
    [OUTPUT]
        Name                 opentelemetry
        Match                kube.*
        Host                 otel-collector.logging.svc.cluster.local
        Port                 4318
        Logs_uri             /v1/logs
        Tls                  Off

resources:
  requests:
    cpu: 50m
    memory: 100Mi
  limits:
    cpu: 200m
    memory: 256Mi

tolerations:
  - operator: Exists
A few notes on what is doing the work:
Parser crimatches the containerd log format. If you are still on Docker, swap to thedockerparser. EKS, GKE, and most modern clusters ship containerd.Mem_Buf_Limit 50MBis the per-input in-memory chunk buffer cap. When the gateway is unreachable Fluent Bit holds logs up to this size in memory, then drops. For longer outages, switch to a filesystem-backedstorage.type filesystemconfiguration.- The kubernetes filter enriches every record with
kubernetes.namespace_name,kubernetes.pod_name,kubernetes.container_name, labels, and host. Note that with the CRI parser, the log content lands in amessagefield, notlog- so Fluent Bit'sMerge_Logdoes not parse application JSON. The Collector'stransformprocessor handles JSON parsing instead (next section). - The two
grepfilters drop kube-system noise and Kubernetes liveness probes. Note the second filter matches againstmessage, notlog- that is the field the CRI parser writes to. Together they cut a meaningful slice of volume on most clusters. Measure before and after with the OpenObserve query for top noisy pods (later in this post). - Tolerations are wide on purpose. You want Fluent Bit on every node, including taints.
If you are setting up Fluent Bit for the first time, the basic Fluent Bit setup post walks the chart install at a slower pace.
Verify the DaemonSet:
kubectl -n logging get daemonset fluent-bit
kubectl -n logging logs -l app.kubernetes.io/name=fluent-bit --tail=20

Custom pipeline, part 2: OpenTelemetry Collector gateway
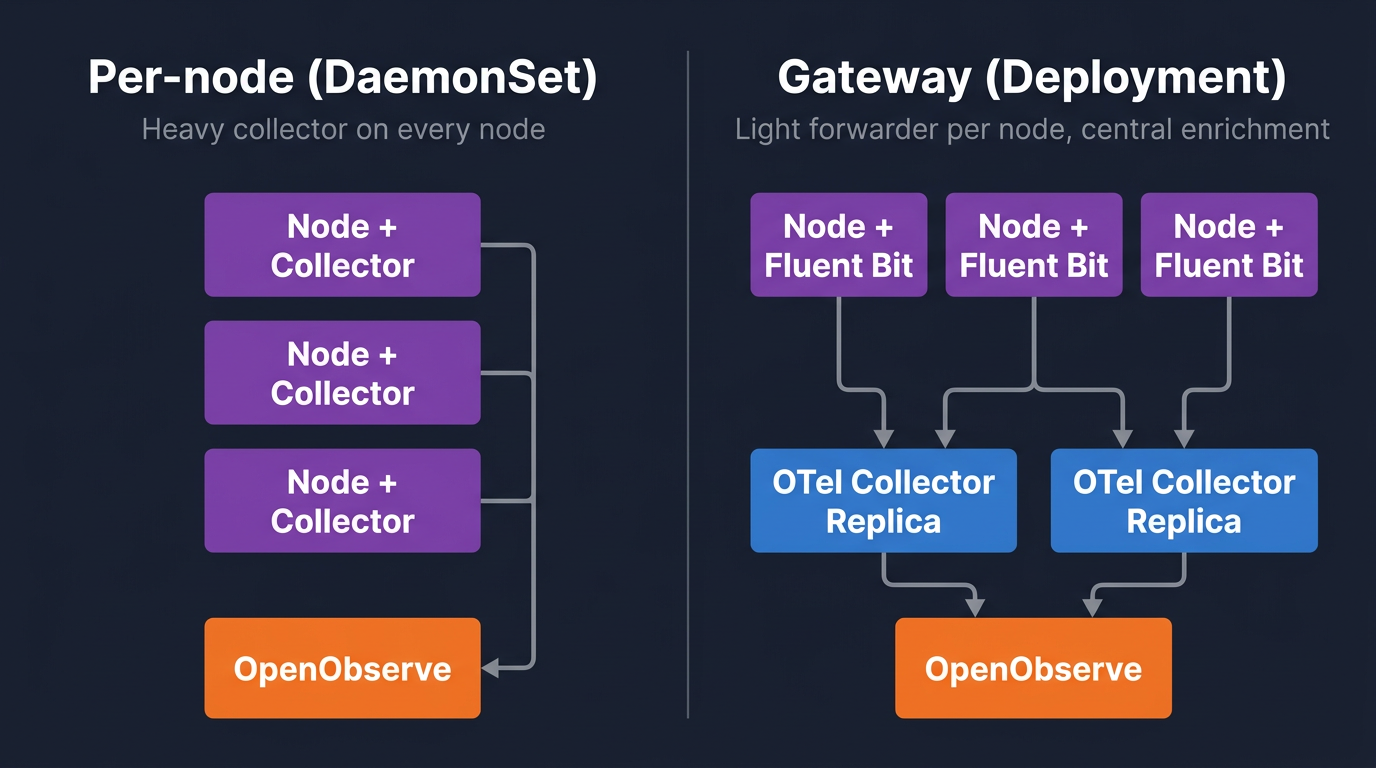
Run the Collector as a Deployment, not a DaemonSet. Three to five replicas for most clusters, fronted by a Service. Use the contrib distribution because you need the k8sattributes and transform processors. The full processor list available in OpenTelemetry Collector Contrib is what makes the gateway pattern work.
Install via the OpenTelemetry Helm chart:
helm repo add open-telemetry https://open-telemetry.github.io/opentelemetry-helm-charts
helm repo update
helm upgrade --install otel-collector open-telemetry/opentelemetry-collector \
  -n logging \
  -f otel-gateway-values.yaml
otel-gateway-values.yaml:
# Gateway pattern (Deployment), not per-node collection
mode: deployment
# Three replicas so one can restart without dropping logs
replicaCount: 3

image:
  repository: otel/opentelemetry-collector-contrib
  # Pin the tag so an upstream release does not break the pipeline silently
  tag: "0.110.0"

# k8sattributes needs API watch permission on these resources
clusterRole:
  create: true
  rules:
    - apiGroups: [""]
      resources: ["pods", "namespaces", "nodes"]
      verbs: ["get", "watch", "list"]
    - apiGroups: ["apps"]
      resources: ["replicasets", "deployments"]
      verbs: ["get", "list", "watch"]

config:
  receivers:
    # 4318 accepts OTLP/HTTP from Fluent Bit. 4317 is gRPC for direct OTLP clients.
    otlp:
      protocols:
        grpc:
          endpoint: 0.0.0.0:4317
        http:
          endpoint: 0.0.0.0:4318

  processors:
    # First processor. Without it the Collector OOMs under spikes and drops everything.
    memory_limiter:
      check_interval: 2s
      limit_percentage: 80
      spike_limit_percentage: 20

    # Bridge between Fluent Bit's record-as-body layout and the rest of the pipeline:
    # lifts kubernetes metadata to resource attributes, parses JSON for severity, replaces body with the message string.
    transform/flatten:
      error_mode: ignore
      log_statements:
        - context: log
          statements:
            - set(resource.attributes["k8s.namespace.name"], body["kubernetes"]["namespace_name"]) where body["kubernetes"]["namespace_name"] != nil
            - set(resource.attributes["k8s.pod.name"], body["kubernetes"]["pod_name"]) where body["kubernetes"]["pod_name"] != nil
            - set(resource.attributes["k8s.container.name"], body["kubernetes"]["container_name"]) where body["kubernetes"]["container_name"] != nil
            - set(resource.attributes["k8s.node.name"], body["kubernetes"]["host"]) where body["kubernetes"]["host"] != nil
            - set(resource.attributes["k8s.pod.uid"], body["kubernetes"]["pod_id"]) where body["kubernetes"]["pod_id"] != nil
            - set(cache["msg"], ParseJSON(body["message"])) where body["message"] != nil and IsMatch(body["message"], "^\\{.*\\}$")
            - set(severity_text, cache["msg"]["level"]) where cache["msg"]["level"] != nil
            - set(body, body["message"]) where body["message"] != nil

    # Adds deployment name and pod labels via API lookup, keyed on the k8s.pod.uid set above.
    k8sattributes:
      auth_type: serviceAccount
      passthrough: false
      extract:
        metadata:
          - k8s.deployment.name
        labels:
          - tag_name: app
            key: app.kubernetes.io/name
            from: pod
      pod_association:
        - sources:
            - from: resource_attribute
              name: k8s.pod.uid

    # Stamps every log with cluster name and env so multi-cluster queries work.
    resource:
      attributes:
        - key: k8s.cluster.name
          value: prod-us-east-1
          action: upsert
        - key: env
          value: production
          action: upsert

    # Maps the severity_text string set by transform/flatten to its numeric form
    # so the filter below can do range comparisons.
    transform/severity:
      error_mode: ignore
      log_statements:
        - context: log
          statements:
            - set(severity_number, SEVERITY_NUMBER_DEBUG) where severity_text == "DEBUG"
            - set(severity_number, SEVERITY_NUMBER_INFO) where severity_text == "INFO"
            - set(severity_number, SEVERITY_NUMBER_WARN) where severity_text == "WARN" or severity_text == "WARNING"
            - set(severity_number, SEVERITY_NUMBER_ERROR) where severity_text == "ERROR"

    # Drops DEBUG-and-below in production. The severity_number > 0 guard keeps
    # records that never got a parseable level (most plain-text app logs).
    filter/severity:
      error_mode: ignore
      logs:
        log_record:
          - 'severity_number > 0 and severity_number < SEVERITY_NUMBER_INFO and resource.attributes["env"] == "production"'

    # Basic PII scrubber. Add patterns for tokens, card numbers, and anything else compliance asks for.
    transform/redact:
      error_mode: ignore
      log_statements:
        - context: log
          statements:
            - replace_pattern(body, "[A-Za-z0-9._%+-]+@[A-Za-z0-9.-]+\\.[A-Za-z]{2,}", "<email>")

    # Batch before export. Without batching every record is a separate HTTP call to the backend.
    batch:
      send_batch_size: 8192
      timeout: 5s

  exporters:
    # Ships to OpenObserve over OTLP/HTTP. stream-name header routes to the k8s_logs stream.
    otlphttp/openobserve:
      endpoint: https://api.openobserve.ai/api/<org_id>
      headers:
        Authorization: Basic <base64(user:token)>
        stream-name: k8s_logs
      compression: gzip

  service:
    pipelines:
      logs:
        receivers: [otlp]
        # Order matters: flatten must run before k8sattributes (which needs k8s.pod.uid),
        # and severity processors must run before filter/severity (which reads severity_number).
        processors:
          - memory_limiter
          - transform/flatten
          - k8sattributes
          - resource
          - transform/severity
          - filter/severity
          - transform/redact
          - batch
        exporters: [otlphttp/openobserve]

# Guardrails so the gateway does not starve other workloads on the node.
resources:
  requests:
    cpu: 200m
    memory: 400Mi
  limits:
    cpu: 1
    memory: 2Gi

# Pod count tracks ingest volume. Tune the target after watching a week of real traffic.
autoscaling:
  enabled: true
  minReplicas: 3
  maxReplicas: 10
  targetCPUUtilizationPercentage: 70
Things worth flagging:
memory_limiteris the first processor and is non-negotiable. The Collector will OOM under load without it, and an OOM cycle drops logs. This is the single most common reason a gateway fails in production.transform/flattenis the bridge between Fluent Bit and the rest of the pipeline. Fluent Bit's OpenTelemetry output bundles the entire record (kubernetes metadata, stream, time, message) into the OTLPLogRecord.bodyas a map. This processor lifts the kubernetes fields to resource attributes withk8s.*names, parses the JSON message body if applicable to extractseverity_text, and replaces the body map with the actual log line. Skip this and every downstream processor and query has to know about Fluent Bit's nested layout.k8sattributesruns afterflattenbecause it needsk8s.pod.uidon the resource (set byflatten) to associate records with pods. It then adds the deployment name and pod labels.resourceinjectsk8s.cluster.name. This is what makes multi-cluster queries possible.transform/severitymapsseverity_texttoseverity_number. Theseverity_textitself comes from the JSON parse intransform/flatten. For apps that emit a plain text log line with no level, severity stays unset and the next processor lets them through.filter/severitydrops debug-level logs in production. Theseverity_number > 0guard skips records where severity was never set, so logs without a parseable level still flow through. For more on this strategy see filter logs at source.transform/redactis a basic email scrubber. Add patterns for tokens, credit cards, and anything else your compliance team cares about.- The exporter uses
otlphttpagainst the OpenObserve/api/<org_id>endpoint. Thestream-nameheader decides which stream the logs land in.
Replace <org_id> and the Authorization header with values from your OpenObserve org settings. If you are running OpenObserve self-hosted, point endpoint at your ingester URL.
Roll it out and watch the queue depth:
kubectl -n logging port-forward svc/otel-collector 8888:8888
curl -s localhost:8888/metrics | grep -E "otelcol_(receiver|exporter|processor)_"
Querying logs in OpenObserve
Once your pipeline is healthy - whether installed via the openobserve-collector chart or hand-assembled in the two sections above - logs appear in the k8s_logs stream within a few seconds. The OpenObserve UI gives you full-text search by default, but the more useful workflow at scale is SQL.
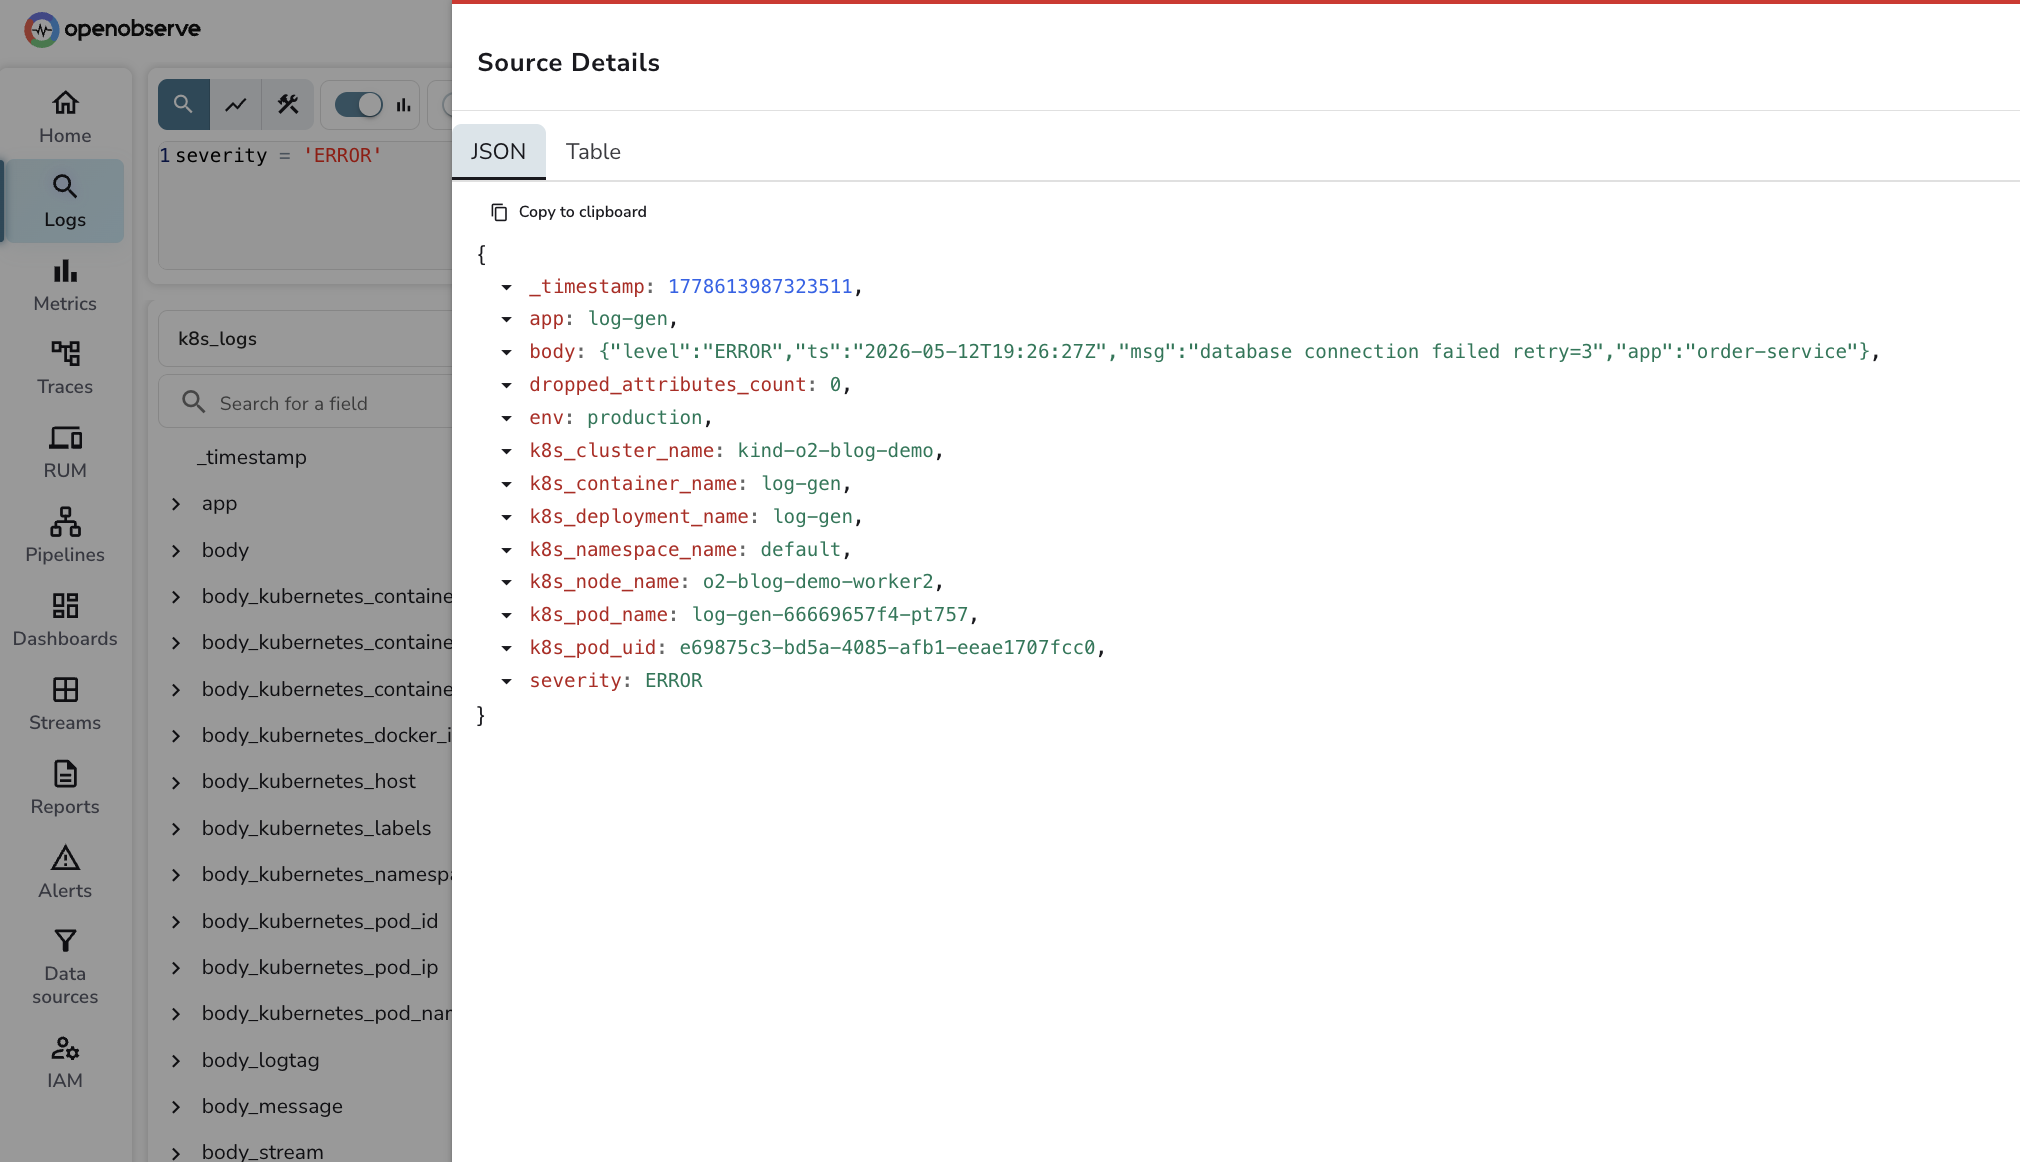
A few queries that earn their keep. Two notes on syntax: set the time range in the OpenObserve UI dropdown - it passes the range to the query engine as a parameter, so you do not need a WHERE _timestamp clause in your SQL. And OpenObserve stores the OTLP severity_text field in a column simply named severity, so query with severity = 'ERROR'.
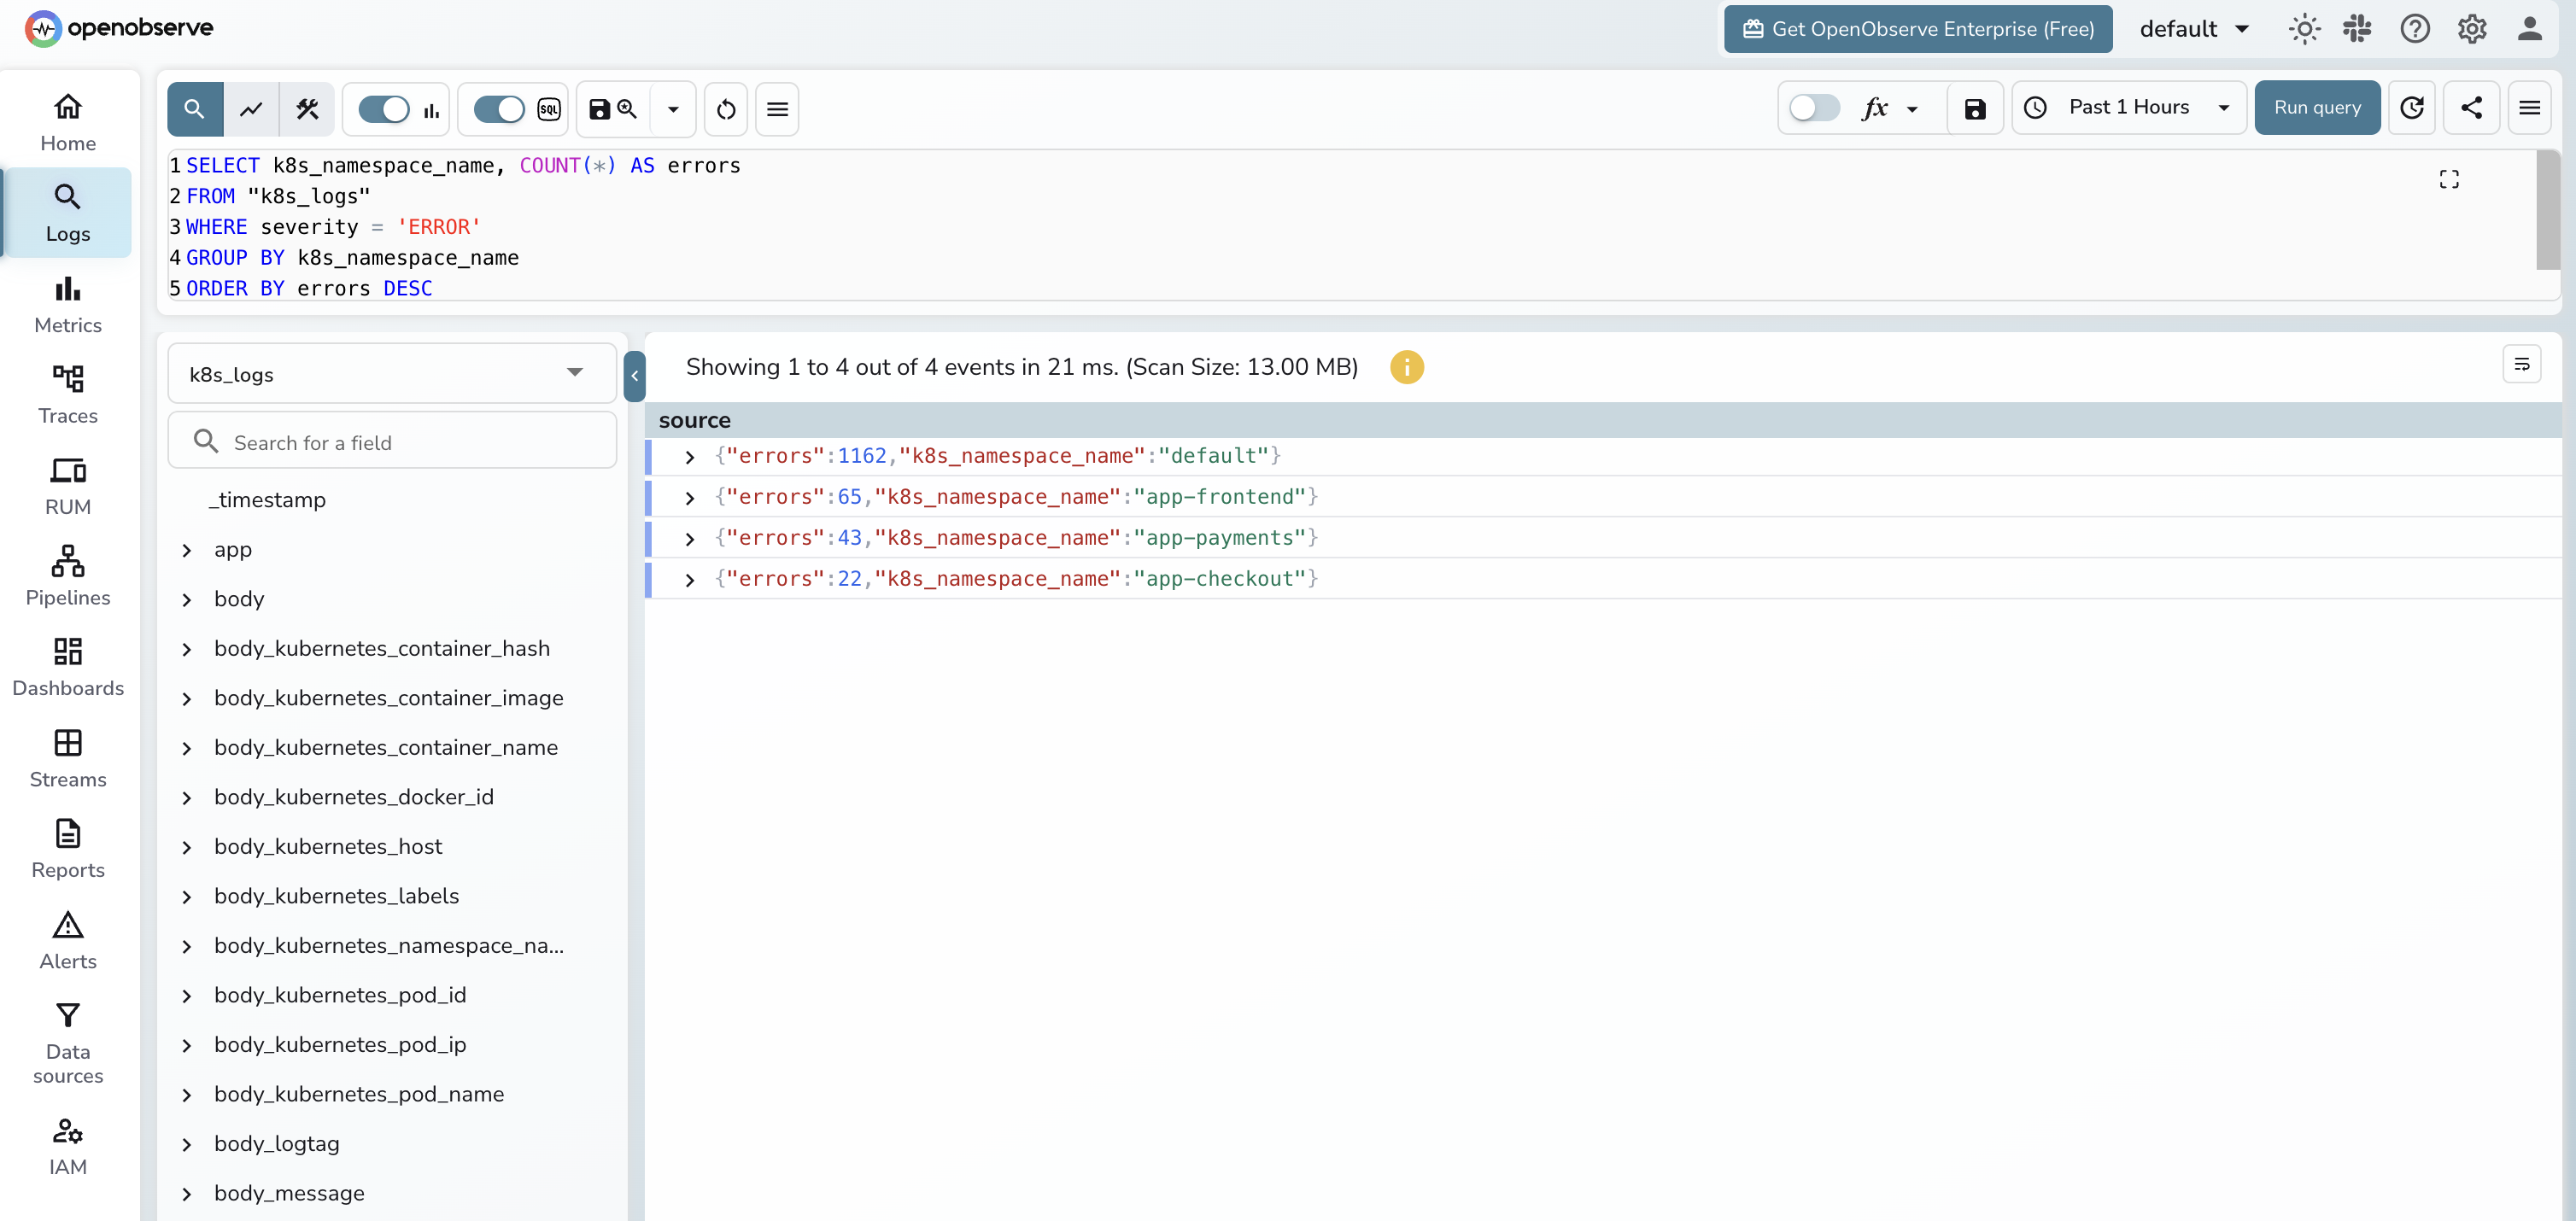
Errors per namespace:
SELECT k8s_namespace_name, COUNT(*) AS errors
FROM "k8s_logs"
WHERE severity = 'ERROR'
GROUP BY k8s_namespace_name
ORDER BY errors DESC
LIMIT 20;
Top noisy pods by log volume:
SELECT k8s_pod_name, COUNT(*) AS lines, SUM(LENGTH(body)) AS bytes
FROM "k8s_logs"
GROUP BY k8s_pod_name
ORDER BY bytes DESC
LIMIT 20;
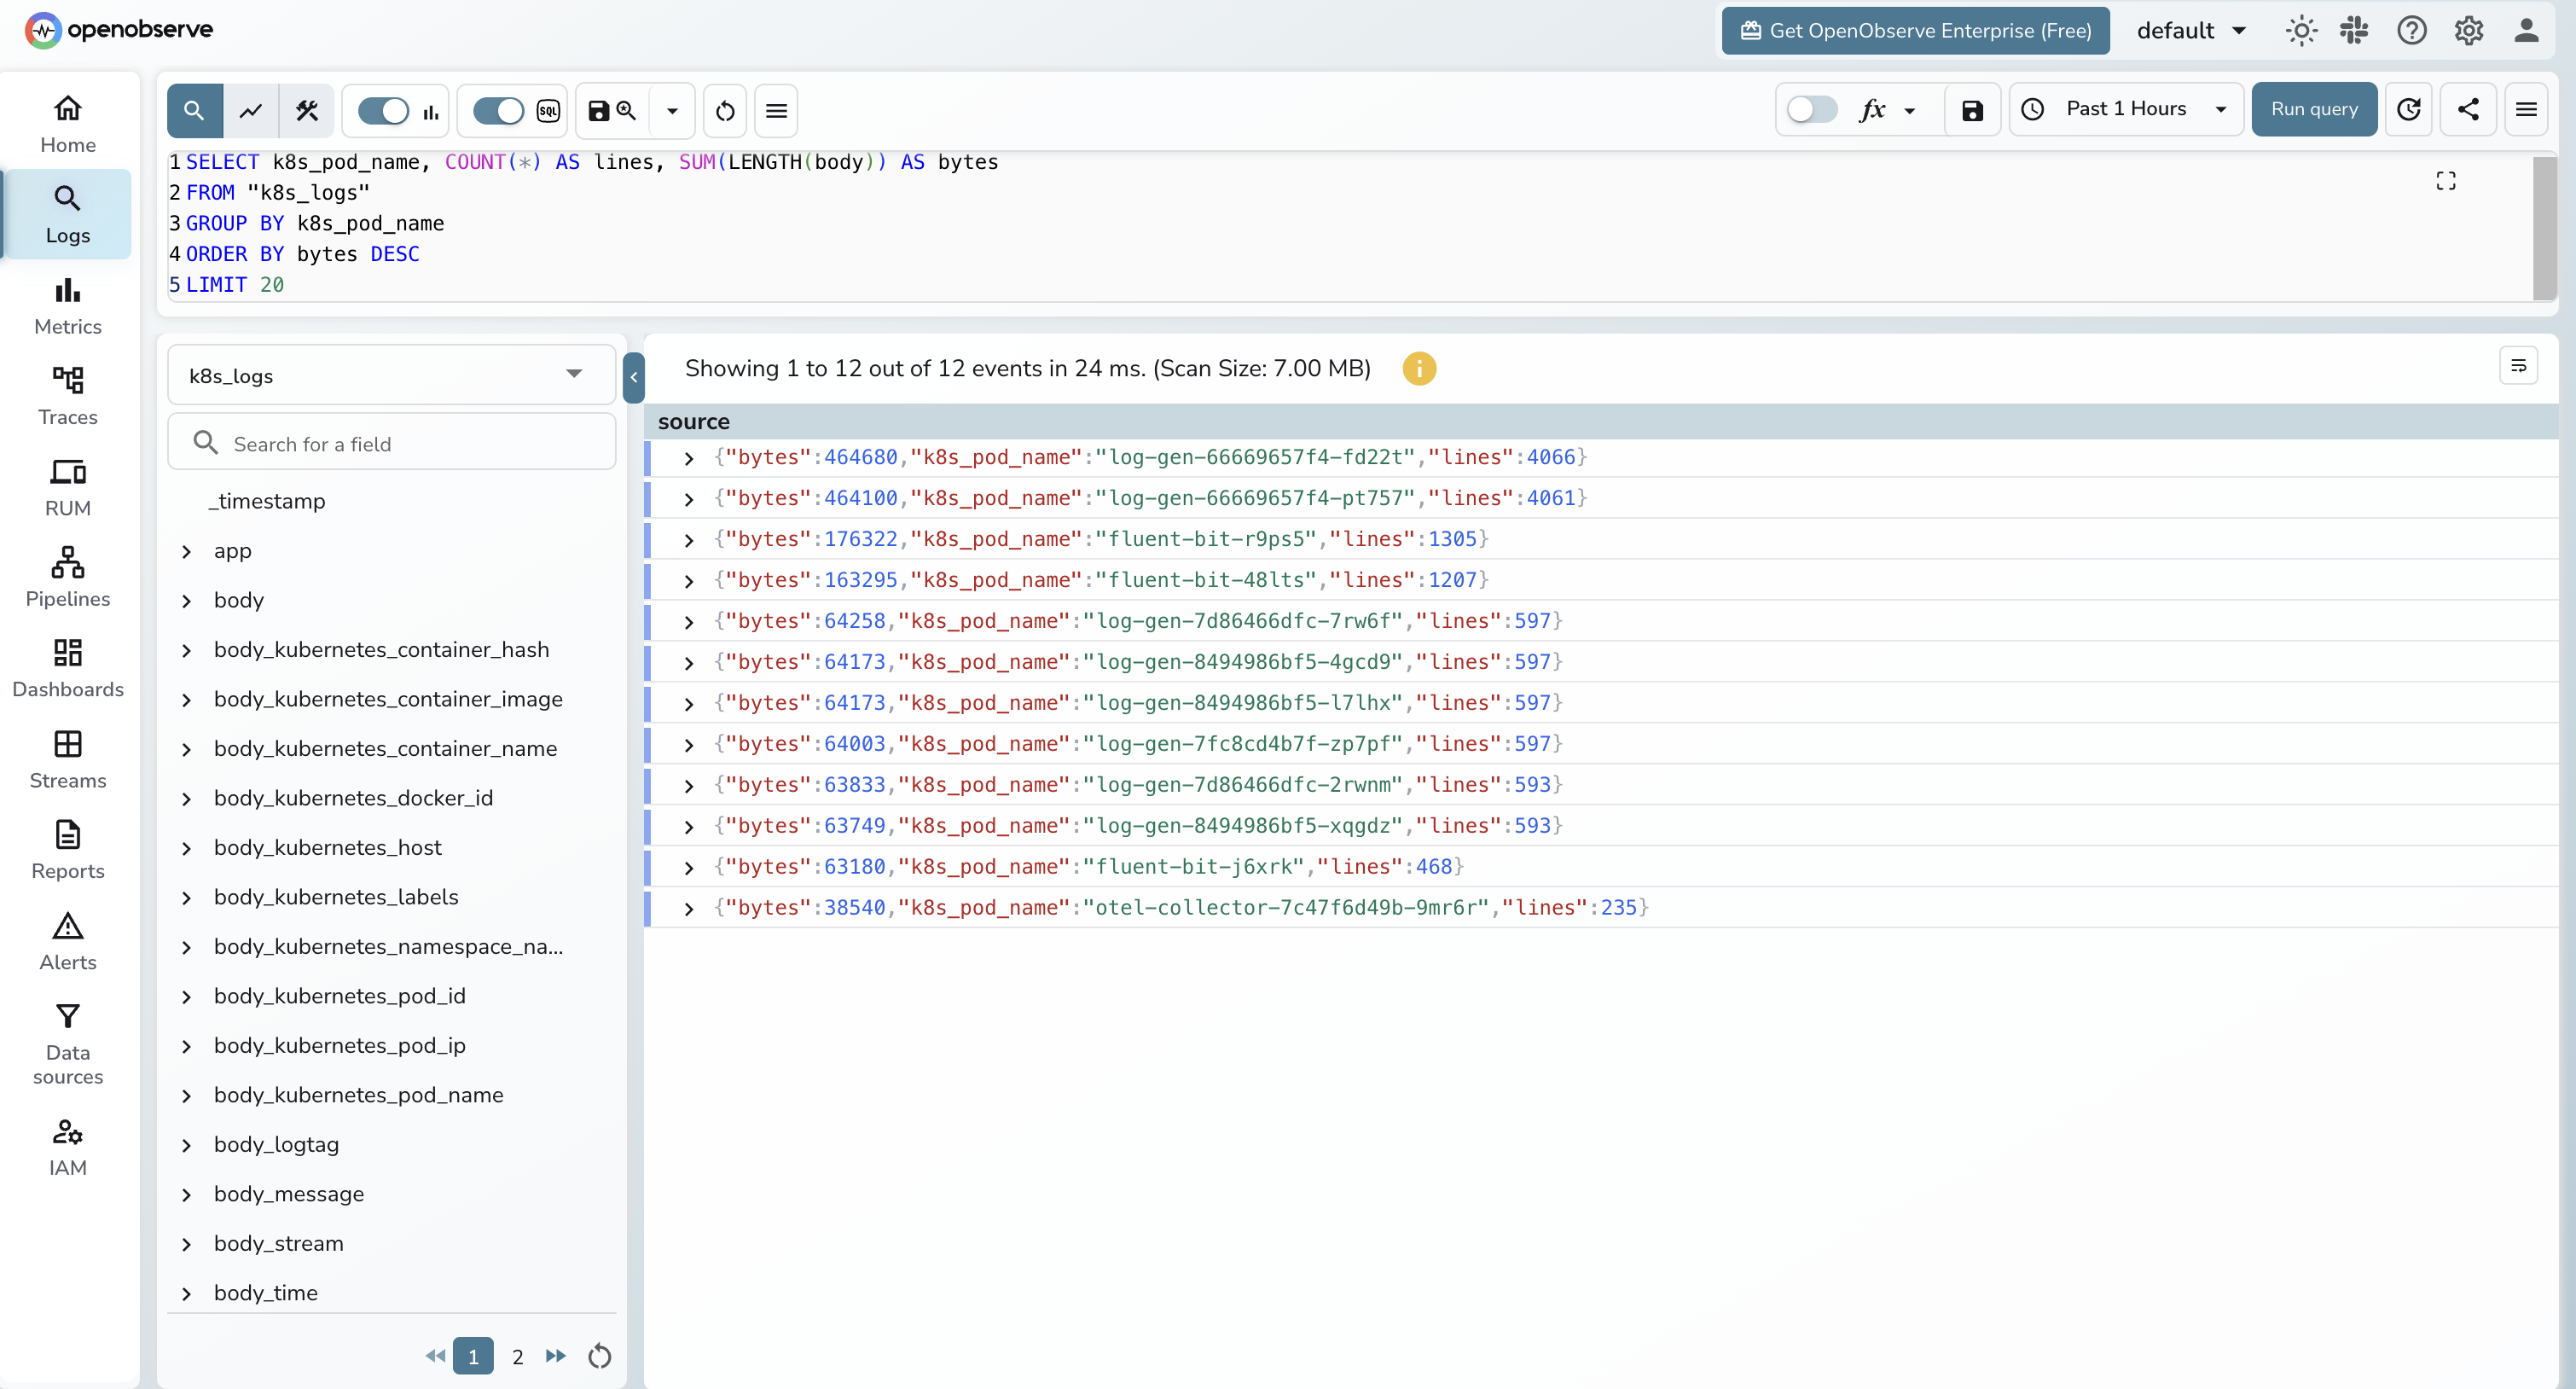
The "top noisy pods" query is the one that pays for itself. Run it weekly. Whatever pod is at the top is almost always logging something it should not be, and dropping it at the Fluent Bit layer is a measurable cost win.
Multi-cluster aggregation
You have two reasonable patterns.
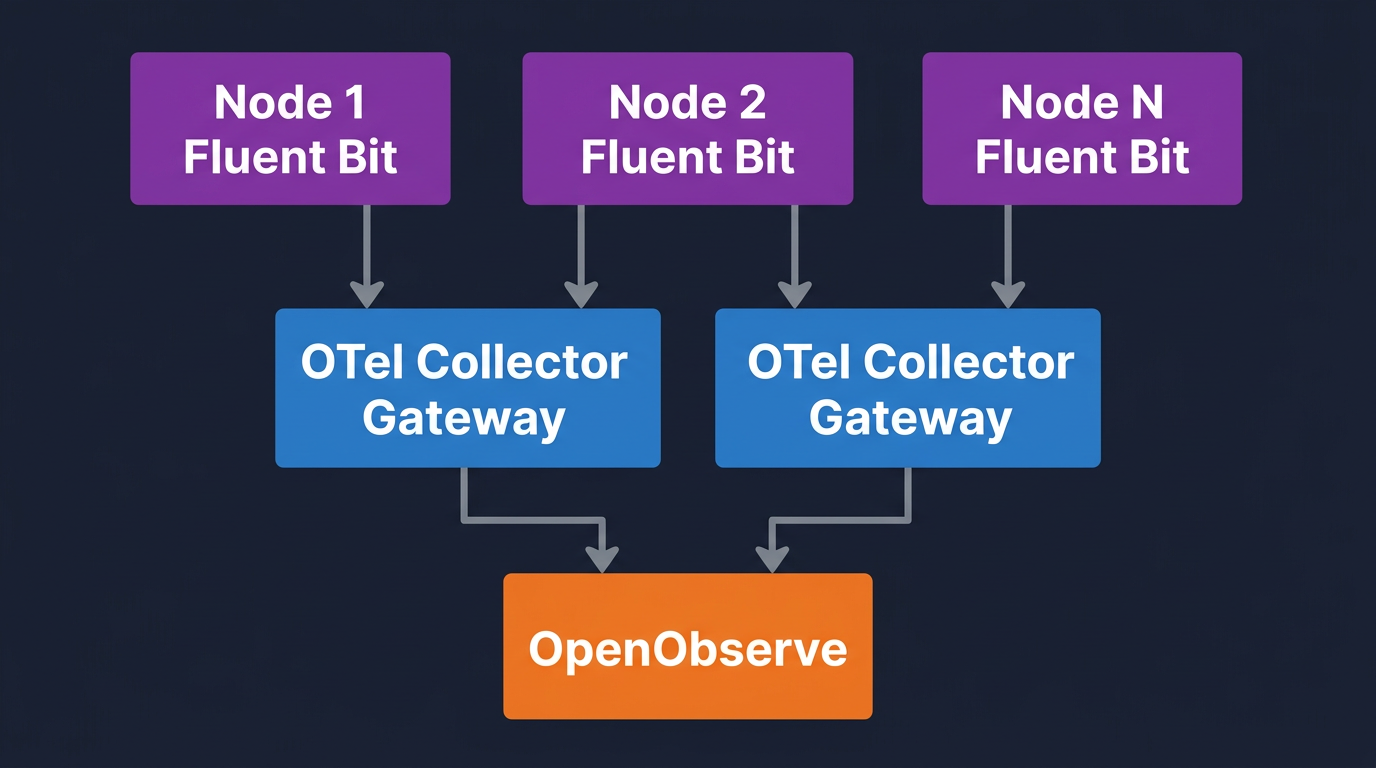
Per-cluster gateway, central backend. Each cluster runs its own Fluent Bit DaemonSet and OTel Collector gateway. Each gateway sets its own k8s.cluster.name and exports to a single OpenObserve endpoint. This is the default recommendation.
- Pros: failure isolation per cluster, gateway lives next to the workloads it serves, traffic to the backend is one TLS connection per gateway.
- Cons: more Helm releases to manage. Use a config repo and a tool like Argo CD or Flux.
Central gateway, edge collectors. Each cluster runs only Fluent Bit. A single regional OTel Collector gateway sits in a hub cluster and receives OTLP from all of them. The hub gateway enriches, redacts, and forwards.
- Pros: fewer gateway instances to operate.
- Cons: every node's Fluent Bit needs cross-cluster network reach. Gateway outage takes down logging for everyone. Use this only if you have a service mesh or strong inter-cluster networking.
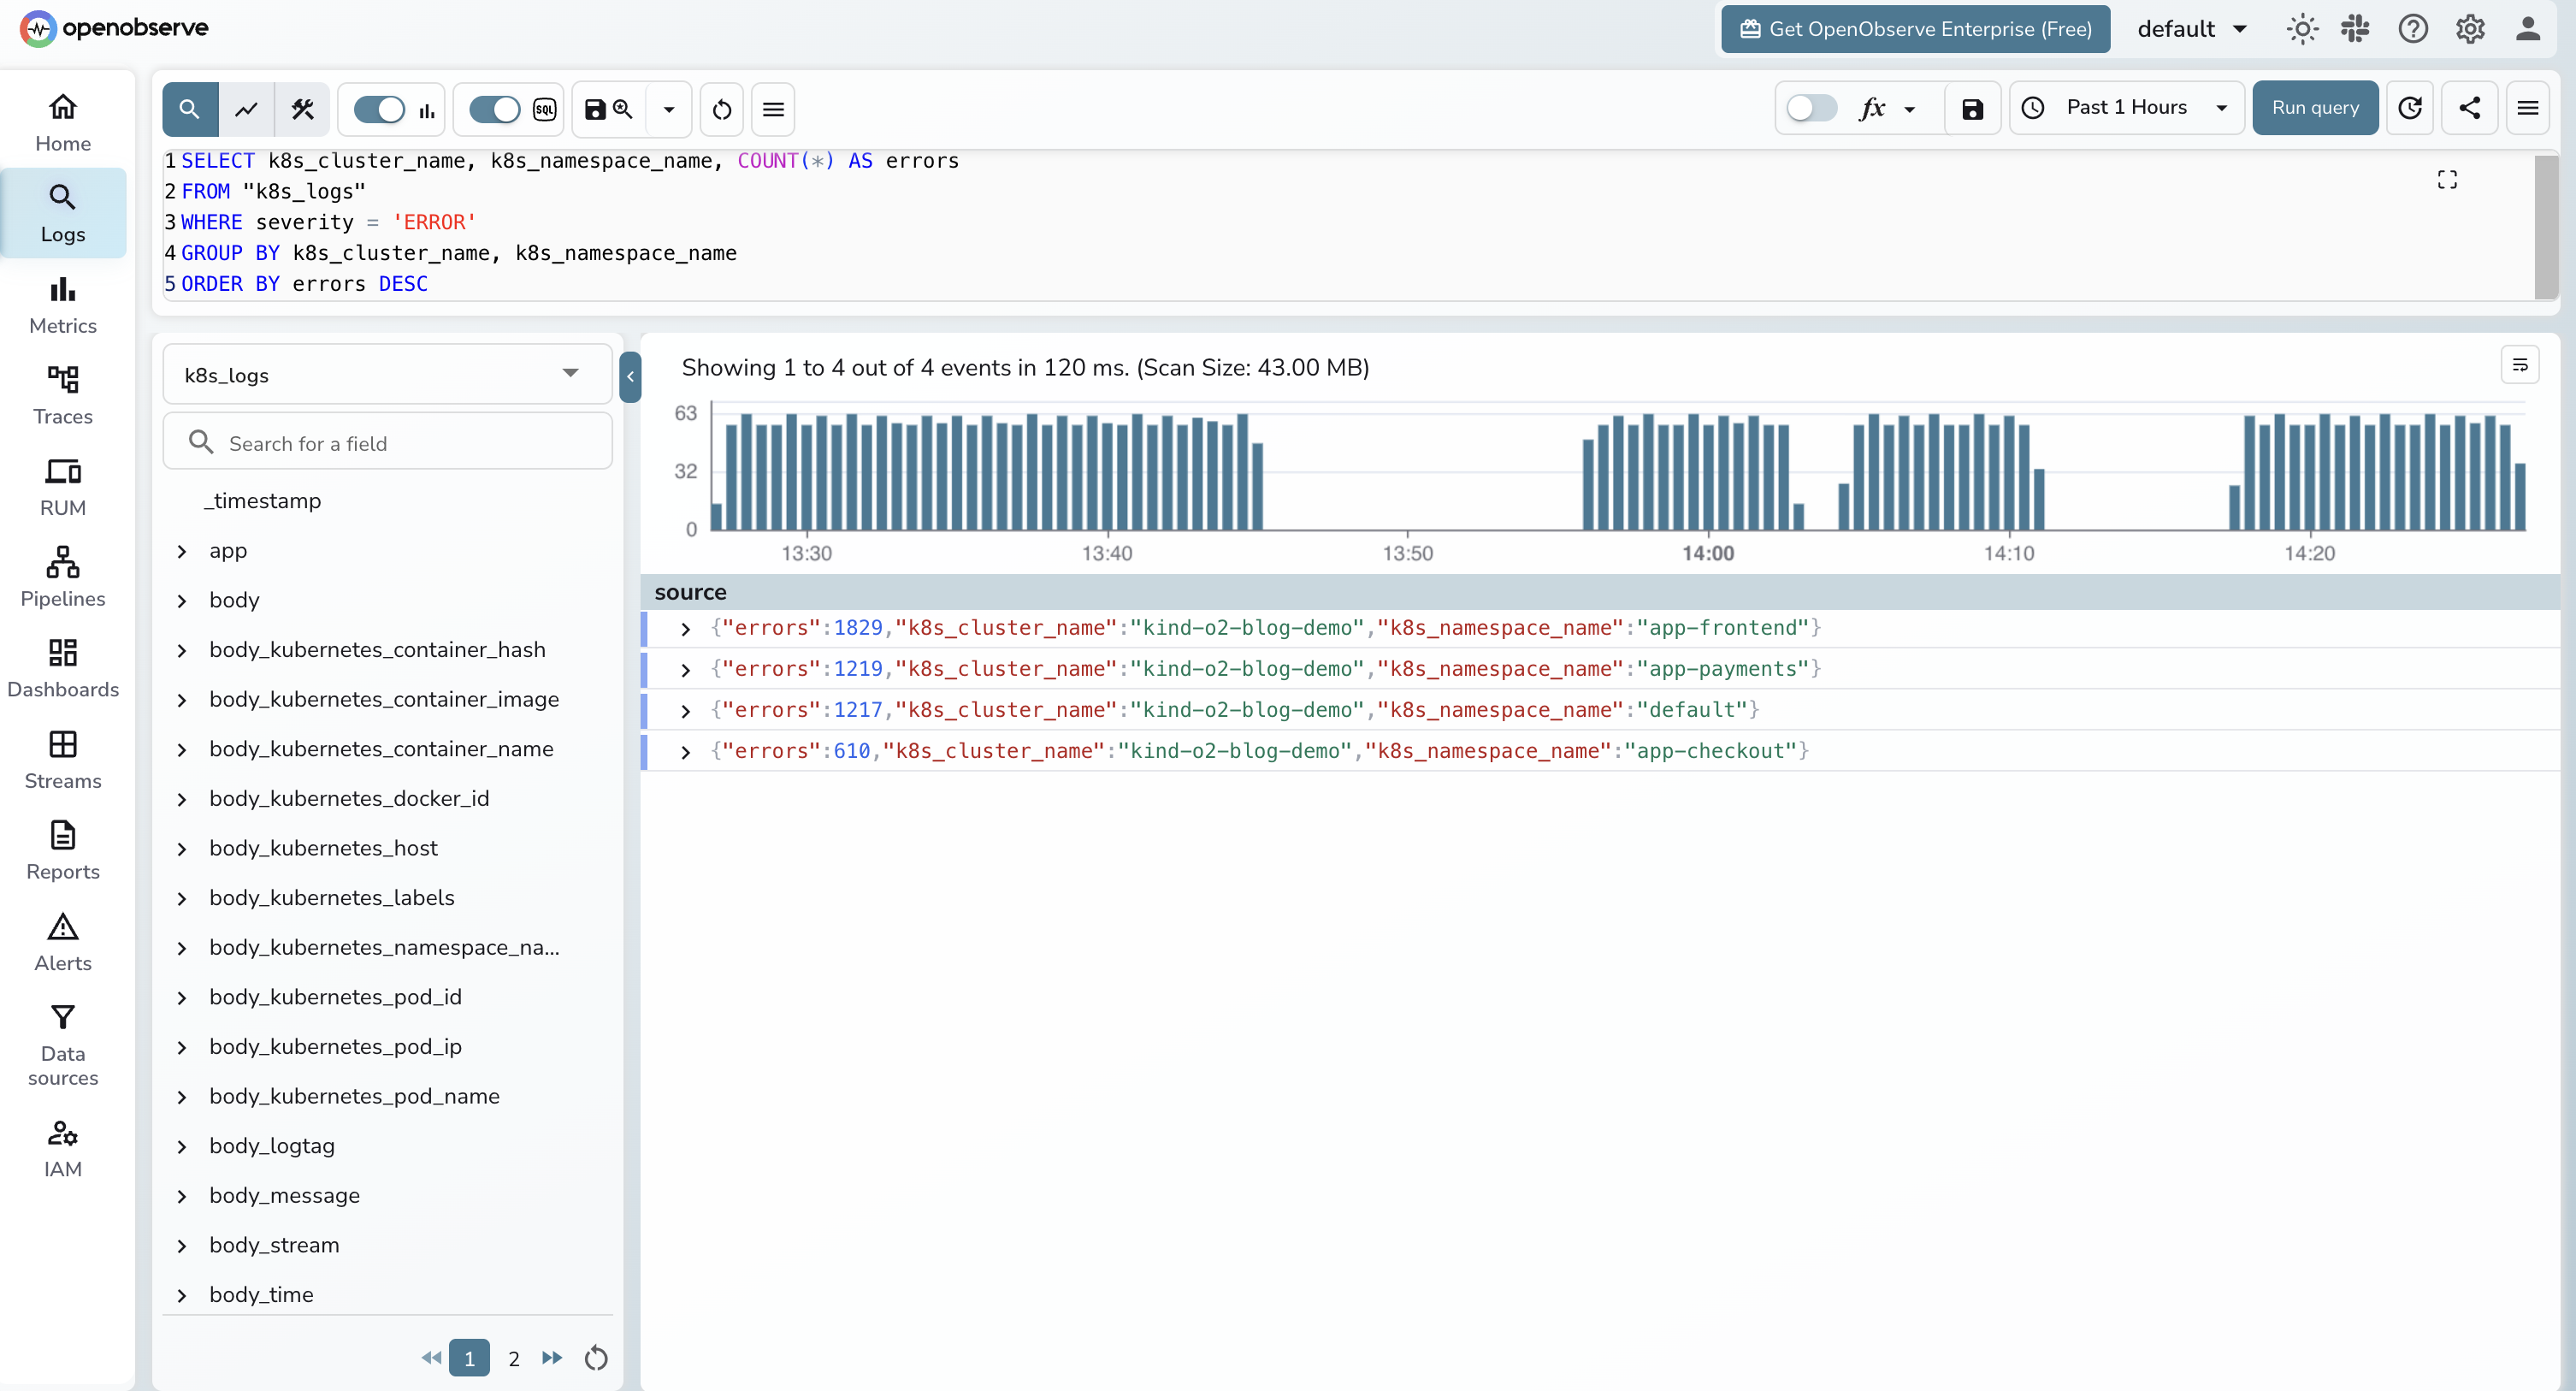
For either pattern, the cluster label is the only thing that matters for queries:
SELECT k8s_cluster_name, k8s_namespace_name, COUNT(*) AS errors
FROM "k8s_logs"
WHERE severity = 'ERROR'
GROUP BY k8s_cluster_name, k8s_namespace_name
ORDER BY errors DESC;
If you want a broader view of the toolchain at this layer, the top 10 K8s monitoring tools post covers what else fits next to this pipeline.
Filtering, sampling, and dropping noise
Filter at the earliest layer where you have the right context.
At Fluent Bit (cheapest). Drop by namespace, container, or message regex. The two grep filters in the values file above are the starting point. Add more for known noisy paths:
[FILTER]
    Name    grep
    Match   kube.*
    Exclude message ^.*\"(GET|HEAD) /(healthz|readyz|metrics).*$
At the OTel Collector (richer context). Drop by severity after enrichment, or by enriched attributes like k8s.deployment.name. The filter processor uses OTTL, which is more expressive than Fluent Bit's regex filters but costs CPU.
filter/drop_debug_in_prod:
  error_mode: ignore
  logs:
    log_record:
      - "severity_number > 0 and severity_number < SEVERITY_NUMBER_INFO"
      - 'resource.attributes["k8s.deployment.name"] == "noisy-batch-job"'
Sampling. For high-volume INFO logs that you do not want to drop entirely, sample with the probabilistic_sampler processor. Keep all WARN and above, sample INFO at 10 to 25 percent.
Measure egress bytes before and after each filter you add. The "top noisy pods" query above is the simplest way to find what to drop next. The OpenTelemetry cost reduction post goes deeper on the bill side of this.
Retention and storage cost
This is where backend choice matters. The math:
- 200 nodes × 5 GB per node per day = 1 TB per day raw
- After filtering at 40 percent reduction = 600 GB per day stored
- After gzip compression at 8x (typical for structured logs per log compression benchmarks) = 75 GB per day on disk
- 365 days = ~27 TB per year
On an indexed store like Elasticsearch or OpenSearch, that 27 TB lives on hot storage with replication. You pay for compute to keep it queryable, and the cost is roughly linear with retention. On an object-store-native backend like OpenObserve, that 27 TB sits compressed on object storage (S3, GCS, Azure Blob, or MinIO) and the query layer reads it on demand. Cold-data cost on object storage is dramatically lower per GB than on indexed compute, which is why long retention windows are affordable.
The right pattern for most teams is tiered:
| Tier | Duration | Storage | Query latency | Who uses it |
|---|---|---|---|---|
| Hot | 7 days | Full-text indexed | Fastest | On-call during an active incident |
| Warm | 30 days | Object storage, searchable | Slightly slower | Post-incident reviews and trend digs |
| Cold | 12+ months | Object storage, archived | Slow but queryable | Compliance, audit, year-over-year analysis |
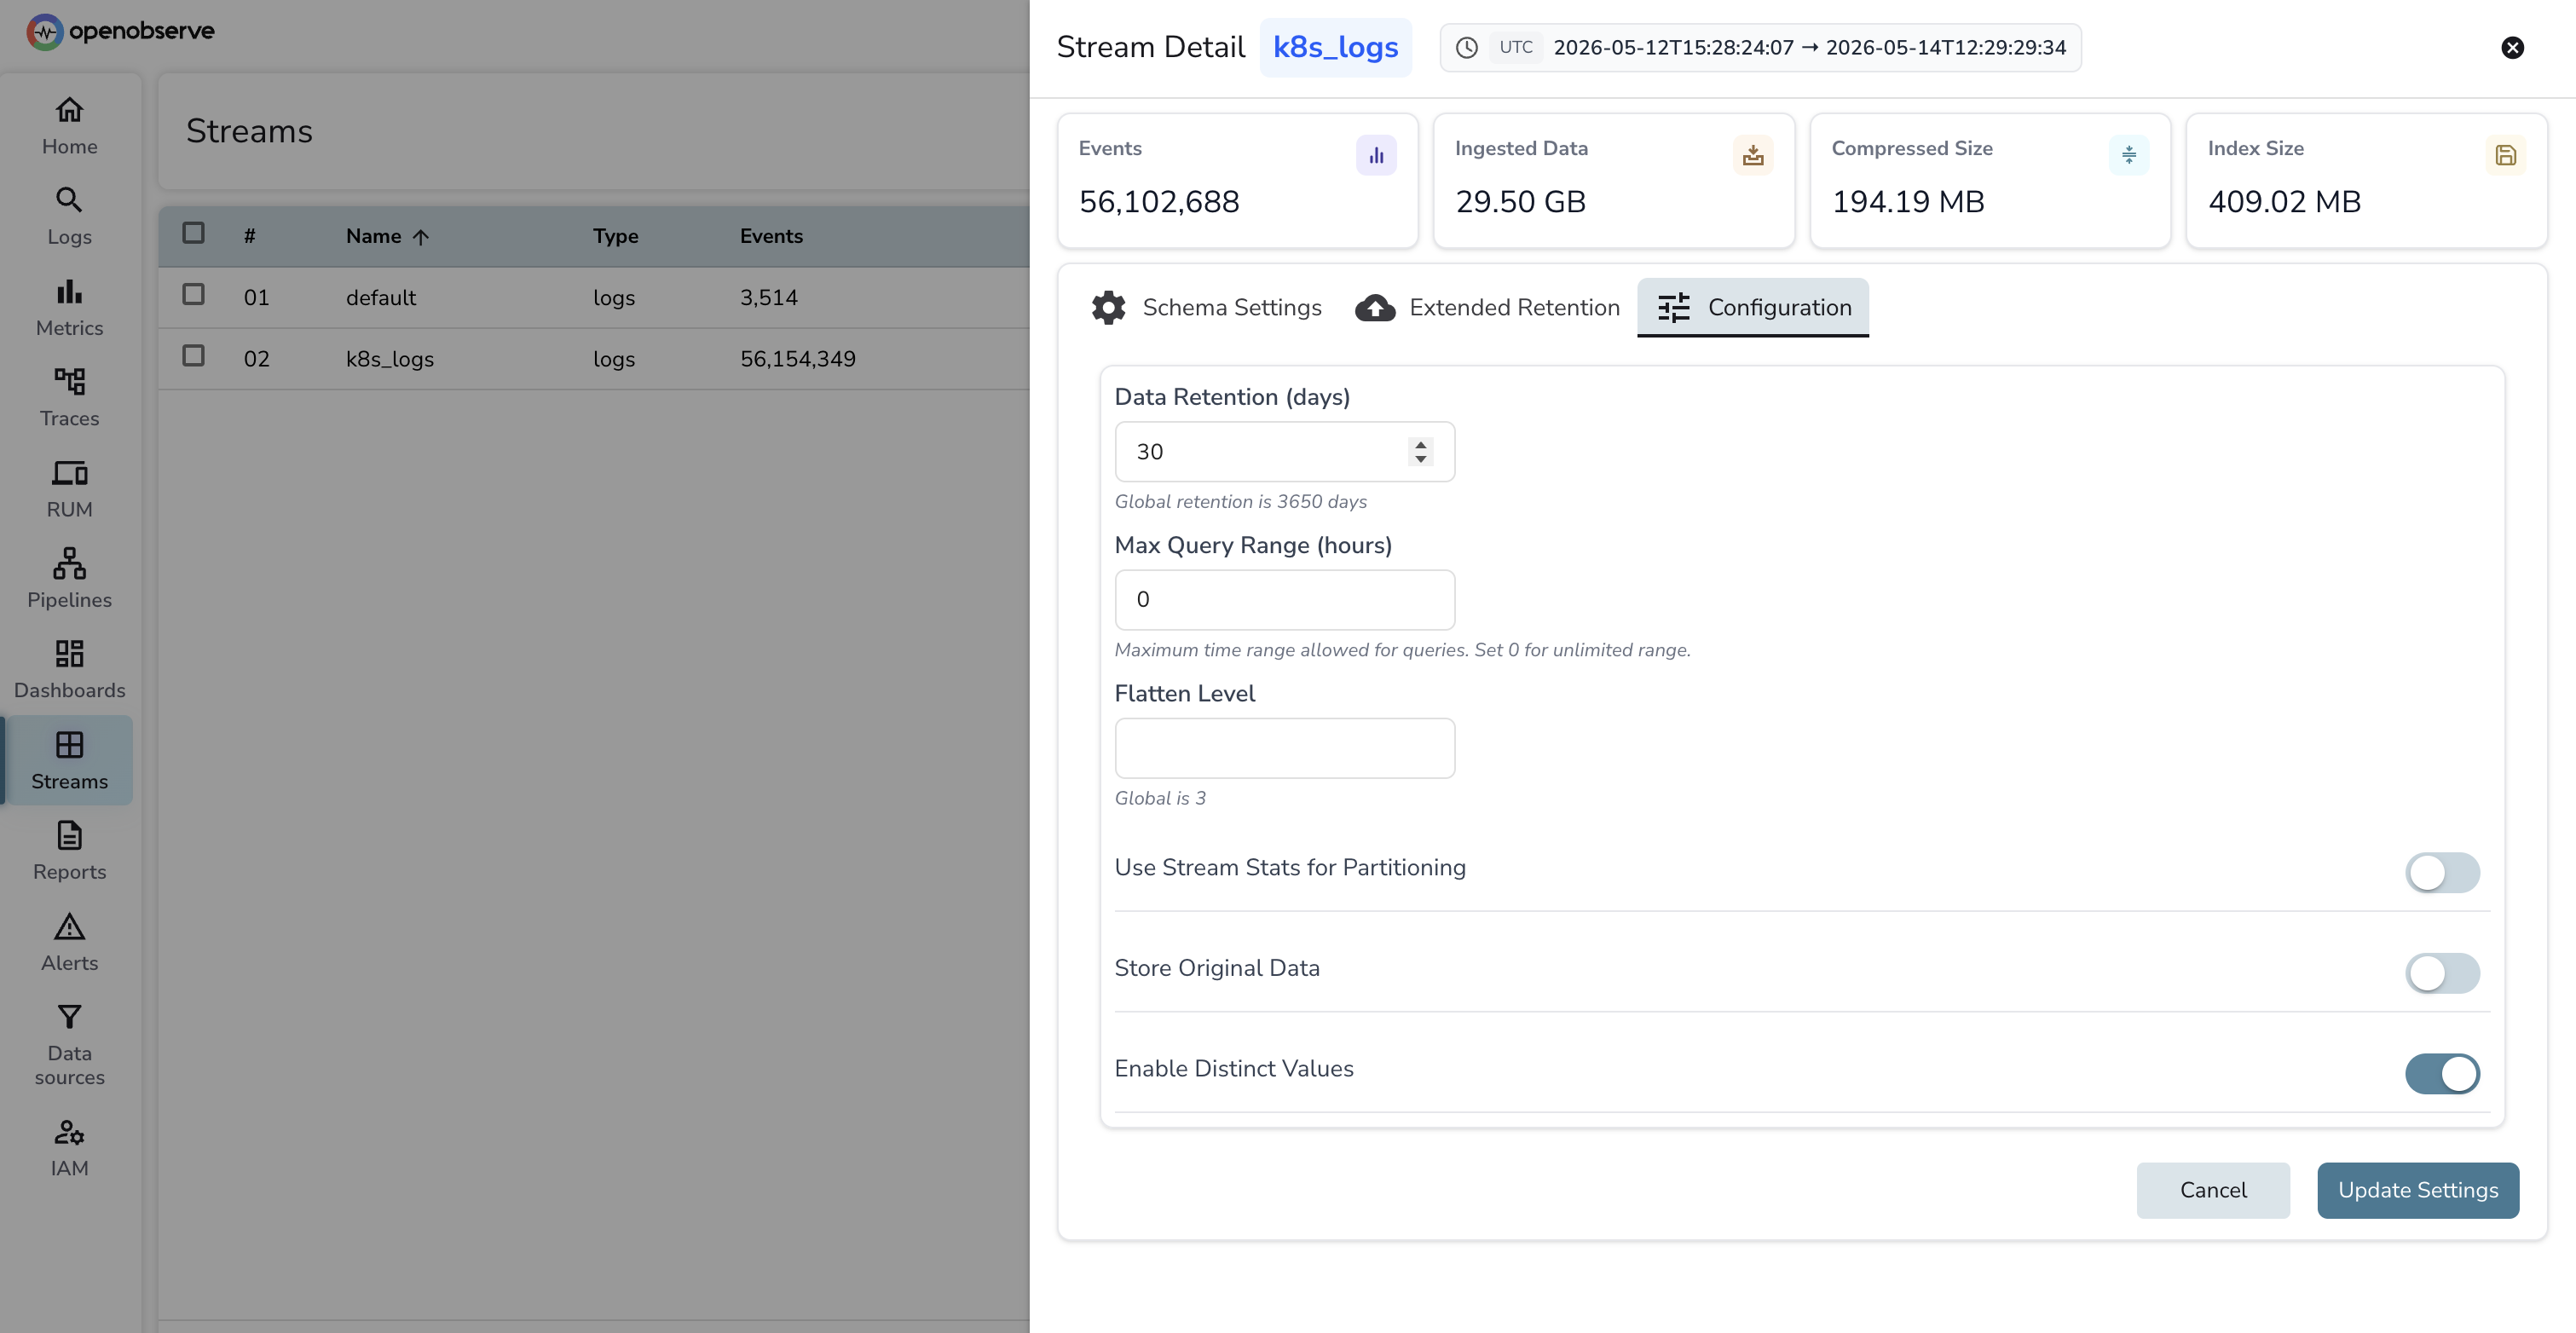
OpenObserve's storage model collapses warm and cold into the same tier (object storage) and lets you set per-stream retention. Set k8s_logs retention to 30 days for the searchable window and run a separate k8s_logs_archive stream with 13-month retention for compliance. The retention field lives on each stream's settings panel in the UI:
A health dashboard for the pipeline itself
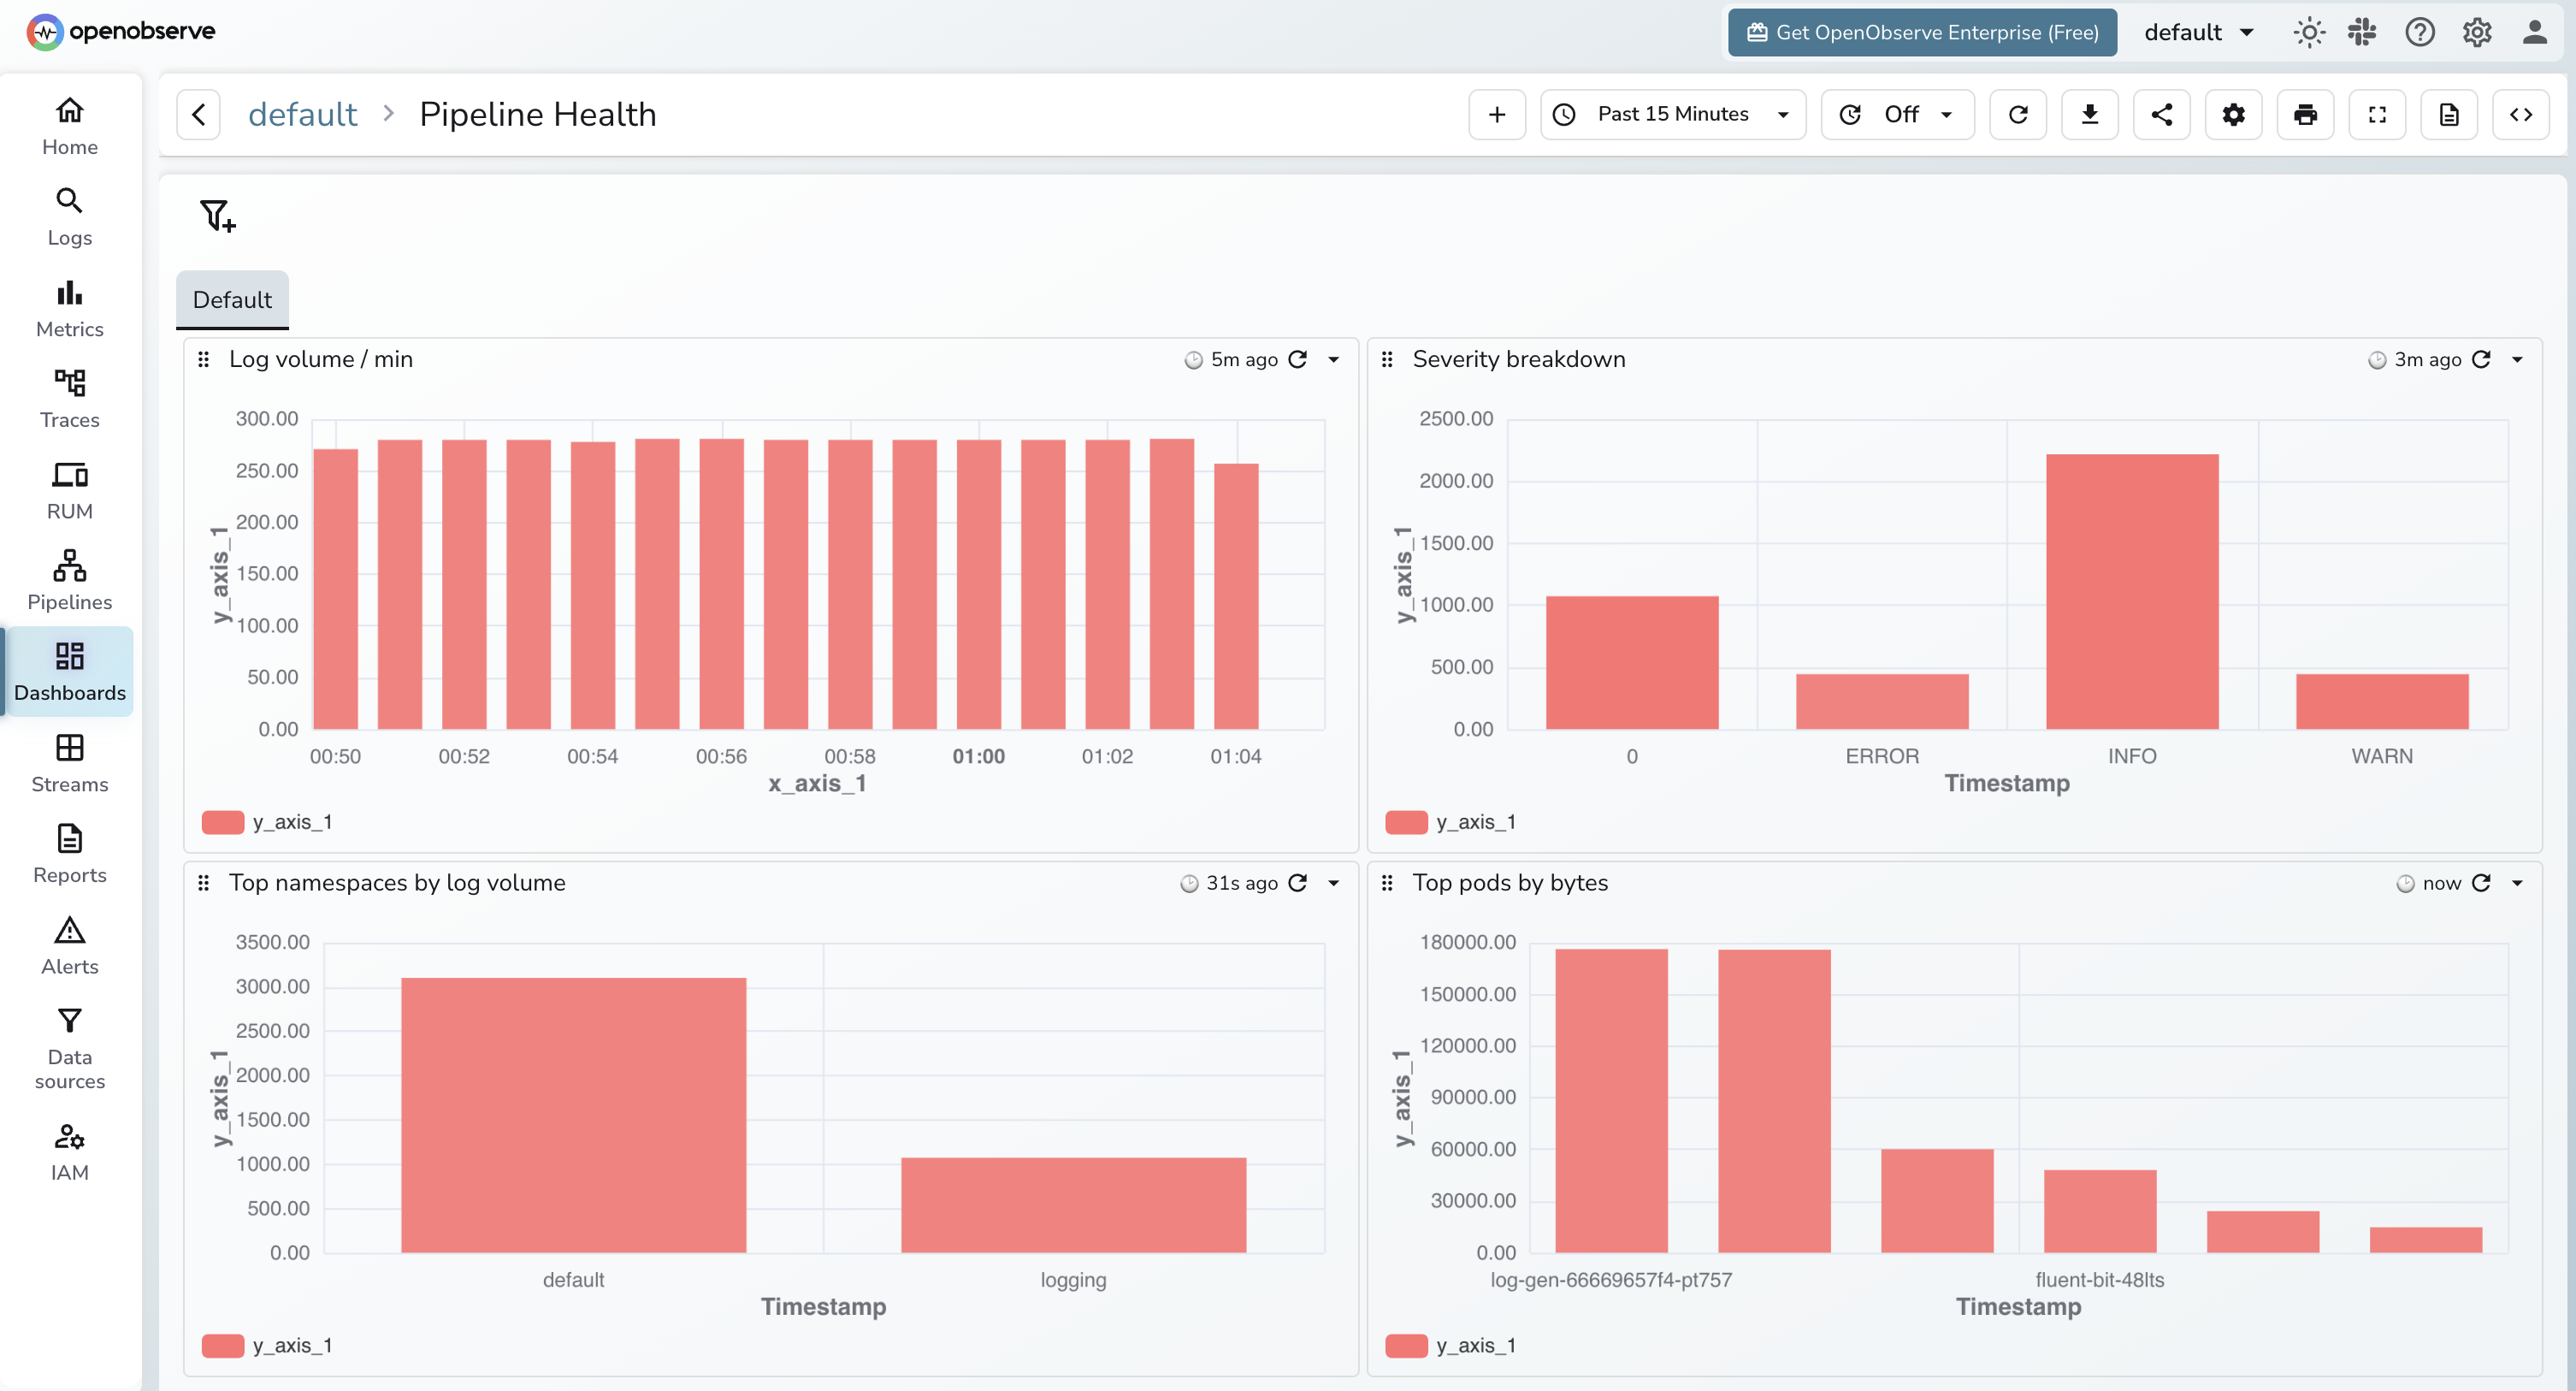
Logs about the logging pipeline are the logs you cannot afford to lose. Wire up four panels.
Dropped records. Fluent Bit exposes fluentbit_output_dropped_records_total on its :2020/api/v1/metrics/prometheus endpoint. The OTel Collector exposes otelcol_processor_dropped_log_records_total. Both should be flat at zero.
Queue depth. Fluent Bit's chunk queue and the OTel Collector's otelcol_exporter_queue_size gauge. Climbing queue depth means the backend is slower than ingest. Page on this before it overflows.
Export errors. otelcol_exporter_send_failed_log_records_total and Fluent Bit's fluentbit_output_errors_total. Any non-zero rate is a backend reachability or auth issue. These should fire as alerts, not just dashboard panels.
Ingestion lag. Time between log timestamp and ingestion timestamp at the backend. Compute this in OpenObserve as _timestamp - <log timestamp field>. Healthy is sub-10-second. Sustained lag past 60 seconds means you are under-provisioned somewhere.
If you are also collecting metrics with kube-prometheus-stack, the Kubernetes metrics with OTel and Prometheus post pairs naturally with this dashboard.
Try it on OpenObserve Cloud
Both pipelines above run against any OpenObserve endpoint, self-hosted or cloud. If you do not want to operate the backend yourself, OpenObserve Cloud gives you a managed org with S3-backed storage, free-tier usage, and the same OTLP ingestion endpoints used in this guide. Drop the endpoint and the base64 auth header into your helm install --set flags (chart path) or the values files above (custom path) and you are ingesting in under five minutes.
Frequently Asked Questions
About the Author
Gorakhnath Yadav


Gorakhnath is a passionate developer advocate, working on bridging the gap between developers and the tools they use. He focuses on building communities and creating content that empowers developers to build better software.
Follow OpenObserve on Google
Add OpenObserve as a preferred source to see more of our articles in Google Search and Top Stories.













