Monitor Your RabbitMQ Metrics with OpenTelemetry and OpenObserve




Ready to get started?
Try OpenObserve Cloud today for more efficient and performant observability.
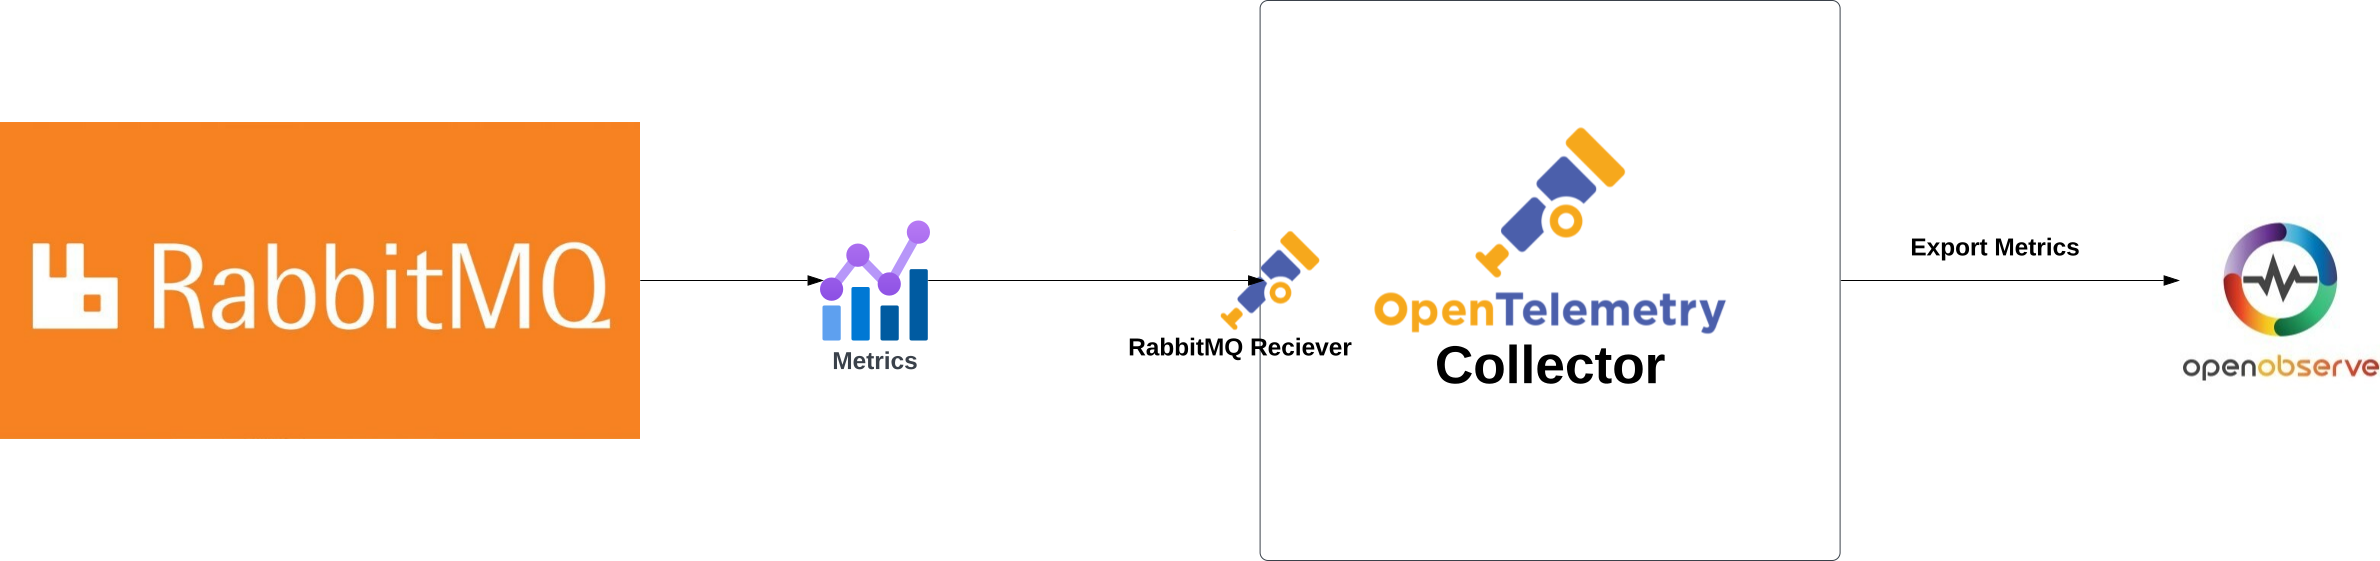
Are you looking to enhance your RabbitMQ monitoring strategy and ensure optimal message broker performance? In this comprehensive guide, we'll walk you through setting up advanced monitoring for RabbitMQ using OpenTelemetry and OpenObserve. Whether you're managing a small deployment or a large-scale messaging infrastructure, understanding your RabbitMQ metrics is crucial for maintaining reliable message delivery and system performance. By leveraging the RabbitMQ receiver of the OpenTelemetry Collector, you'll learn how to collect essential metrics, build informative dashboards, and set up alerts that keep your messaging system running smoothly.
A Brief Overview of RabbitMQ
RabbitMQ is a powerful open-source message broker that implements the Advanced Message Queuing Protocol (AMQP). As a robust messaging solution, it acts as an intermediary for messaging, enabling applications to communicate and exchange data asynchronously. With features like message queuing, routing, reliable delivery, and clustering, RabbitMQ has become the backbone of modern distributed systems, powering microservices architectures, event-driven systems, and real-time data processing pipelines.
Monitoring RabbitMQ performance is essential for maintaining a healthy messaging ecosystem. In distributed systems where message brokers handle critical communication between services, any issues with message processing, queue backlogs, or consumer health can quickly escalate into system-wide failures. Effective RabbitMQ monitoring provides deep visibility into message flow patterns, queue performance, and consumer behavior, allowing teams to proactively identify bottlenecks, optimize resource utilization, and ensure reliable message delivery. By tracking key metrics like queue health, consumer count, and message flow, organizations can maintain optimal performance, scale resources efficiently, and prevent message-related incidents before they impact business operations.
How Do We Monitor RabbitMQ Metrics?
To effectively monitor RabbitMQ, we utilize the OpenTelemetry Collector with its dedicated RabbitMQ receiver. This integration allows us to collect comprehensive metrics from RabbitMQ instances and forward them to OpenObserve for visualization and analysis. The RabbitMQ receiver connects to the RabbitMQ Management API, collecting detailed metrics about queues, messages, and consumers.
RabbitMQ Receiver
The RabbitMQ receiver in OpenTelemetry fetches metrics from a RabbitMQ instance using the Management Plugin API. It collects various metrics that provide insights into message flow, queue status, and consumer health. The receiver is designed to work with both standalone RabbitMQ servers and clustered deployments.
Default Metrics
The receiver provides several essential metrics out of the box:
| Metric | Description | Metric Name |
|---|---|---|
| Consumer Count | Number of consumers currently reading from queues | rabbitmq.consumer.count |
| Messages Published | Total number of messages published to queues | rabbitmq.message.published |
| Messages Delivered | Number of messages delivered to consumers | rabbitmq.message.delivered |
| Messages Dropped | Count of messages dropped as unroutable | rabbitmq.message.dropped |
| Messages Acknowledged | Number of messages acknowledged by consumers | rabbitmq.message.acknowledged |
| Messages Current | Total messages currently in queues | rabbitmq.message.current |
All these metrics are of type 'Sum' with value type 'Integer', providing cumulative measurements of RabbitMQ's operational status.
Resource Attributes
The receiver automatically attaches these resource attributes to help identify and filter metrics:
| Name | Description | Values | Enabled |
|---|---|---|---|
| rabbitmq.node.name | Name of the RabbitMQ node | Any String | true |
| rabbitmq.queue.name | Name of the RabbitMQ queue | Any String | true |
| rabbitmq.vhost.name | Name of the RabbitMQ vHost | Any String | true |
Configuration
Here's a sample configuration for the RabbitMQ receiver:
receivers:
  rabbitmq:
    endpoint: http://localhost:15672
    username: otel
    password: password123
    collection_interval: 30s
    tls:
      insecure: true
      insecure_skip_verify: true
Key configuration parameters:
- endpoint: The URL of your RabbitMQ management API (default: http://localhost:15672)
- username: RabbitMQ user with monitoring permissions
- password: Authentication password
- collection_interval: How often metrics are collected (default: 1m)
- tls: TLS/SSL configuration for secure connections
Getting Started
Prerequisites
Before we begin setting up RabbitMQ monitoring, ensure you have:
A Running RabbitMQ Instance: Make sure you have RabbitMQ installed and running. If you're using Docker, you can start RabbitMQ with:
docker run -d --name rabbitmq \
    -p 5672:5672 \
    -p 15672:15672 \
    rabbitmq:3.9-management
RabbitMQ Management Plugin: The Management plugin must be enabled for metric collection. It's included by default in the management image, but for manual installations, enable it with:
rabbitmq-plugins enable rabbitmq_managementMonitoring User: Create a user with monitoring permissions:
rabbitmqctl add_user otel password123
rabbitmqctl set_user_tags otel monitoring
rabbitmqctl set_permissions -p / otel ".*" ".*" ".*"
Note: The RabbitMQ receiver supports versions 3.8 and 3.9. Make sure your RabbitMQ instance is compatible.

Step 2: Install the OpenTelemetry Collector
We'll use the OpenTelemetry Collector Contrib distribution as it includes the RabbitMQ receiver.
- Download the latest release for your machine. For macOS, use:
curl --proto '=https' --tlsv1.2 -fOL https://github.com/open-telemetry/opentelemetry-collector-releases/releases/download/v0.115.1/otelcol-contrib_0.115.1_darwin_arm64.tar.gz
- Extract the downloaded file:
tar -xvf otelcol-contrib_0.115.1_darwin_arm64.tar.gz
- Move the binary to your PATH:
sudo mv otelcol-contrib /usr/local/bin/
- Verify the installation:
otelcol-contrib --version

Step 3: Configure the OpenTelemetry Collector
Create a configuration file named otel-collector-config.yaml with the following content:
receivers:
  rabbitmq:
    endpoint: http://localhost:15672
    username: otel
    password: password123
    collection_interval: 30s
    tls:
      insecure: true
      insecure_skip_verify: true

processors:
  batch:
    send_batch_size: 10000
    timeout: 10s

exporters:
  otlphttp/openobserve:
    endpoint: YOUR_API_ENDPOINT
    headers:
      Authorization: Basic YOUR_AUTH_TOKEN
      stream-name: default

service:
  pipelines:
    metrics:
      receivers: [rabbitmq]
      processors: [batch]
      exporters: [otlphttp/openobserve]
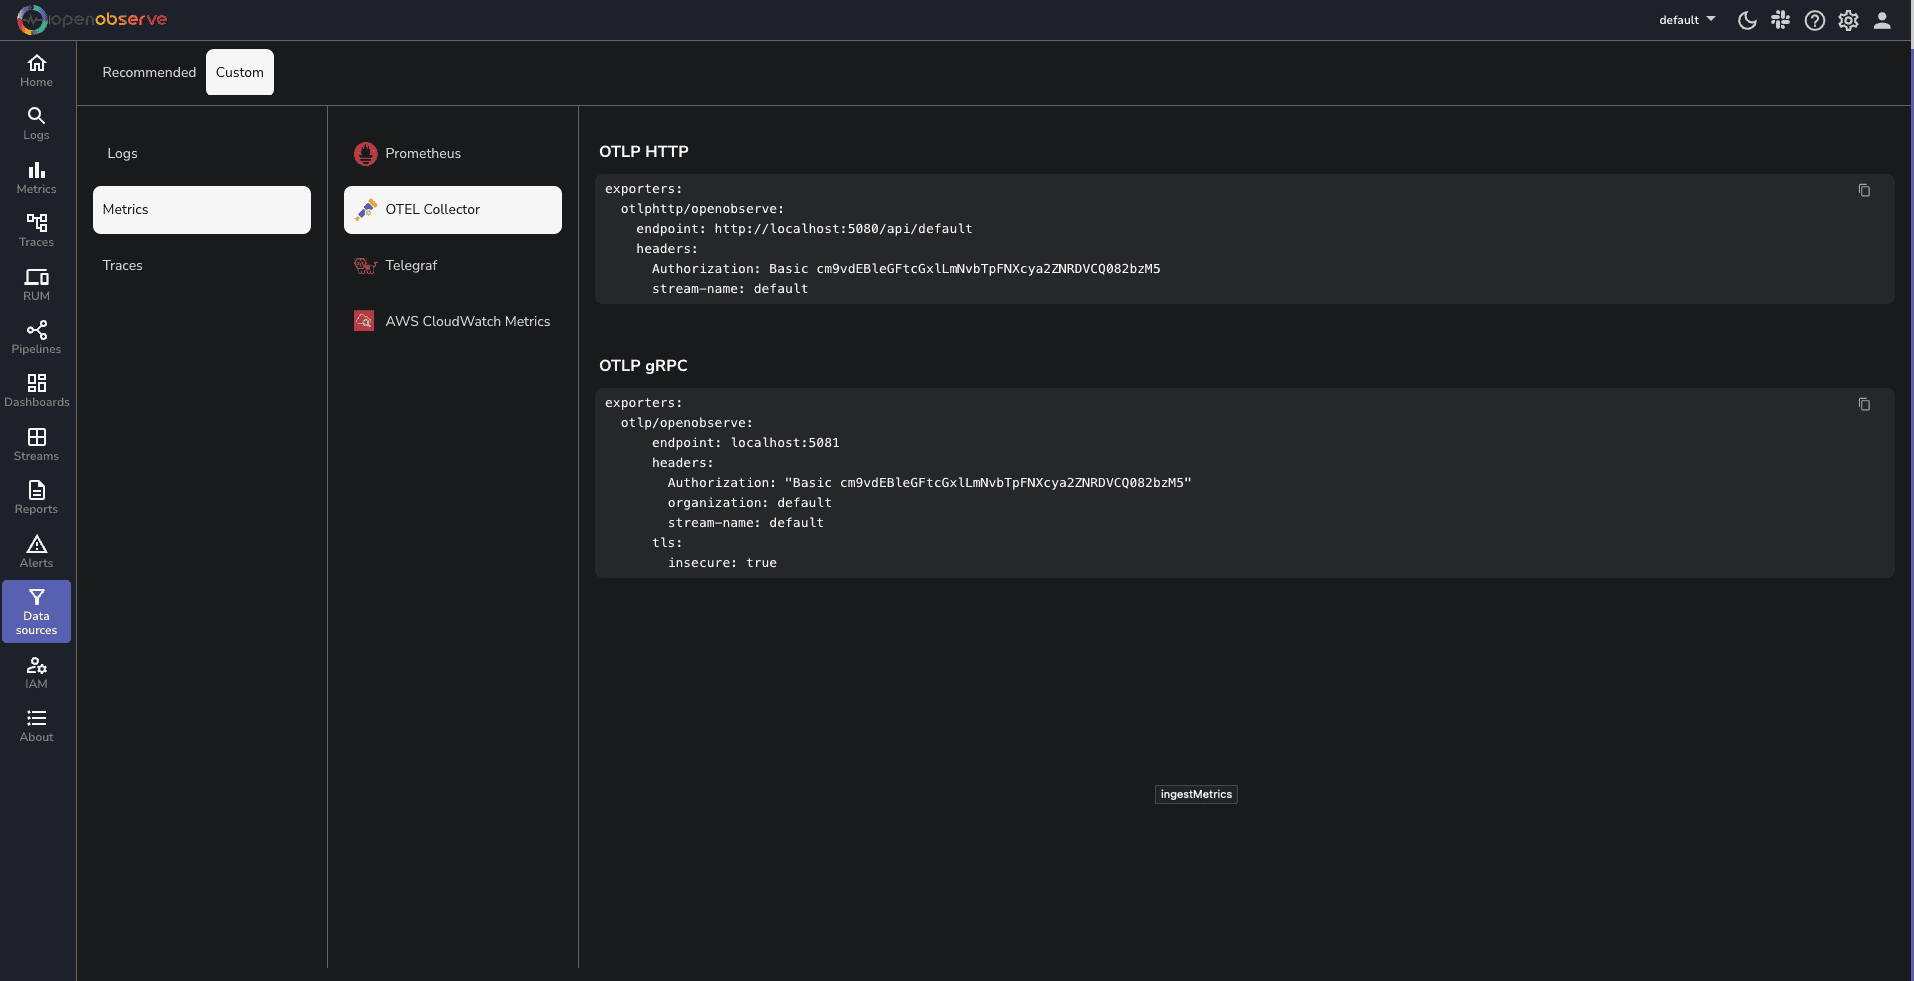
Replace YOUR_API_ENDPOINT and YOUR_AUTH_TOKEN with your OpenObserve credentials, which you can find in your OpenObserve dashboard under Data Sources -> Custom -> Metrics -> Otel Collector.
Step 4: Run the OpenTelemetry Collector
Start the OpenTelemetry Collector with your configuration:
otelcol-contrib --config otel-collector-config.yaml
You should see collector logs indicating that the collector has started successfully and is receiving metrics from RabbitMQ.
Step 5: Visualize Your Data in OpenObserve
Once metrics are flowing into OpenObserve, you can create powerful visualizations to monitor your RabbitMQ instance
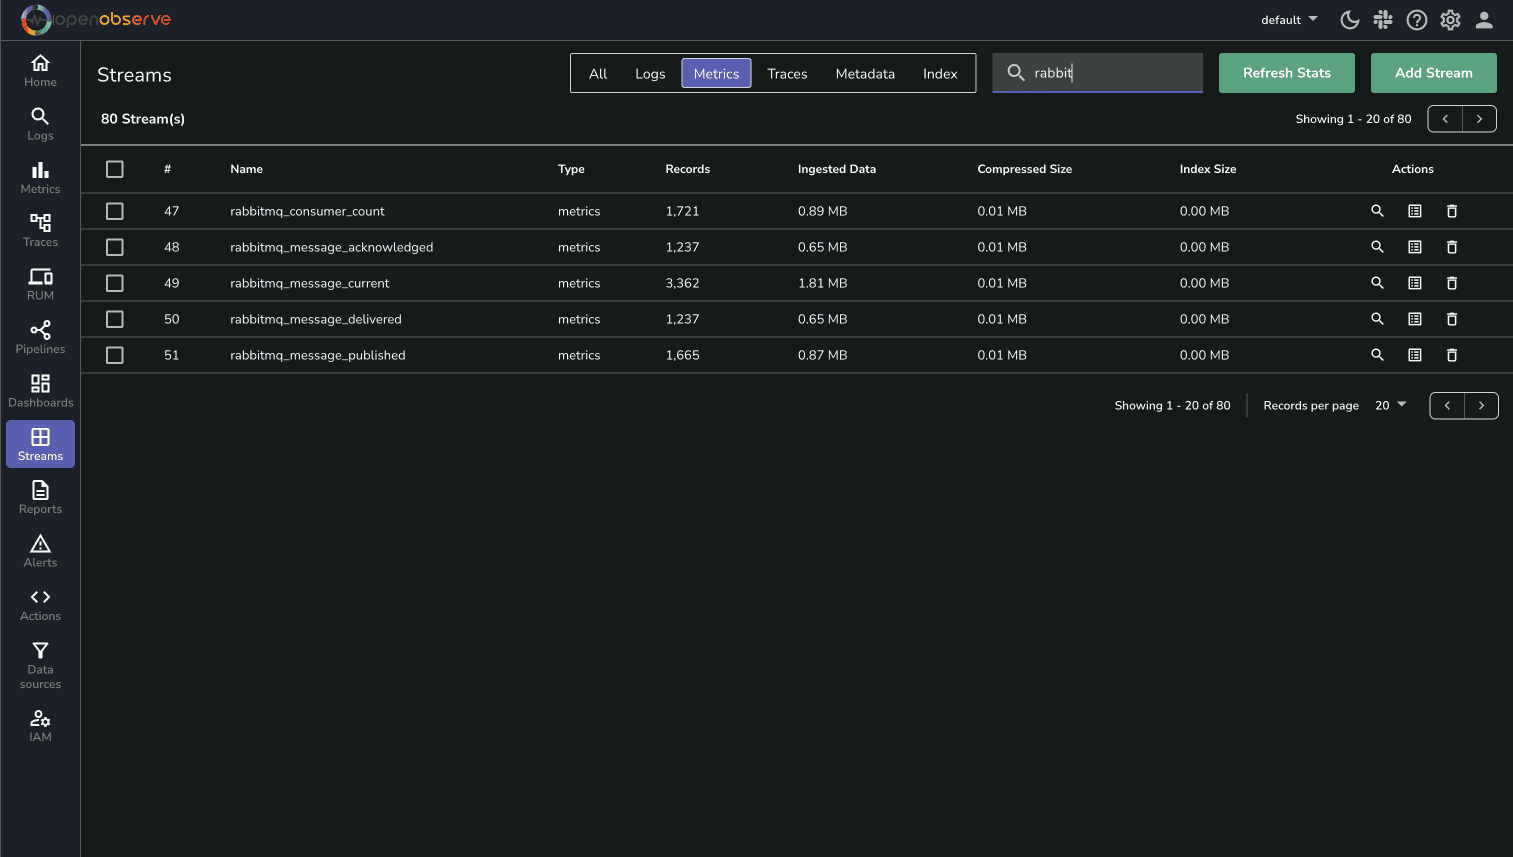
You can also access the RabbitMQ Management UI at http://localhost:15672 to view real-time queue status and resource usage for quick operational insights.
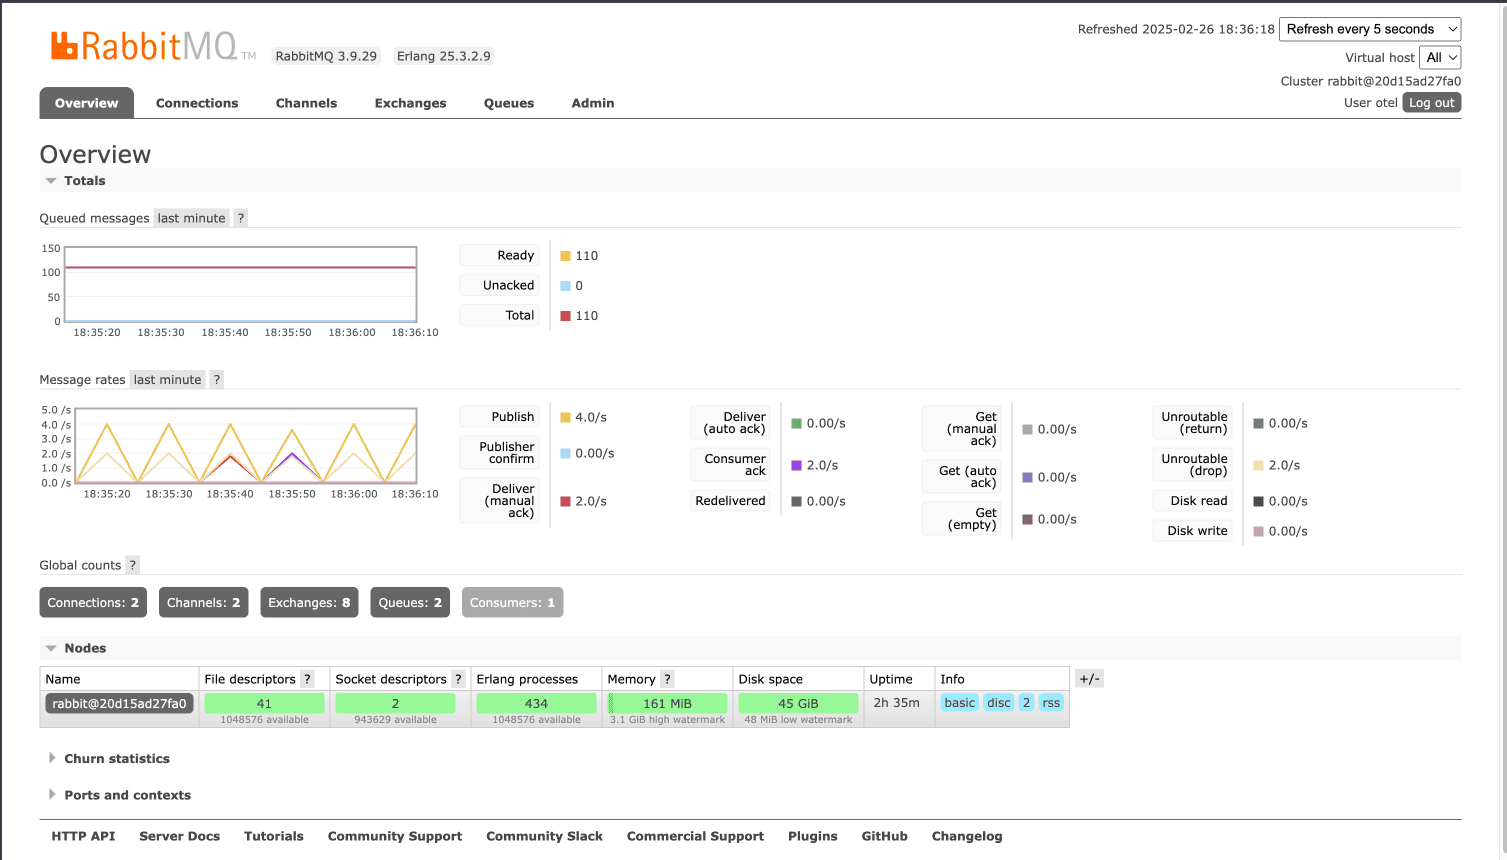
For comprehensive monitoring, we've prepared a complete RabbitMQ monitoring dashboard that includes:
- Message Flow Status
- Queue Depth Metrics
- Consumer Activity Tracking
- Processing Performance
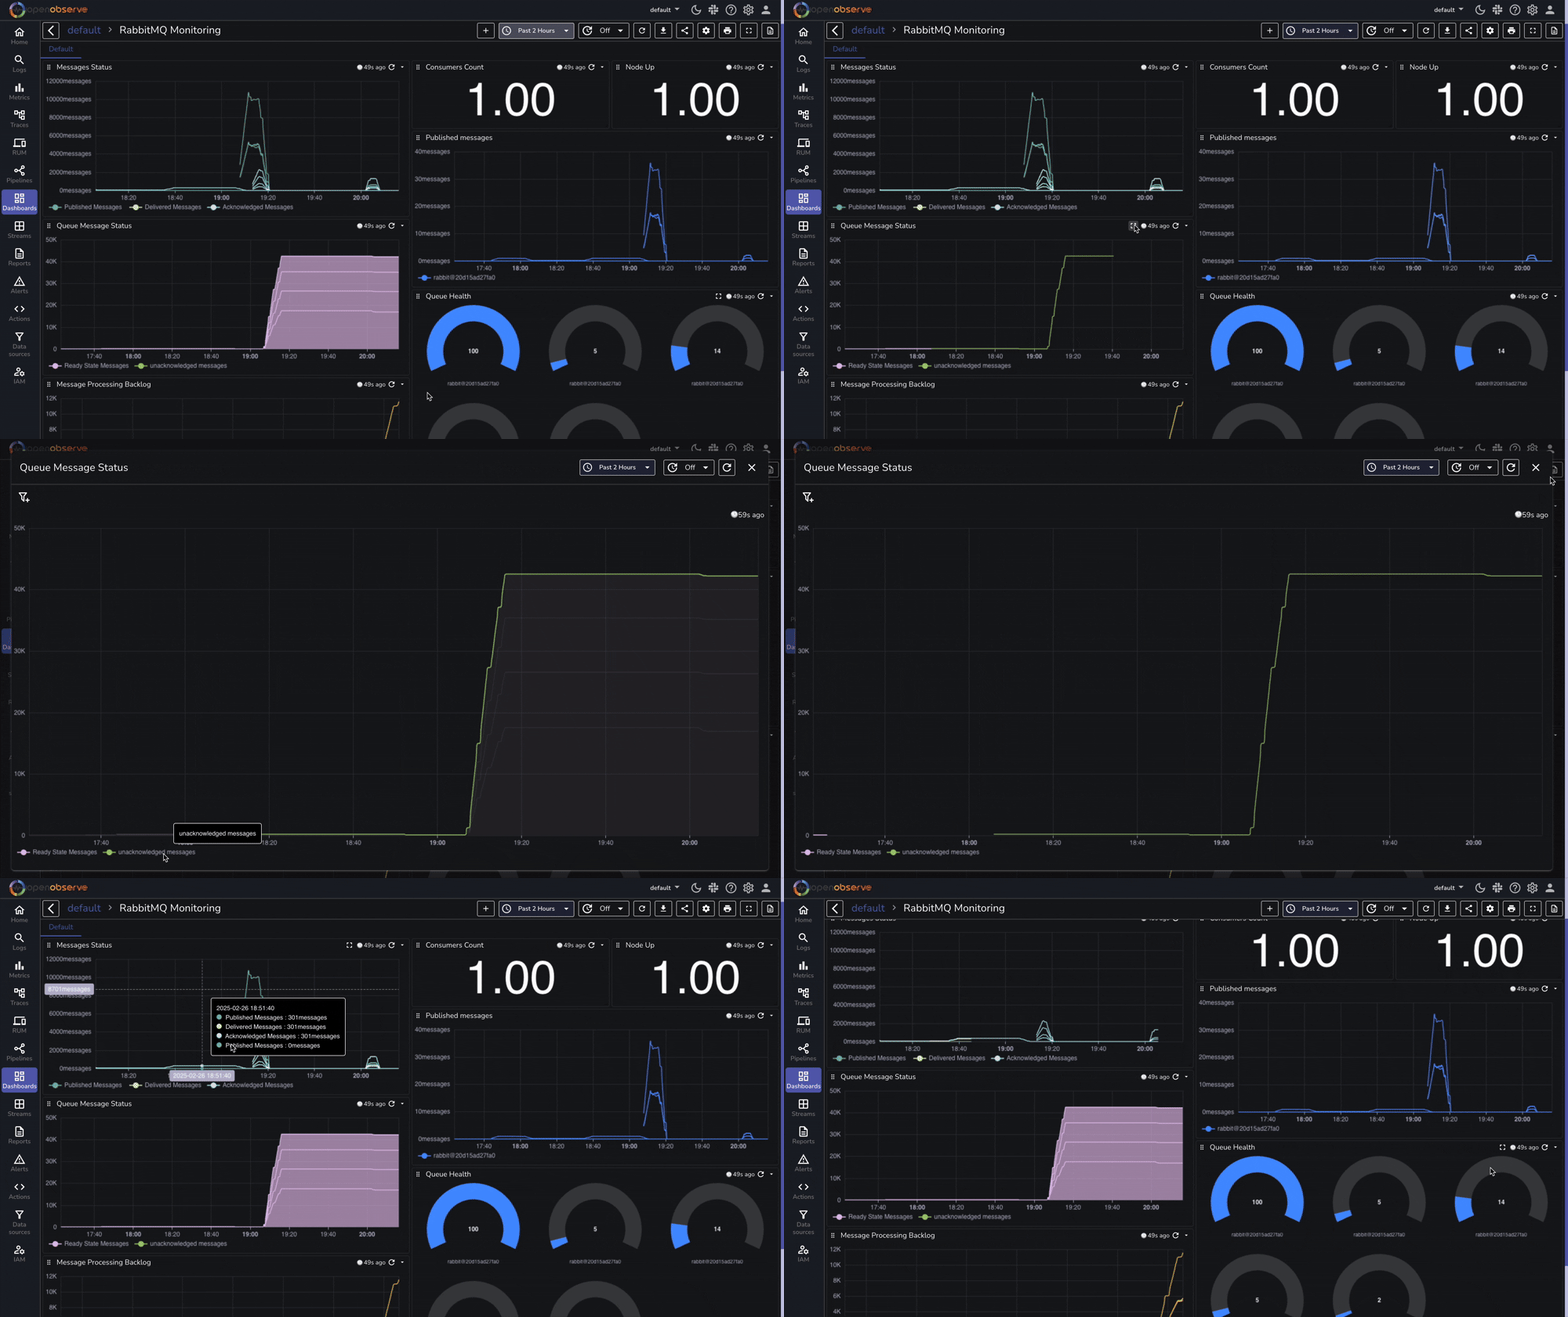
You can download our pre-configured dashboards here and import them directly into your OpenObserve instance.
Step 6: Troubleshooting Connection Issues
If you encounter issues during setup, consider these common solutions:
Management Plugin Access
- Verify the management plugin is enabled:
rabbitmq-plugins list - Check the management interface is accessible:
curl -i http://localhost:15672
- Verify the management plugin is enabled:
Authentication Issues
- Confirm user permissions:
rabbitmqctl list_user_permissions otel - Verify user tags:
rabbitmqctl list_users
- Confirm user permissions:
Network Connectivity
- Ensure ports 5672 (AMQP) and 15672 (Management API) are accessible
- Check for any firewall rules blocking access
TLS Configuration
- If using TLS, verify certificate paths and permissions
- Consider using
insecure_skip_verify: truefor testing
Conclusion
You've successfully set up comprehensive RabbitMQ monitoring using OpenTelemetry and OpenObserve. This setup provides valuable insights into your message broker's performance, helping you:
- Track message flow and processing rates
- Monitor queue depths and consumer health
- Identify bottlenecks and performance issues
- Ensure reliable message delivery
For a complete list of available metrics and configuration options, refer to the OpenTelemetry RabbitMQ Receiver Documentation.
Happy monitoring! 🚀
About the Author
Manas Sharma


Manas is a passionate Dev and Cloud Advocate with a strong focus on cloud-native technologies, including observability, cloud, kubernetes, and opensource. building bridges between tech and community.