How to Ingest Multi-Line Events in OpenObserve Using OpenObserve Collector




Ready to get started?
Try OpenObserve Cloud today for more efficient and performant observability.
1. Introduction to OpenObserve Collector
OpenObserve Collector is a powerful data ingestion agent designed to collect, process, and forward logs, metrics, and traces to OpenObserve. Built on the OpenTelemetry Collector framework, it provides a flexible and scalable solution for handling various data sources and formats.
Key features:
- Based on OpenTelemetry Collector
- Supports multiple data sources and formats
- Configurable processing pipelines
- Easy deployment via Helm charts
- Seamless integration with OpenObserve
2. Understanding Multi-Line Log Format
Here's an example of a typical multi-line log event that includes a Python stack trace with chained exceptions:
2025-10-14 07:34:40 ERROR [com.example.StackTraceGenerator] Error occurred during operation
Traceback (most recent call last):
  File "/app/app.py", line 30, in process_user
    database_operation()
  File "/app/app.py", line 25, in database_operation
    raise DatabaseException("Connection refused: Unable to connect to PostgreSQL at localhost:5432")
DatabaseException: Connection refused: Unable to connect to PostgreSQL at localhost:5432

The above exception was the direct cause of the following exception:

Traceback (most recent call last):
  File "/app/app.py", line 78, in main
    error_func(arg)
  File "/app/app.py", line 38, in handle_request
    process_user(user_id)
  File "/app/app.py", line 32, in process_user
    raise ServiceException(f"Failed to process user {user_id}") from e
ServiceException: Failed to process user 6654
This log entry contains:
- Timestamp:
2025-10-14 07:34:40 - Log level:
ERROR - Logger name:
[com.example.StackTraceGenerator] - Message:
Error occurred during operation - Stack trace: Multiple lines showing the exception chain with file paths, line numbers, and error details
3. The Multi-Line Event Challenge
Multi-stack trace events in applications often generate multi-line log entries where a single error or exception (e.g., a Python or Java stack trace) spans several lines, including file paths, line numbers, and nested exceptions. Without proper handling, these logs are fragmented, breaking context and complicating debugging.
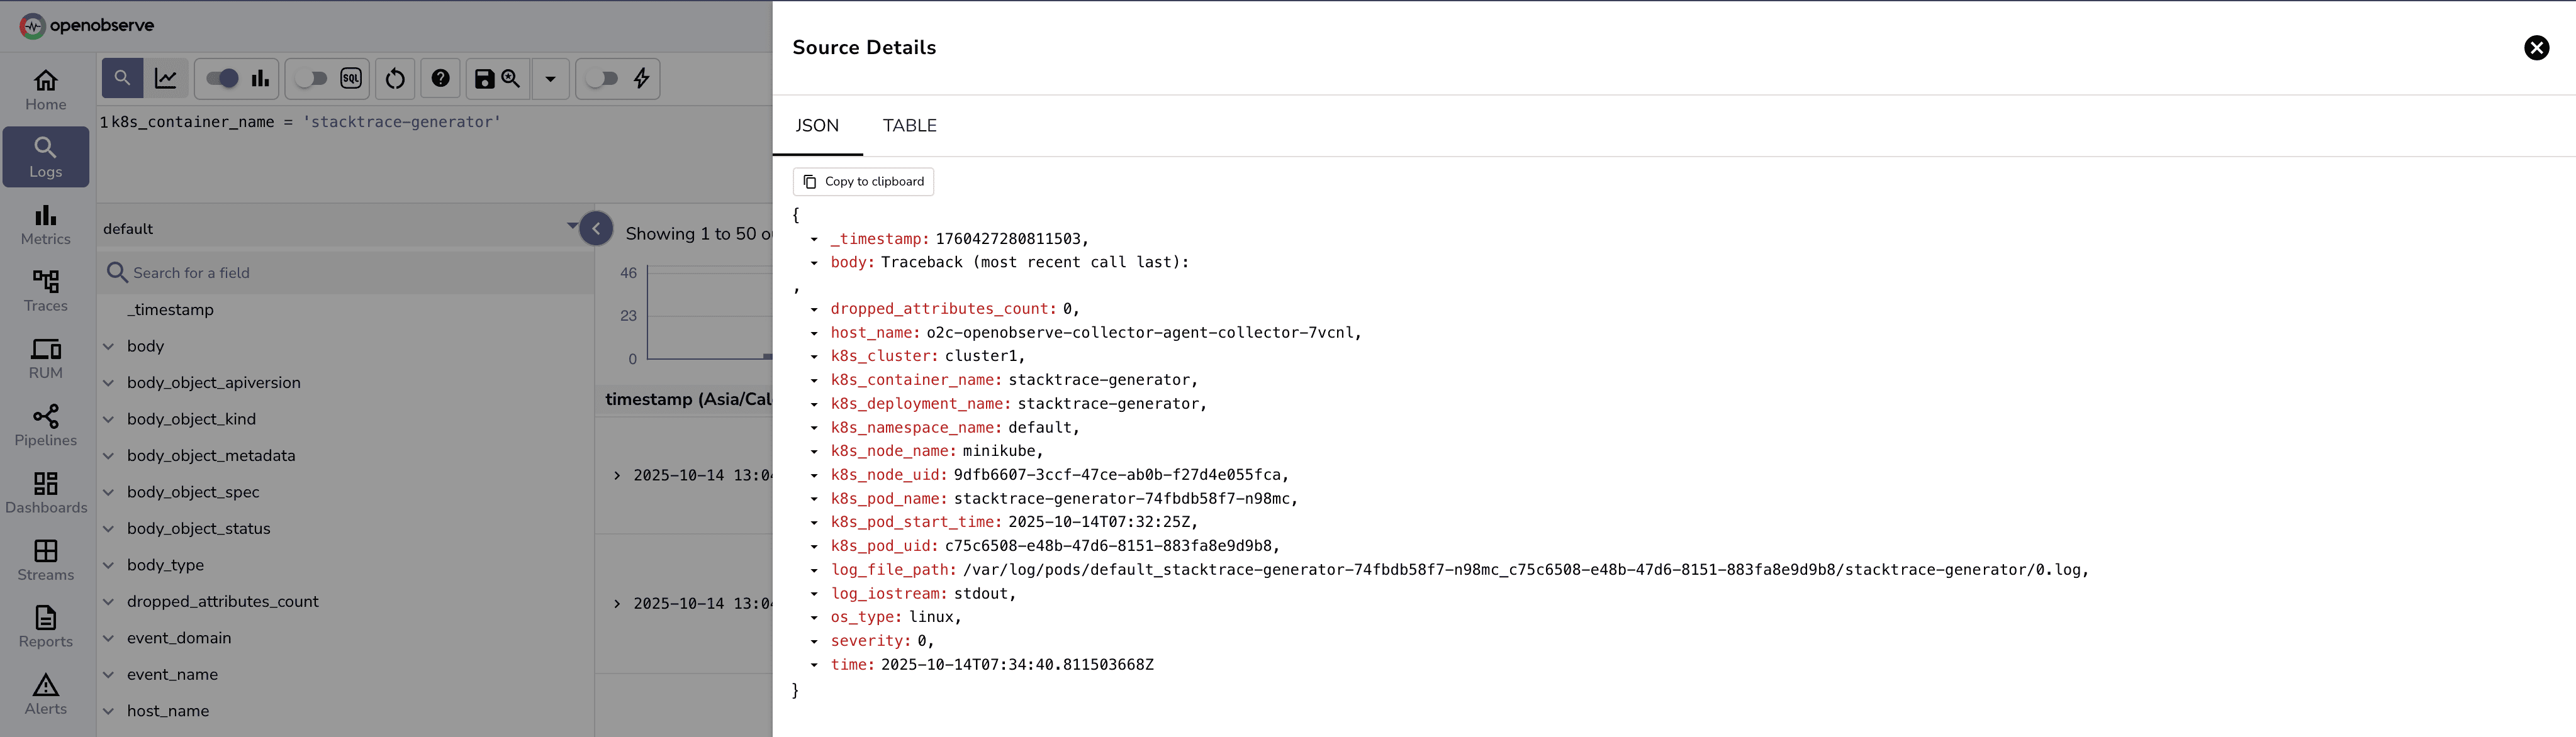
This illustrates how a single log can be split across lines.
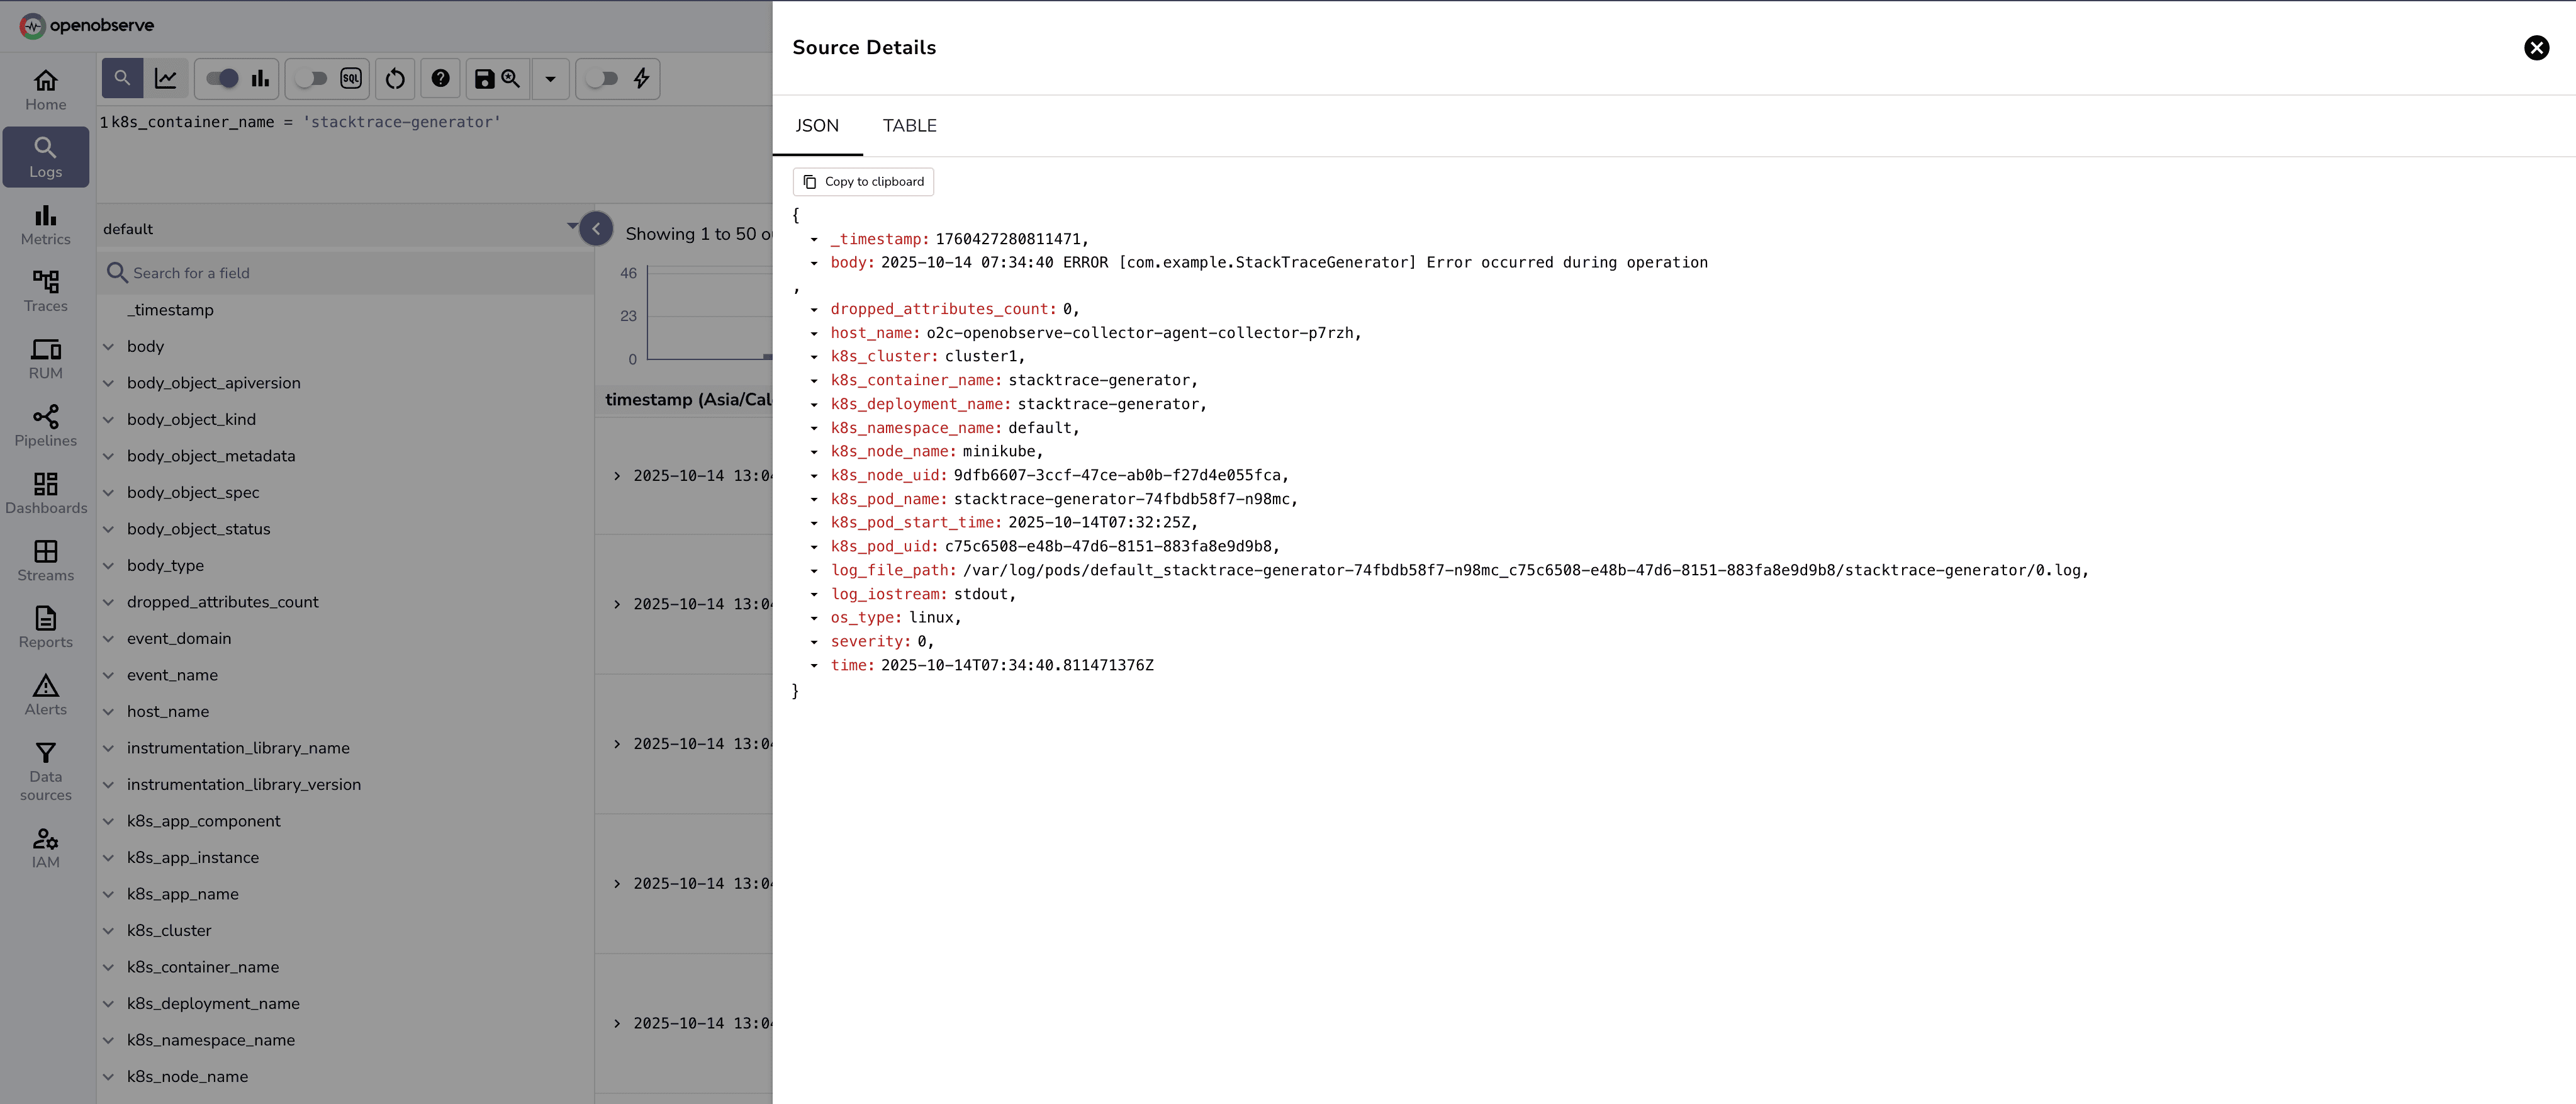
More log entries which shows further disconnection of related log data.
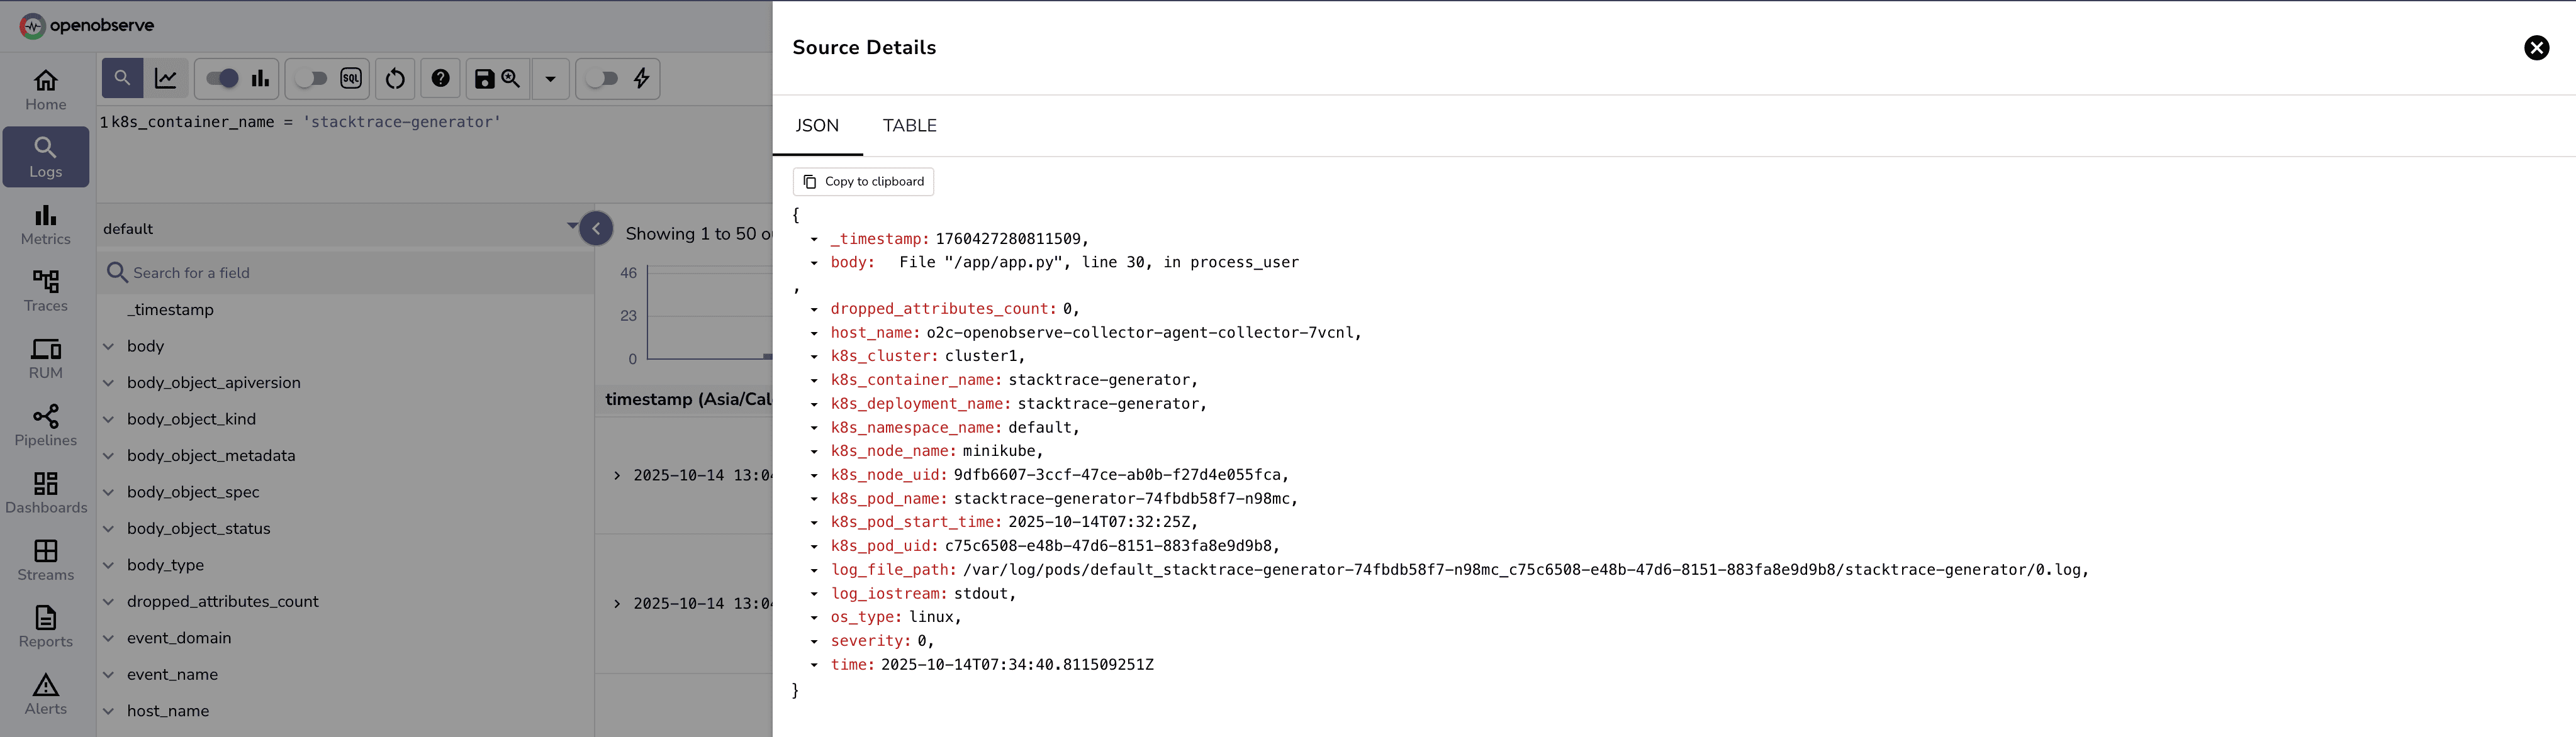
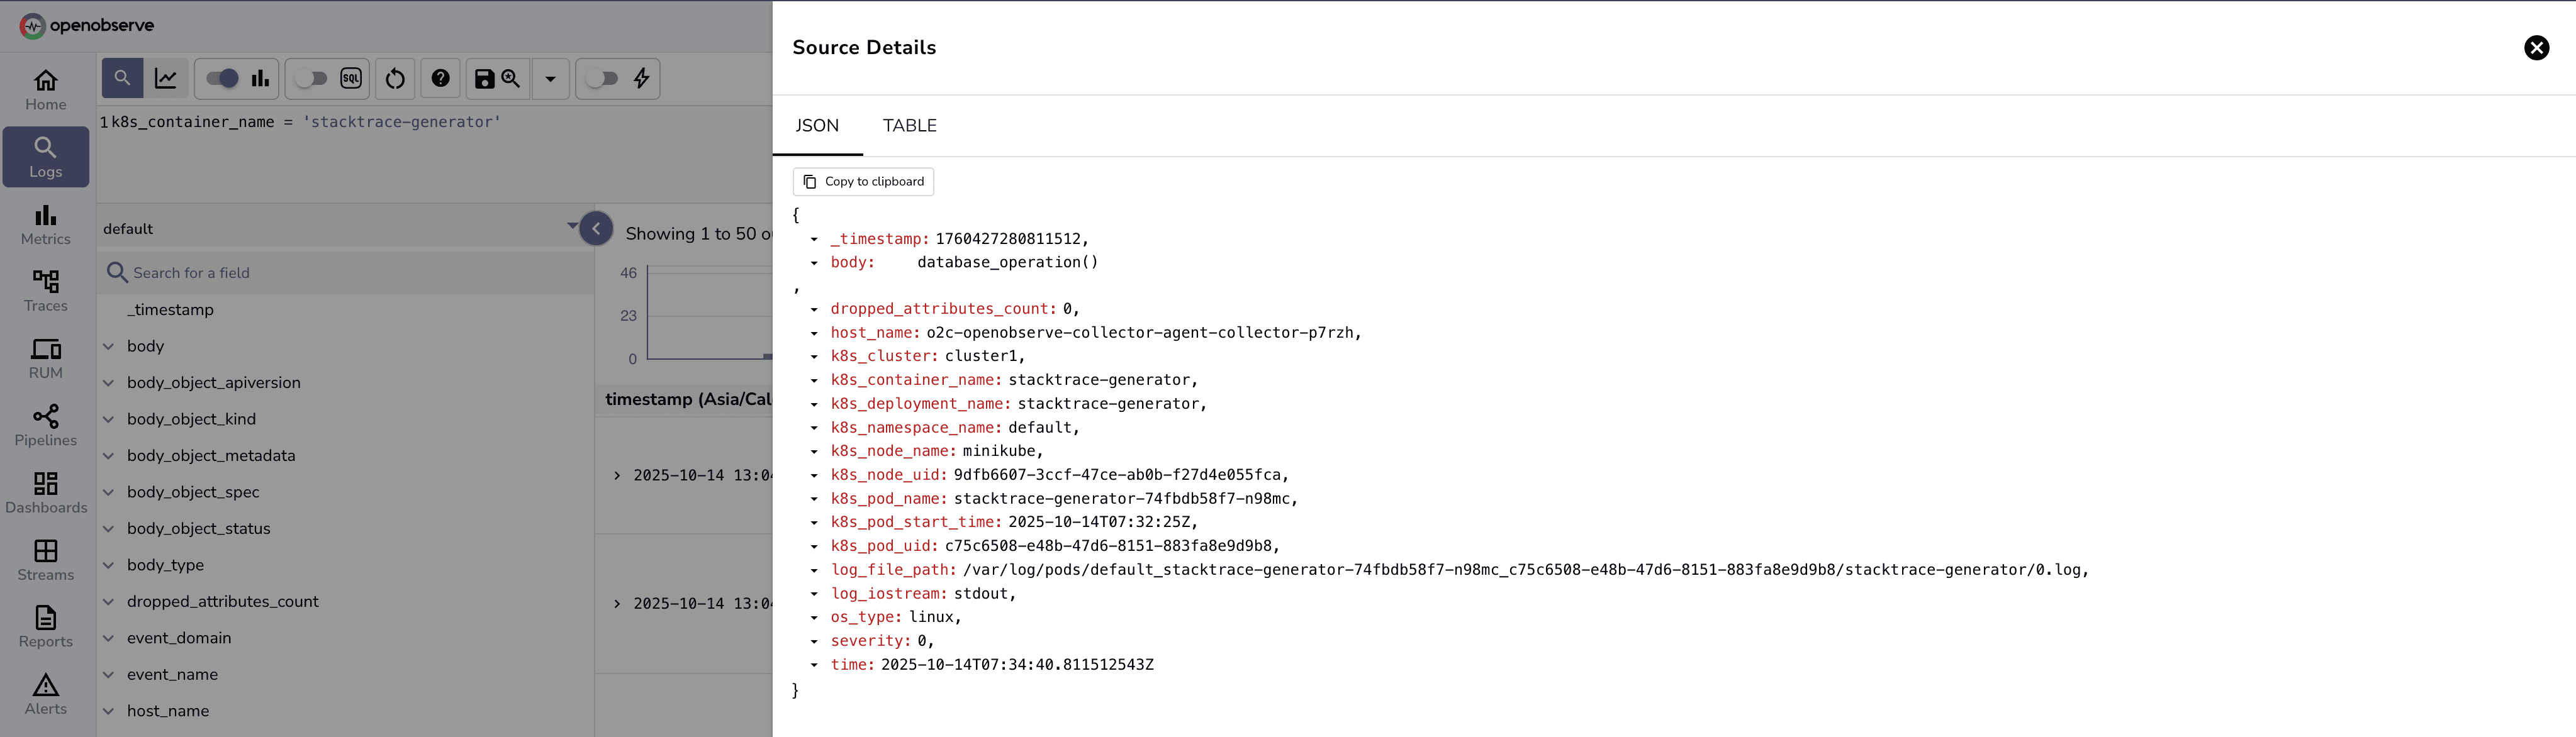
As depicted, nested logs split into separate entries resulting in loss of context while debugging.
When ingesting logs that span multiple lines (such as stack traces, JSON objects, or multi-line application logs), the default configuration may treat each line as a separate event. This results in:
- Fragmented log entries
- Difficult log analysis
- Loss of context between related lines
- Poor readability in the OpenObserve UI
What happens without multi-line configuration:
Without proper configuration, the sample log event shown in Section 2 would be split into 16+ separate log entries:
- Entry 1:
2025-10-14 07:34:40 ERROR [com.example.StackTraceGenerator] Error occurred during operation - Entry 2:
Traceback (most recent call last): - Entry 3:
File "/app/app.py", line 30, in process_user - Entry 4:
database_operation() - ... (and so on for each line)
This fragmentation makes it nearly impossible to understand the complete error context and troubleshoot issues effectively.
4. Configuration Changes in values.yaml
To enable multi-line event ingestion, you need to modify the OpenObserve Collector values.yaml file. The key is to configure the filelog receiver with a recombine operator.
Configuration Example:
For our sample log that starts with 2025-10-14 07:34:40 ERROR [com.example.StackTraceGenerator]..., we use the recombine operator that matches the timestamp format YYYY-MM-DD HH:MM:SS:
config:
  receivers:
    filelog:
      include:
        - /var/log/pods/*/*/*.log
      start_at: beginning
      operators:
        - id: recombine
          type: recombine
          combine_field: body
          source_identifier: attributes["log.file.path"]
          is_first_entry: 'body matches "^\\d{4}-\\d{2}-\\d{2} \\d{2}:\\d{2}:\\d{2}"'
          combine_with: "\n"
          max_log_size: 102400

  processors:
    batch:
      timeout: 10s
      send_batch_size: 1000

  exporters:
    otlphttp:
      endpoint: "http://your-openobserve-instance:5080/api/default"
      headers:
        Authorization: "Basic <your-auth-token>"
        stream-name: "default"

  service:
    pipelines:
      logs:
        receivers: [filelog]
        processors: [batch]
        exporters: [otlphttp]
Key Parameters:
- id: Unique identifier for the operator (recombine)
- type: Operator type -
recombinecombines multiple log entries into one - combine_field: Field to examine for combining logs (body)
- source_identifier: Identifies which file the log came from using the log file path attribute
- is_first_entry: Expression that determines if a line is the start of a new log entry. In our example, it matches timestamps like
2025-10-14 07:34:40 - combine_with: Character(s) used to join log lines (newline
\n) - max_log_size: Maximum size in bytes for a combined log entry (102400 = 100KB)
- start_at: Determines where to start reading logs (beginning or end)
- include: File paths to monitor for logs
- batch: Groups multiple log entries together for efficient transmission
Common Multi-Line Patterns:
Here are different is_first_entry patterns for various log formats:
# Timestamp-based logs (YYYY-MM-DD HH:MM:SS) - Used in our example
is_first_entry: 'body matches "^\\d{4}-\\d{2}-\\d{2} \\d{2}:\\d{2}:\\d{2}"'

# ISO 8601 timestamp with brackets [2024-01-01T10:00:00]
is_first_entry: 'body matches "^\\[\\d{4}-\\d{2}-\\d{2}T\\d{2}:\\d{2}:\\d{2}"'

# Log level based (ERROR, WARN, INFO, DEBUG)
is_first_entry: 'body matches "^(ERROR|WARN|INFO|DEBUG)"'

# Java/Python stack traces (starts with Traceback or date)
is_first_entry: 'body matches "^(\\d{4}-\\d{2}-\\d{2}|Traceback)"'

# Custom format with date and log level
is_first_entry: 'body matches "^\\d{4}-\\d{2}-\\d{2}.*(ERROR|WARN|INFO|DEBUG)"'
5. Deploying the Changes
Prerequisites:
- Helm 3.x installed
- kubectl configured for your Kubernetes cluster
- Access to the OpenObserve Collector Helm chart
Deployment Steps:
Step 1: Update values.yaml
# Edit your values.yaml file with the multi-line configuration
vi values.yaml
Step 2: Deploy or upgrade the collector
# For new installation:
helm install openobserve-collector openobserve/openobserve-collector \
  -f values.yaml \
  -n observability \
  --create-namespace

# For upgrading existing installation:
helm upgrade openobserve-collector openobserve/openobserve-collector \
  -f values.yaml \
  -n observability
Step 3: Verify the deployment
# Check pod status
kubectl get pods -n observability

# View collector logs
kubectl logs -f deployment/openobserve-collector -n observability

# Check for any errors
kubectl describe pod <collector-pod-name> -n observability
Step 4: Monitor the rollout
# Watch the rollout status
kubectl rollout status deployment/openobserve-collector -n observability
Rollback (if needed):
# Rollback to previous version if issues occur
helm rollback openobserve-collector -n observability
6. Verifying Multi-Line Event Ingestion
After deploying the changes, verify that the multi-line events are being properly ingested:
- Navigate to your OpenObserve logs console
- Search for logs that should contain multiple lines
- Verify that related lines are grouped as a single event
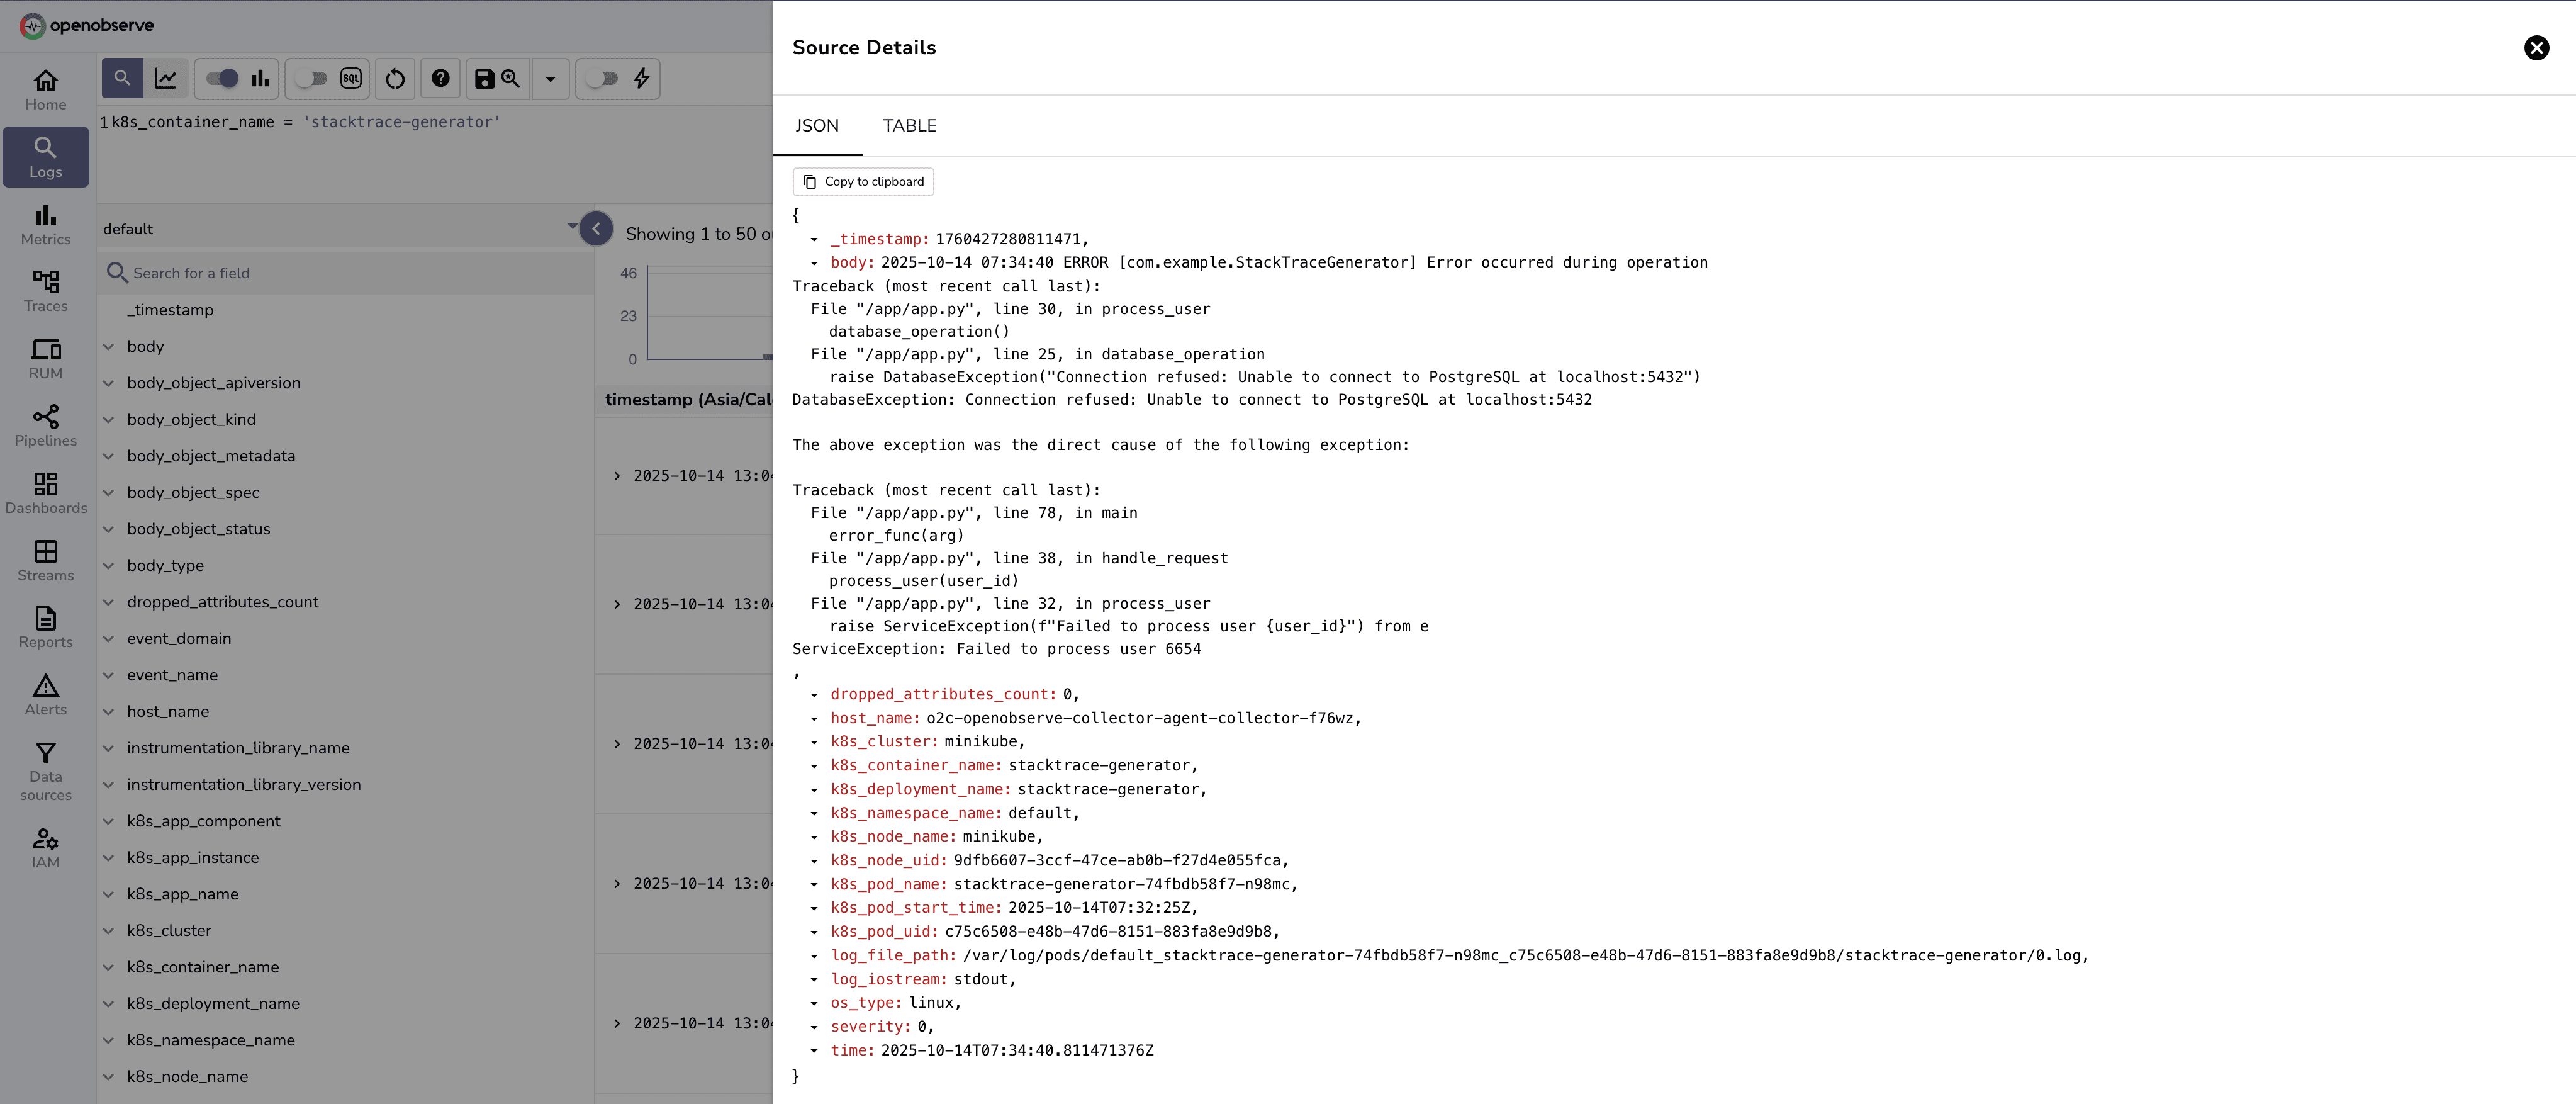
Expected Results:
Before configuration (fragmented):
Each line appears as a separate log entry:
[Entry 1] 2025-10-14 07:34:40 ERROR [com.example.StackTraceGenerator] Error occurred during operation
[Entry 2] Traceback (most recent call last):
[Entry 3]   File "/app/app.py", line 30, in process_user
[Entry 4]     database_operation()
[Entry 5]   File "/app/app.py", line 25, in database_operation
... (16+ separate entries)
After configuration (consolidated):
The entire stack trace appears as one log entry:
[Single Entry] 2025-10-14 07:34:40 ERROR [com.example.StackTraceGenerator] Error occurred during operation
Traceback (most recent call last):
  File "/app/app.py", line 30, in process_user
    database_operation()
  File "/app/app.py", line 25, in database_operation
    raise DatabaseException("Connection refused: Unable to connect to PostgreSQL at localhost:5432")
DatabaseException: Connection refused: Unable to connect to PostgreSQL at localhost:5432

The above exception was the direct cause of the following exception:

Traceback (most recent call last):
  File "/app/app.py", line 78, in main
    error_func(arg)
  File "/app/app.py", line 38, in handle_request
    process_user(user_id)
  File "/app/app.py", line 32, in process_user
    raise ServiceException(f"Failed to process user {user_id}") from e
ServiceException: Failed to process user 6654
Validation Checklist:
- Multi-line stack traces appear as single events
- JSON objects spanning multiple lines are intact
- Log context is preserved across lines
- No artificial line breaks in the OpenObserve UI
- Timestamp parsing is correct
- Search and filtering work as expected
7. Troubleshooting
Common Issues:
Issue 1: Lines still appearing separately
- Check that the
is_first_entryexpression matches your log format - Verify the regex pattern with a tool like regex101.com
- Test the pattern: ensure it matches lines like
2025-10-14 07:34:40 - Check the
max_log_sizevalue - increase if logs are being truncated - Ensure the operator order is correct in values.yaml
Issue 2: Collector pod crashes
- Check pod logs:
kubectl logs <pod-name> -n observability - Verify YAML syntax is correct
- Ensure sufficient resources are allocated
Issue 3: Logs not appearing in OpenObserve
- Verify network connectivity to OpenObserve
- Check authentication credentials
- Confirm the correct endpoint and organization name
8. Conclusion
By configuring the OpenObserve Collector with multi-line support, you can significantly improve log readability and analysis. The recombine operator in the filelog receiver allows you to capture complex log entries that span multiple lines, providing better context and easier troubleshooting.
Remember to:
- Test your
is_first_entrypattern with sample logs - Monitor collector performance after changes
- Adjust batch settings for optimal throughput
- Keep your collector version up to date
For more information, visit the OpenObserve documentation and OpenTelemetry Collector documentation.
About the Author
Md Mosaraf
I'm a Solution Architect and Observability Engineer with over 10 years of experience helping organizations build resilient, transparent systems. As a Certified Splunk Consultant, I've spent my career turning data into actionable insights that drive real business outcomes. I'm passionate about open source observability tools and believe that robust monitoring is the foundation of modern infrastructure. I share practical strategies, lessons learned, and hands-on guidance from the trenches of enterprise observability
Follow OpenObserve on Google
Add OpenObserve as a preferred source to see more of our articles in Google Search and Top Stories.













