AWS Cost and Usage Reports (CUR): A Complete Guide to Cloud Cost Visibility and Optimization




Ready to get started?
Try OpenObserve Cloud today for more efficient and performant observability.
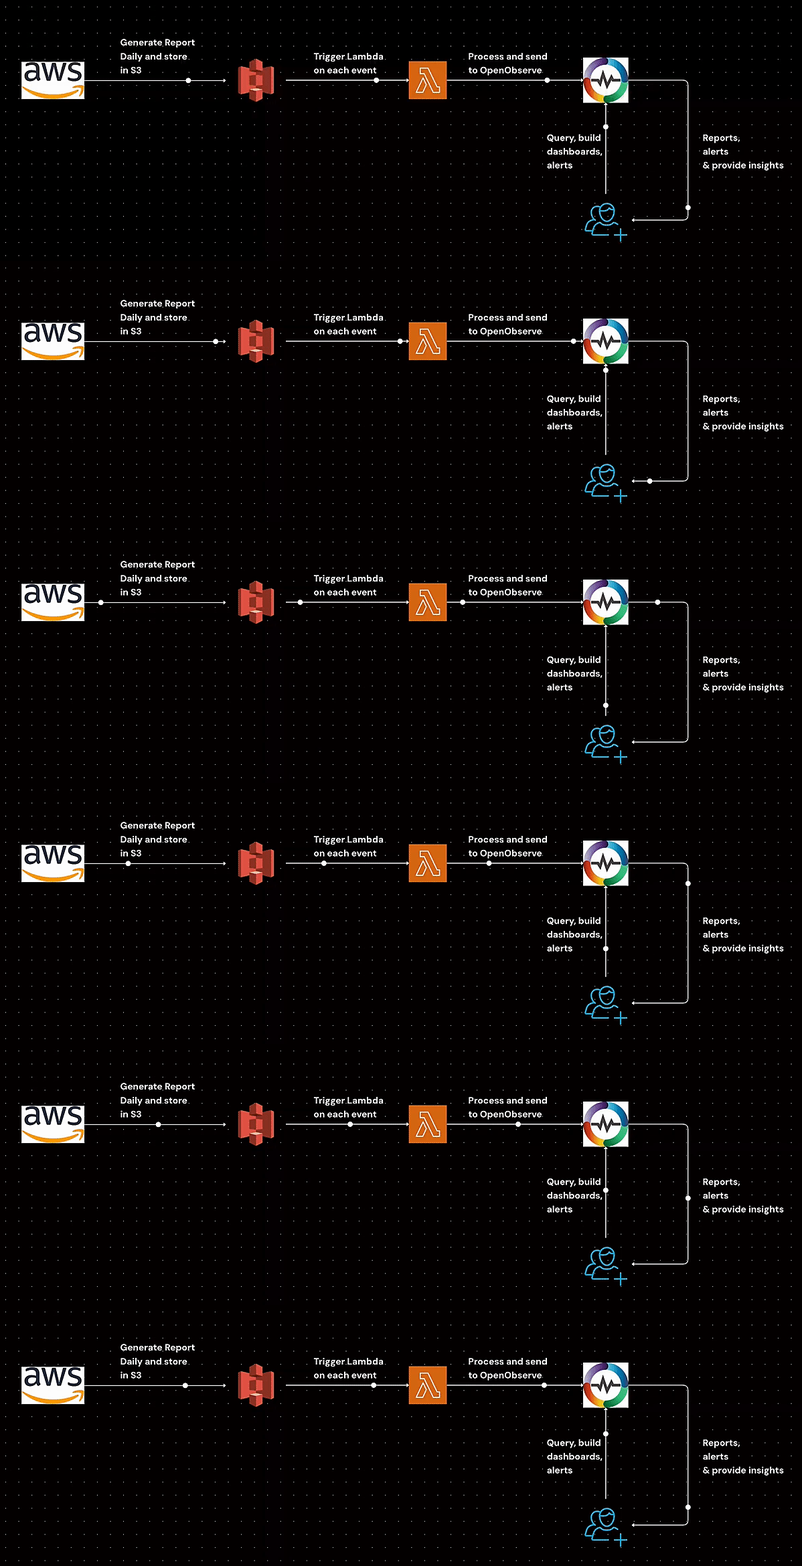
Understanding AWS cost utilization is crucial for effective cloud cost management. AWS resources can quickly accumulate costs, and without a structured approach to monitoring, businesses may experience unexpected overruns. By leveraging AWS Cost and Usage Reports (CUR) and OpenObserve, you can efficiently analyze and visualize cost data, ensuring better cost optimization and governance.
This guide walks you through the setup process, from generating AWS CUR to analyzing data in OpenObserve. You will learn how to configure AWS CUR, automate data ingestion with AWS Lambda, set up necessary IAM policies, and integrate with OpenObserve for real-time cost monitoring. Additionally, we will explore how to leverage predefined dashboards and queries to extract meaningful insights from your cost data. By the end of this guide, you will have a well-structured approach to tracking, analyzing, and optimizing your AWS cloud expenses.
Step 1: Create AWS Cost and Usage Report (CUR)
AWS Cost and Usage Reports (CUR) provide comprehensive cost and usage data across AWS accounts. To create a CUR:
- Navigate to the AWS Billing Console.
- Select Data Exports under Cost and Usage Analysis.
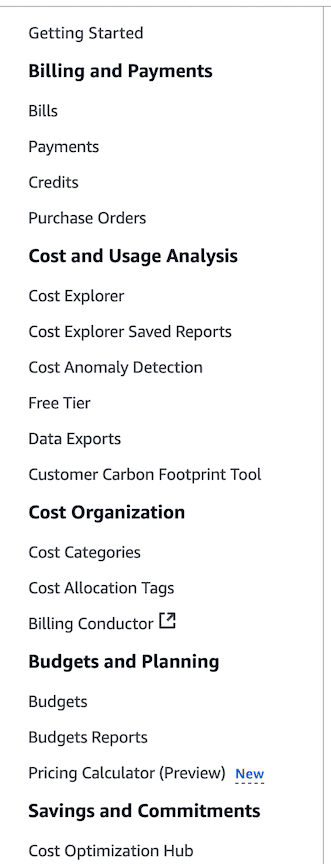
- Click Create Report Configure the CUR as per the below screenshots.
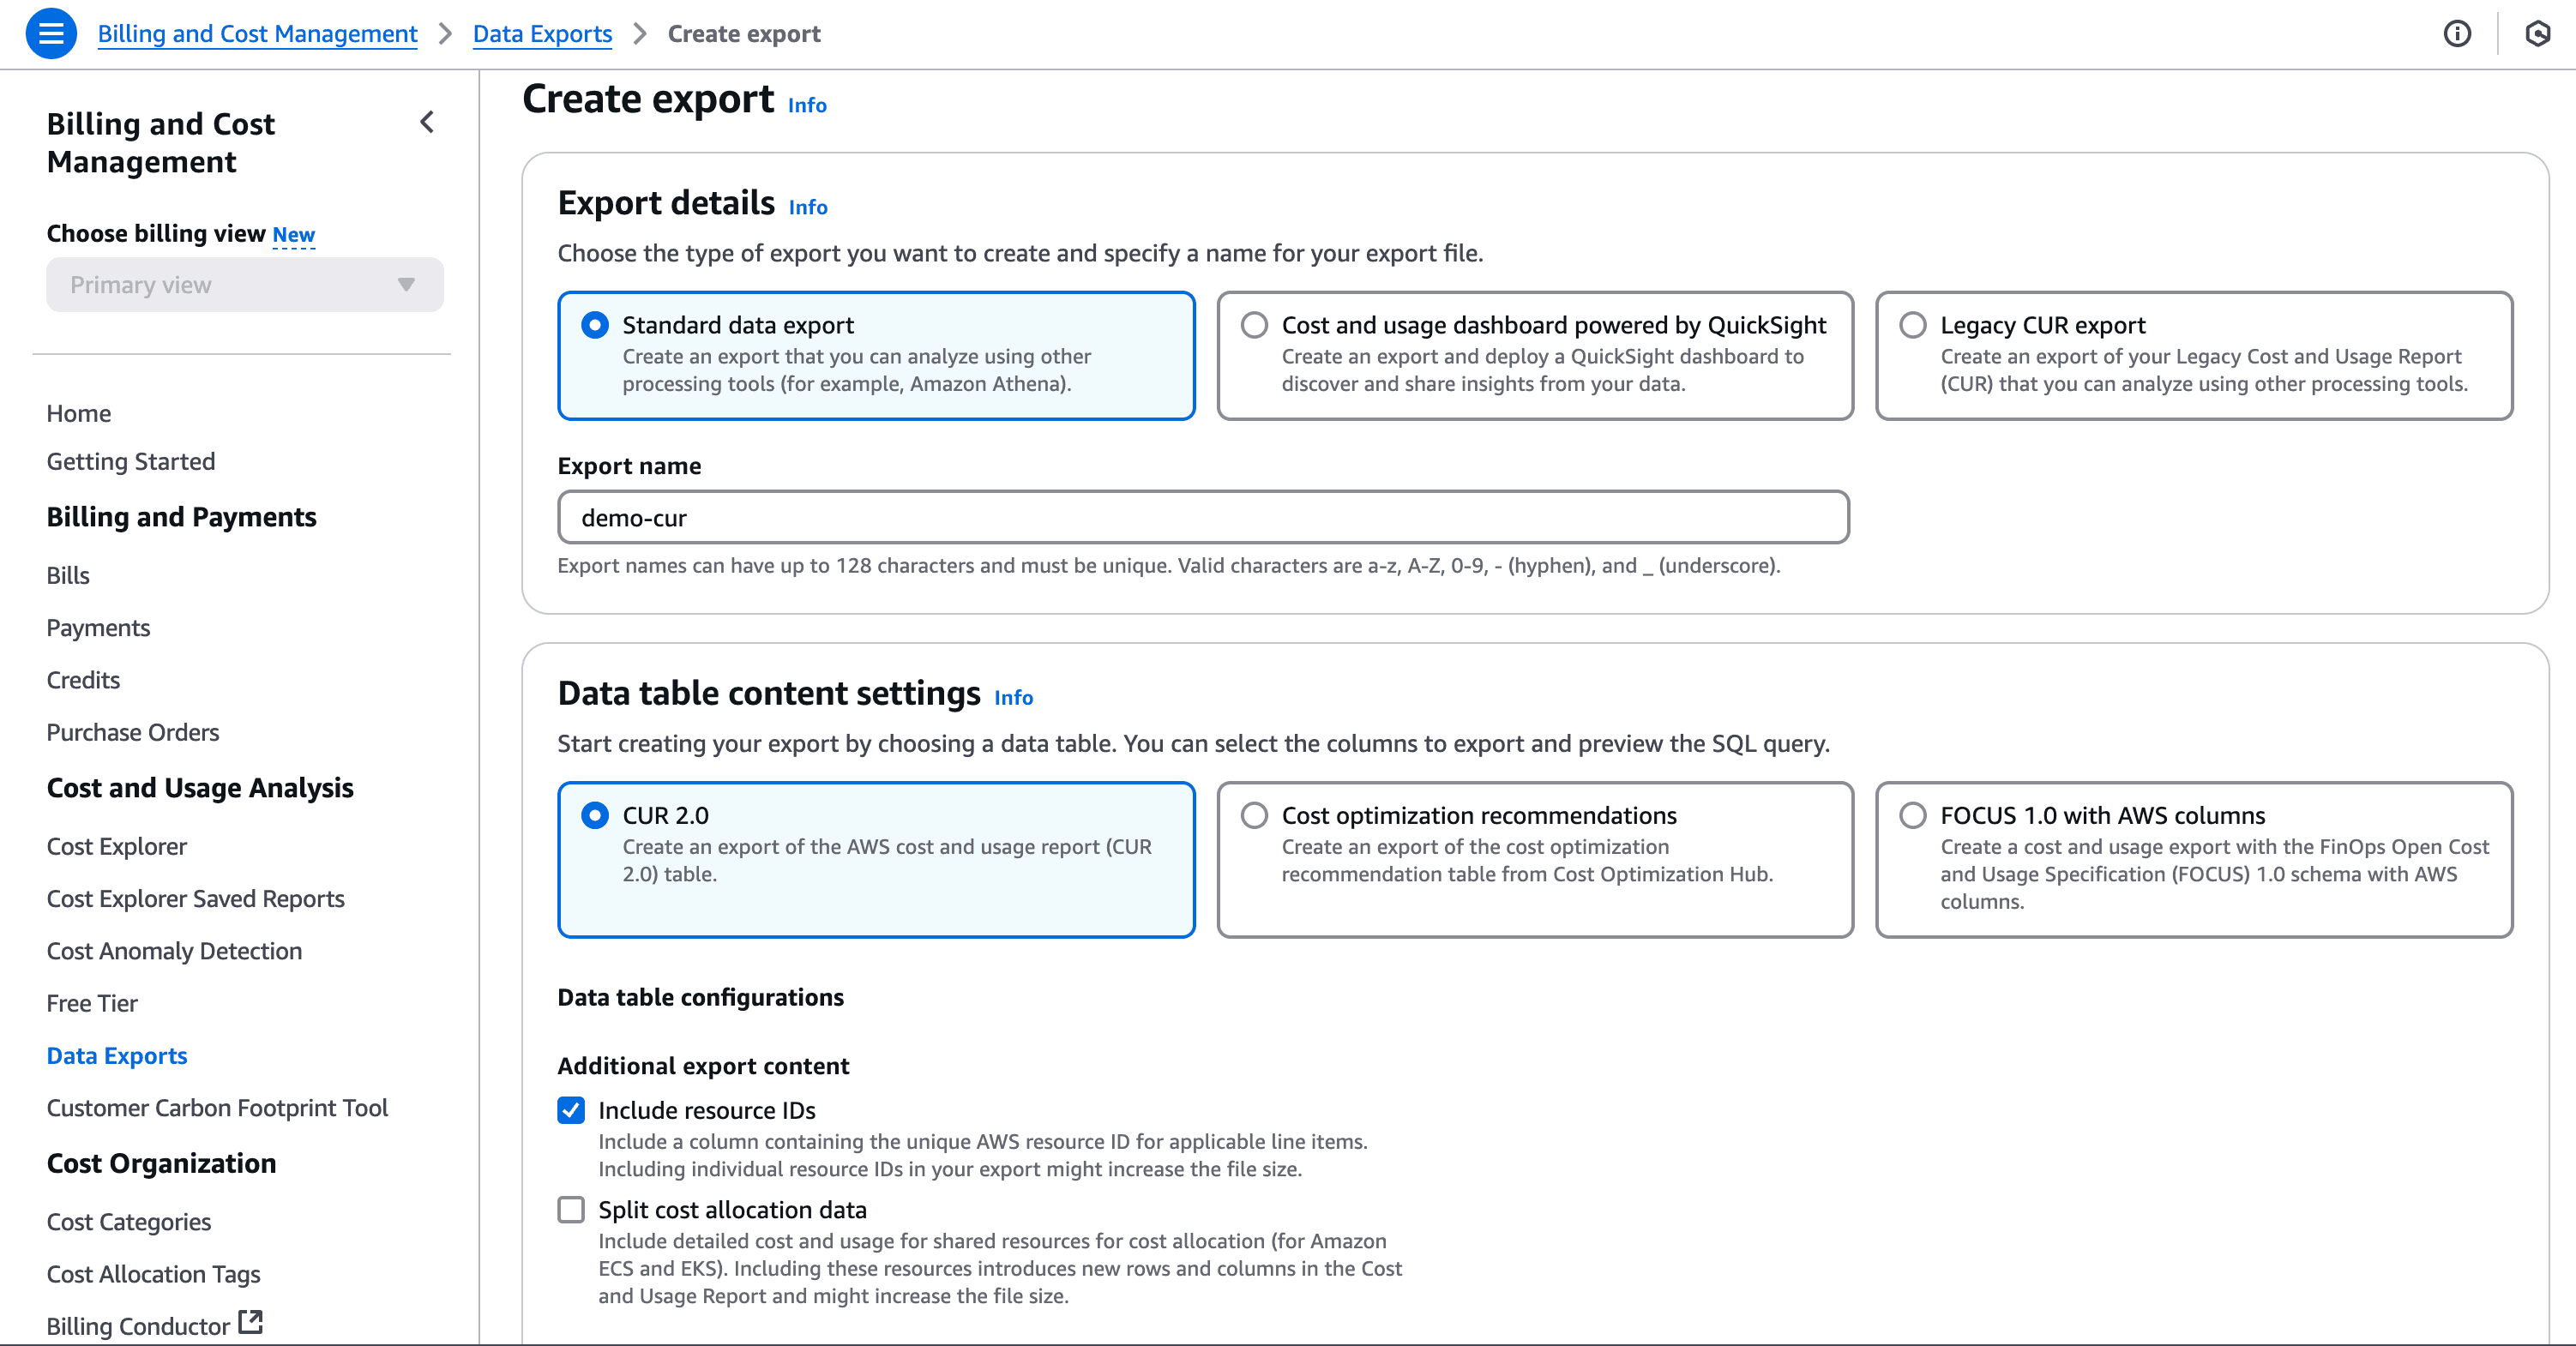
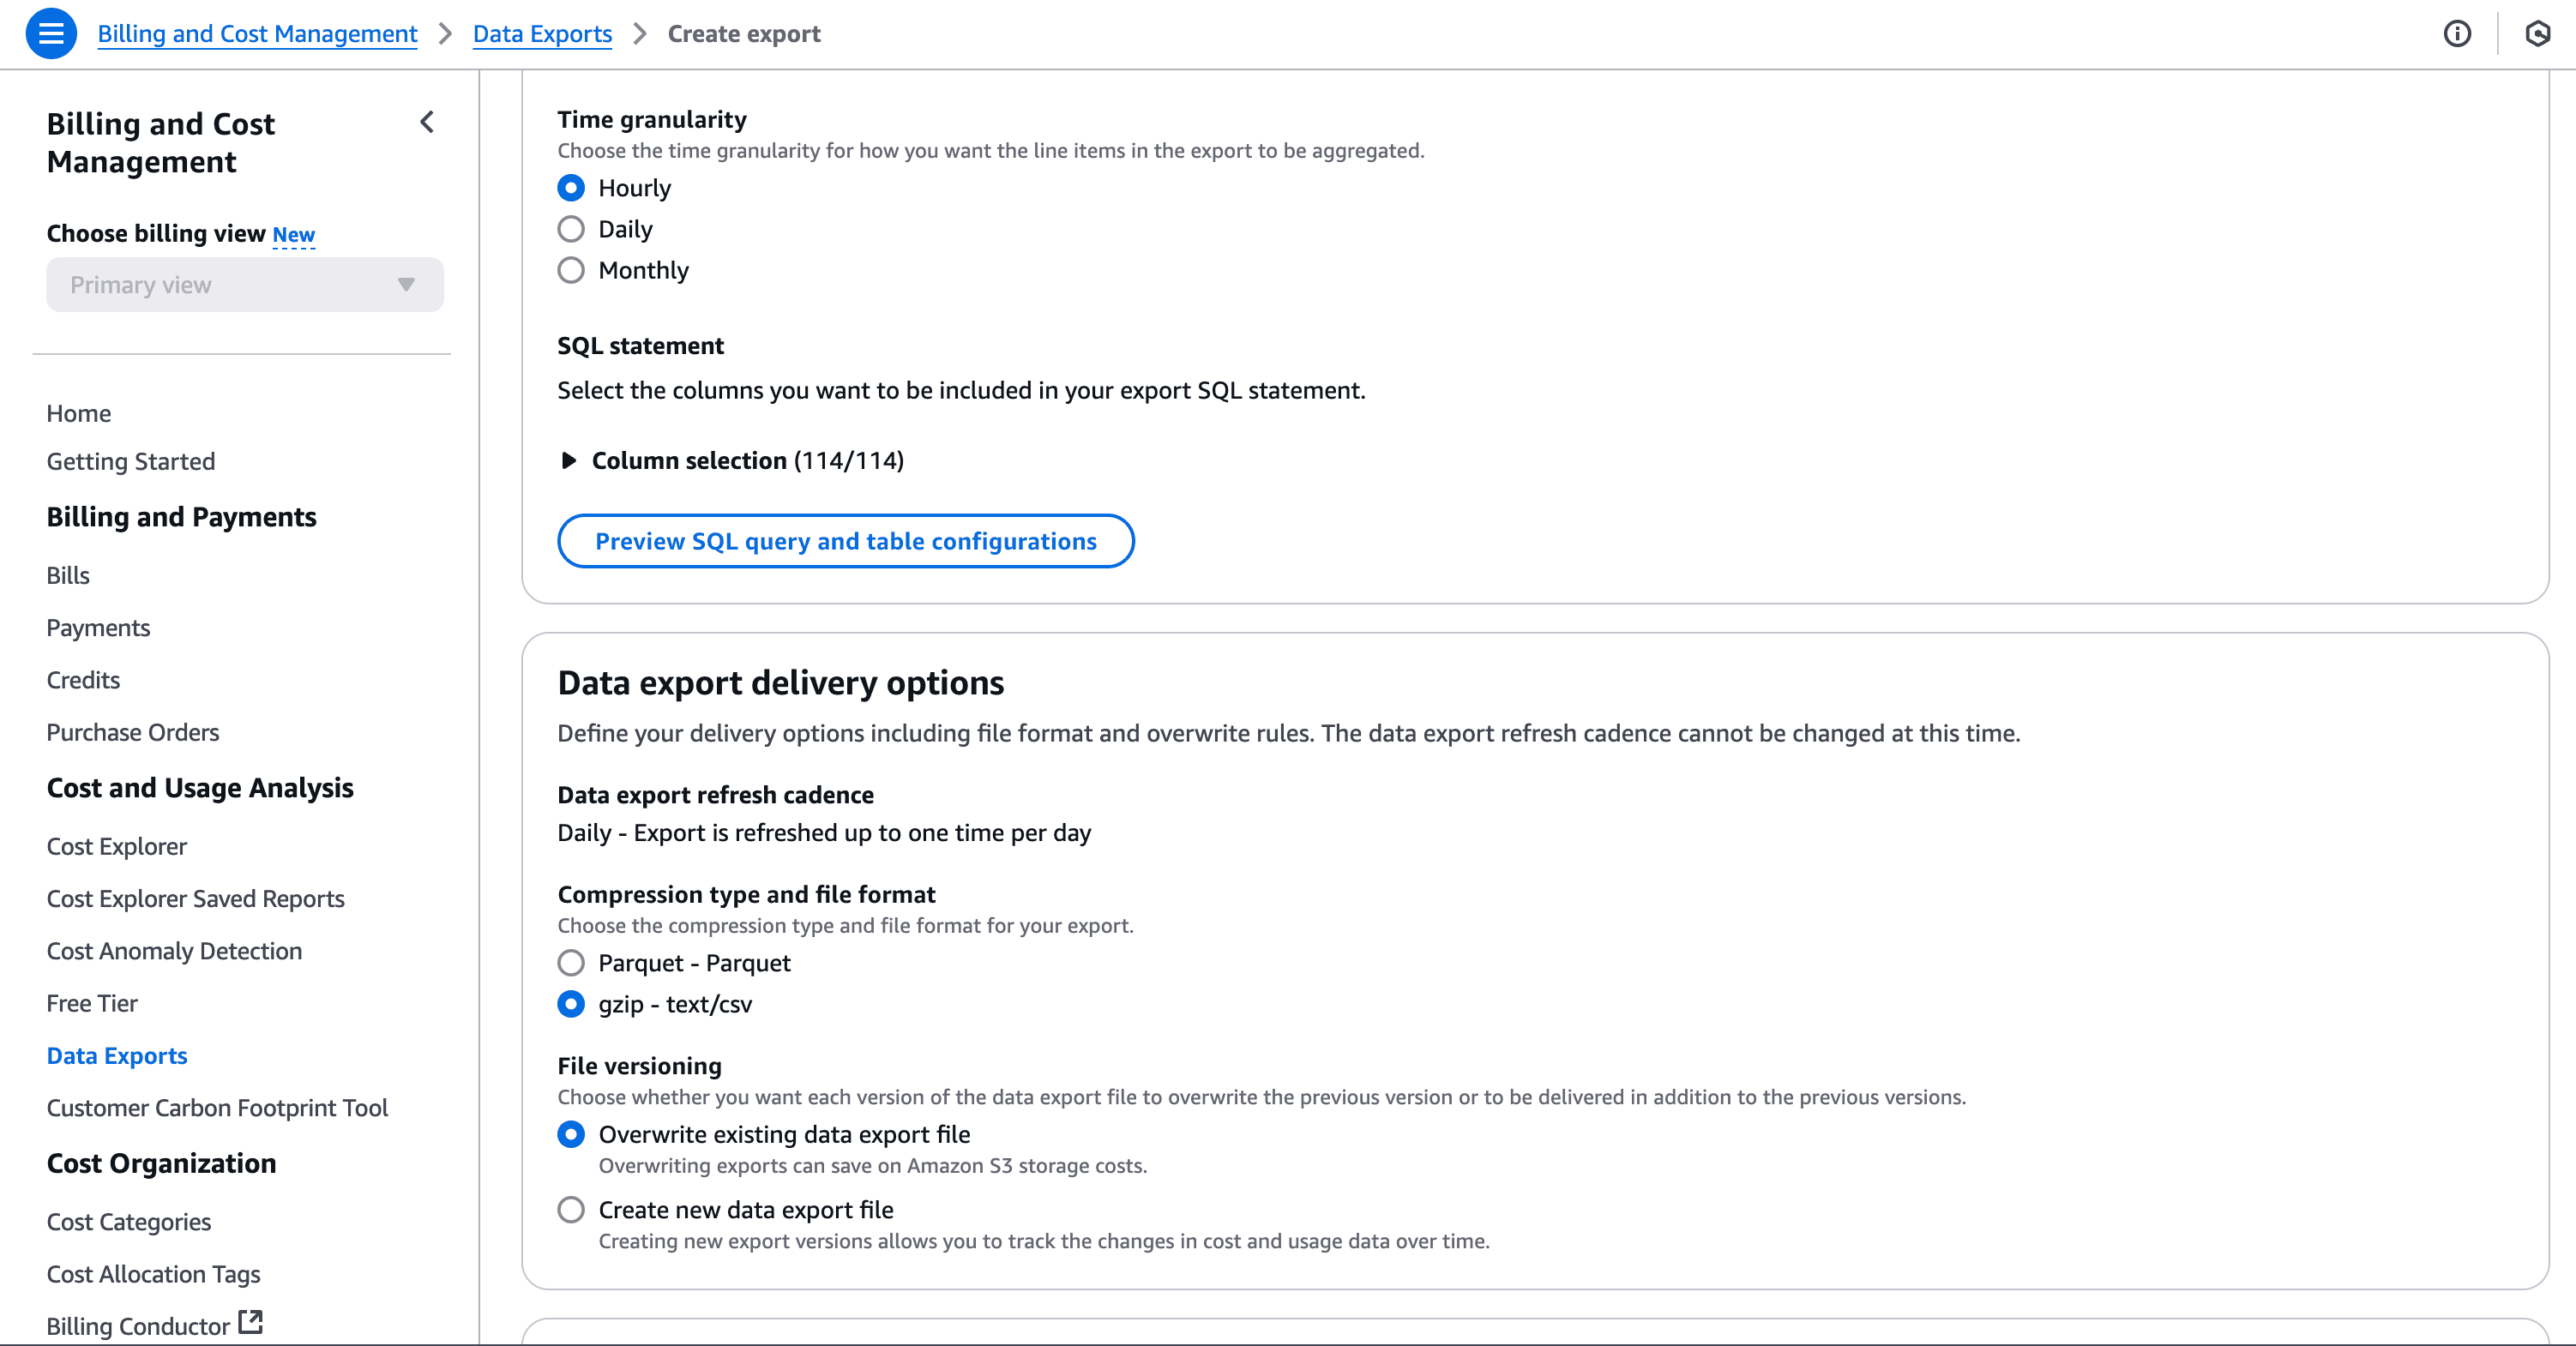
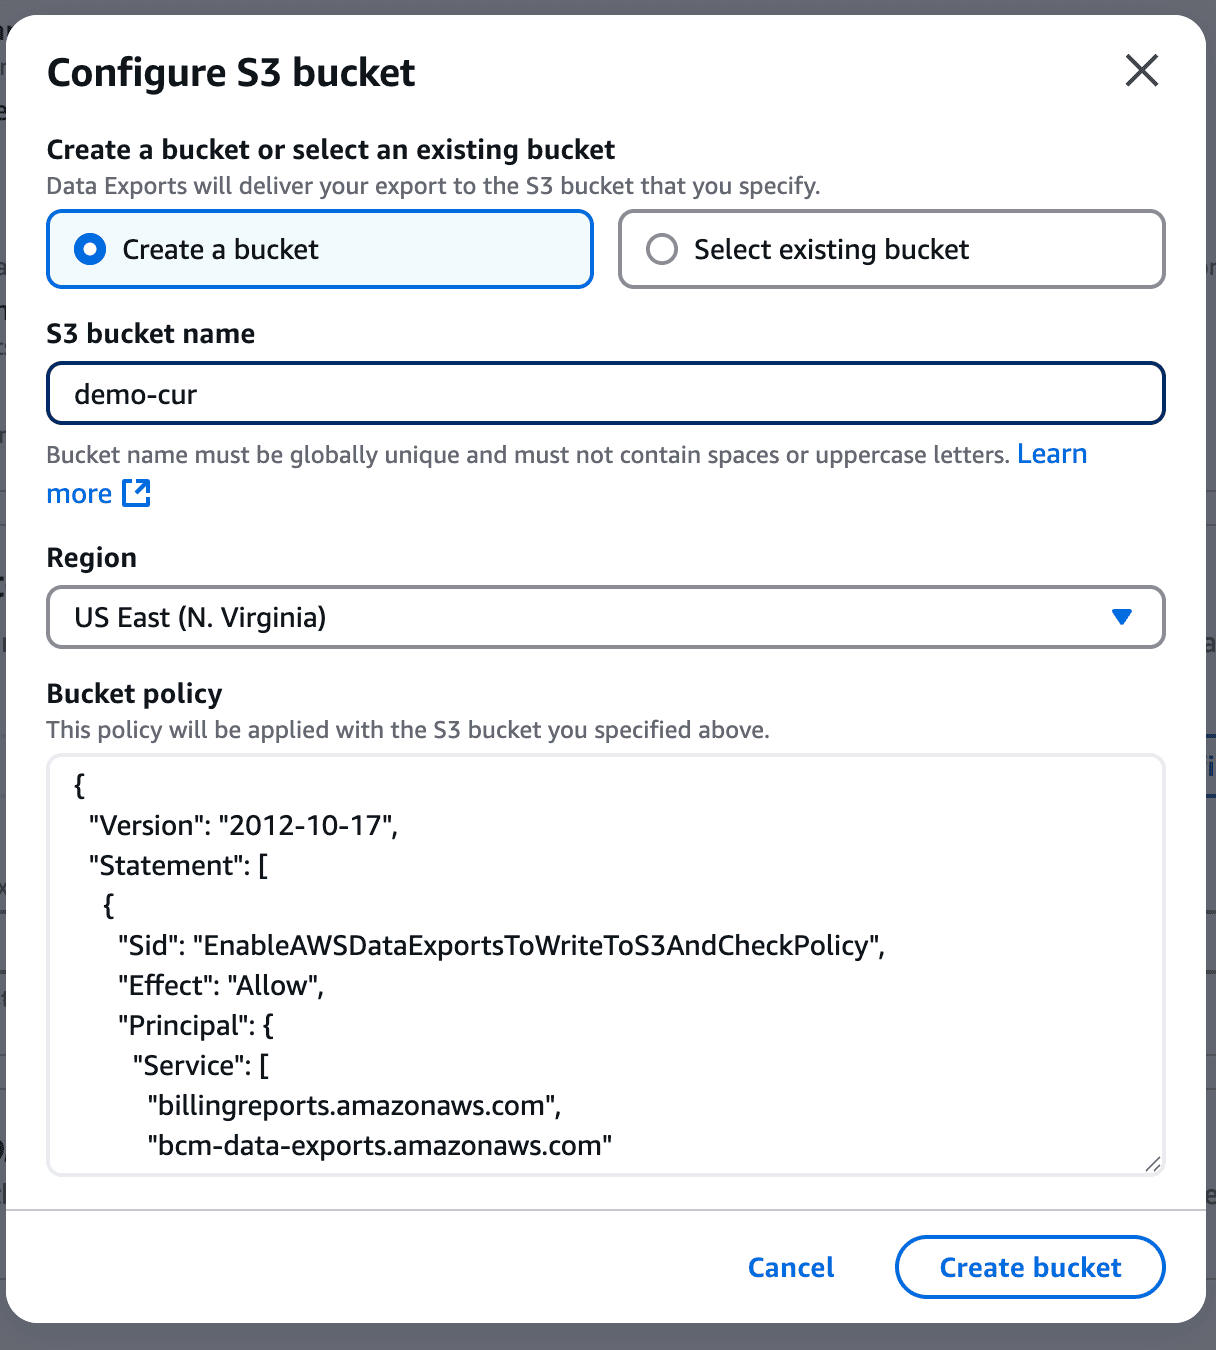
And finally click on save. This will take a while to get the first report in place.
Step 2: Create a Lambda Function to Write to OpenObserve
To ingest AWS CUR logs into OpenObserve, create a Lambda function:
- Navigate to AWS Lambda.
- Click Create Function > Author from Scratch.
- Name the function (e.g., cur-to-openobserve).
- Choose Runtime: Python 3.9+.
- Add OPENOBSERVE_ENDPOINT, BASIC_AUTH_USERNAME and BASIC_AUTH_PASSWORD as environment variables.
- Assign necessary permissions (IAM policy details below). Replace variables between <> with your details
- Use the following code snippet:
import boto3
import gzip
import json
import os
import http.client
import csv
import logging
from base64 import b64encode
from urllib.parse import unquote, urlparse
from botocore.exceptions import ClientError
from datetime import datetime
import json
import time

logger = logging.getLogger()
logger.setLevel(logging.INFO)

s3_client = boto3.client('s3')
openobserve_endpoint = os.getenv('OPENOBSERVE_ENDPOINT')
basic_auth_username = os.getenv('BASIC_AUTH_USERNAME')
basic_auth_password = os.getenv('BASIC_AUTH_PASSWORD')

def lambda_handler(event, context):
    # Process each S3 record given in the event
    for record in event['Records']:
        s3_bucket = record['s3']['bucket']['name']
        s3_key = unquote(record['s3']['object']['key'])
        logger.info(f"Processing file - Bucket: {s3_bucket}, Key: {s3_key}")

        try:
            process_csv_stream(s3_bucket, s3_key)
        except ClientError as e:
            error_code = e.response.get('Error', {}).get('Code')
            if error_code == 'NoSuchKey':
                logger.error(f"File not found in S3 - Bucket: {s3_bucket}, Key: {s3_key}")
            else:
                logger.error(f"S3 ClientError: {str(e)}")
            raise
        except Exception as e:
            logger.error(f"Error processing file: {str(e)}")
            raise


def stream_lines_from_s3(bucket, key):
    """Return a generator that yields one decoded line at a time from the decompressed S3 object."""
    response = s3_client.get_object(Bucket=bucket, Key=key)
    with gzip.GzipFile(fileobj=response['Body']) as gz:
        for line in gz:
            yield line.decode('utf-8').rstrip('\n')


def process_csv_stream(bucket, key, chunk_size=1000):
    """
    Process CSV content in a streaming manner, reading a chunk of lines,
    converting them to dictionaries, and sending them to OpenObserve.
    """
    lines_generator = stream_lines_from_s3(bucket, key)
    # Use csv.DictReader on the first chunk to get headers
    first_chunk = []
    for line in lines_generator:
        first_chunk.append(line)
        if len(first_chunk) >= chunk_size:
            break

    if not first_chunk:
        logger.error("No data found in the file.")
        return

    reader = csv.DictReader(first_chunk)
    headers = reader.fieldnames
    if not headers:
        logger.error("CSV file does not have headers.")
        return

    # Process the first chunk
    records = list(reader)
    push_logs_to_openobserve(records)

    # Process subsequent chunks
    current_chunk = []
    for line in lines_generator:
        current_chunk.append(line)
        if len(current_chunk) >= chunk_size:
            reader = csv.DictReader(current_chunk, fieldnames=headers)
            # If headers are known, skip the header row if it appears again
            records = list(reader)
            push_logs_to_openobserve(records)
            current_chunk = []  # Release the memory

    # Process any remaining lines
    if current_chunk:
        reader = csv.DictReader(current_chunk, fieldnames=headers)
        records = list(reader)
        push_logs_to_openobserve(records)

def push_logs_to_openobserve(log_events):
    parsed_url = urlparse(openobserve_endpoint)
    auth_header = b64encode(f"{basic_auth_username}:{basic_auth_password}".encode()).decode()
    headers = {
        'Content-Type': 'application/json',
        'Authorization': f'Basic {auth_header}'
    }

    for log_record in log_events:
        try:
            # Convert lineItem/UsageStartDate to _timestamp (Epoch in microseconds)
            usage_start_date = log_record.get("lineItem/UsageStartDate", "")
            if usage_start_date:
                try:
                    # Convert to microseconds
                    timestamp = int(datetime.strptime(usage_start_date, "%Y-%m-%dT%H:%M:%SZ").timestamp() * 1_000_000)
                except ValueError:
                    logger.warning(f"Invalid timestamp format: {usage_start_date}")
                    timestamp = None

                if timestamp:
                    log_record["_timestamp"] = timestamp

            # Print the log record for debugging
            logger.info(f"Sending log record: {json.dumps(log_record, indent=2)}")

            body = json.dumps(log_record)
            conn = http.client.HTTPSConnection(parsed_url.netloc)
            conn.request("POST", parsed_url.path, body=body, headers=headers)
            response = conn.getresponse()

            logger.info(f"OpenObserve response: {response.status} {response.reason}")
            conn.close()
        except Exception as e:
            logger.error(f"Error sending log to OpenObserve: {str(e)}")
            raise
Step 3: Configure S3 Events
Once the CUR is set up, AWS will periodically deliver reports to the configured S3 bucket. To trigger ingestion into OpenObserve, configure S3 events:
- Go to the S3 bucket where CUR is stored.
- Click on the Properties tab.
- Scroll to Event Notifications and select Create Event Notification.
- Enter a name and choose All object create events.
- Select Send to Lambda Function and choose the function that will ingest logs into OpenObserve.
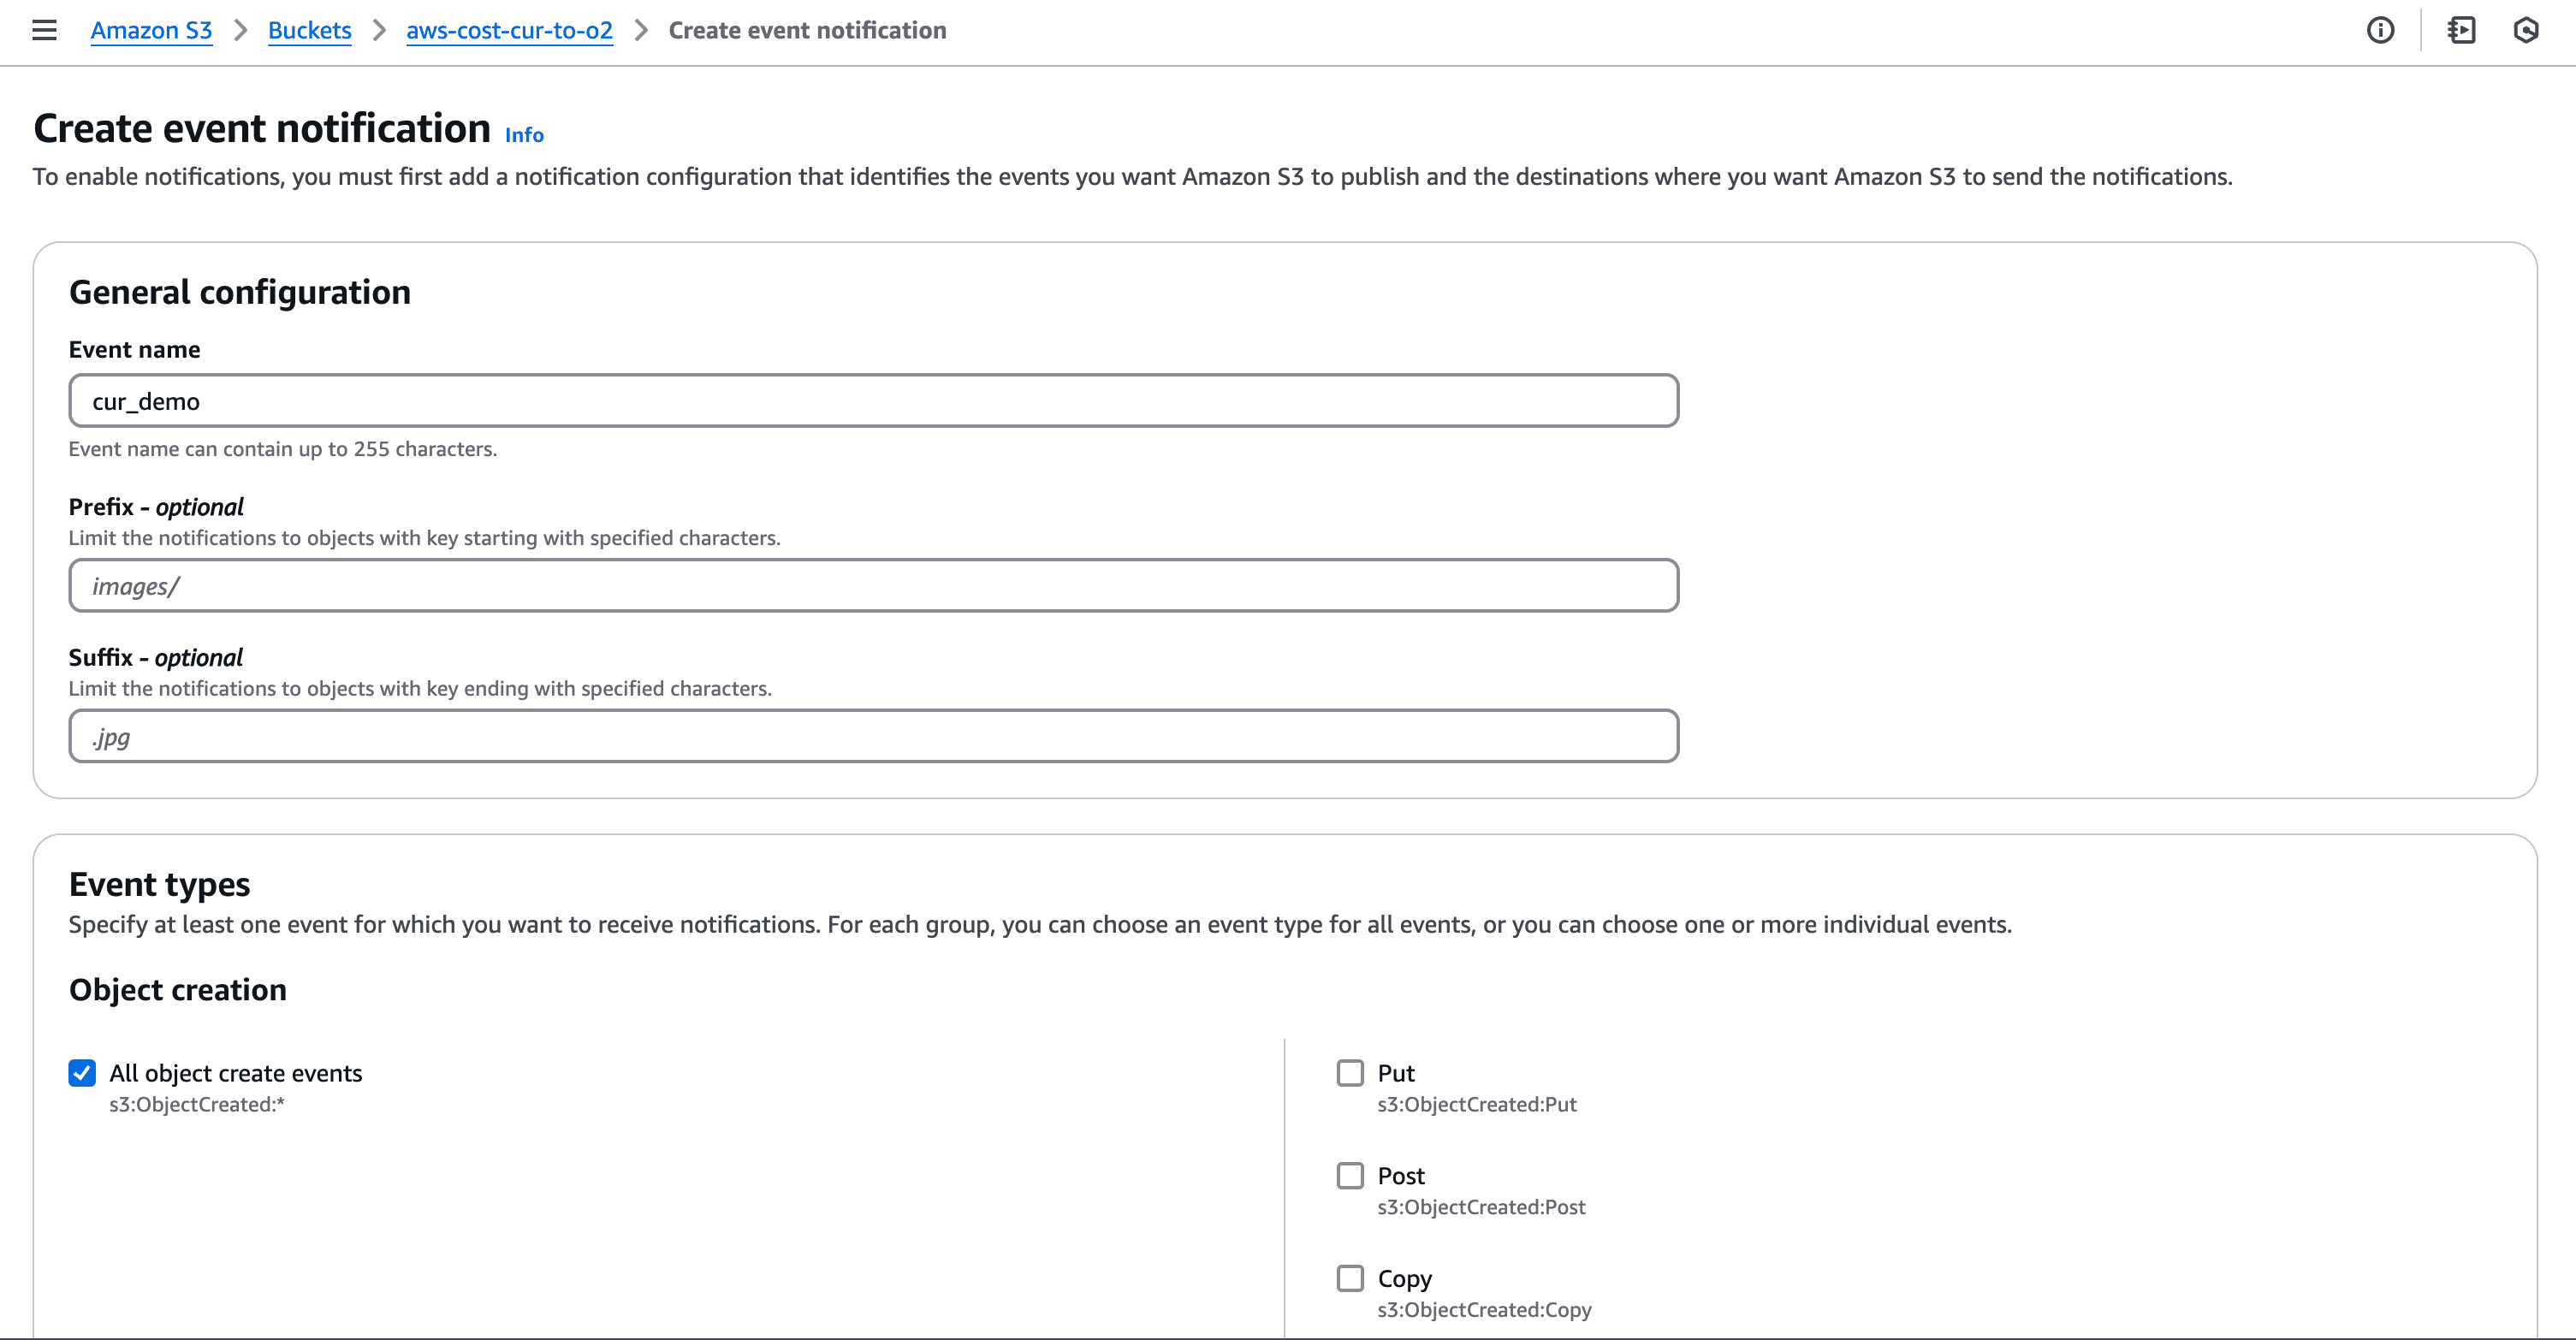
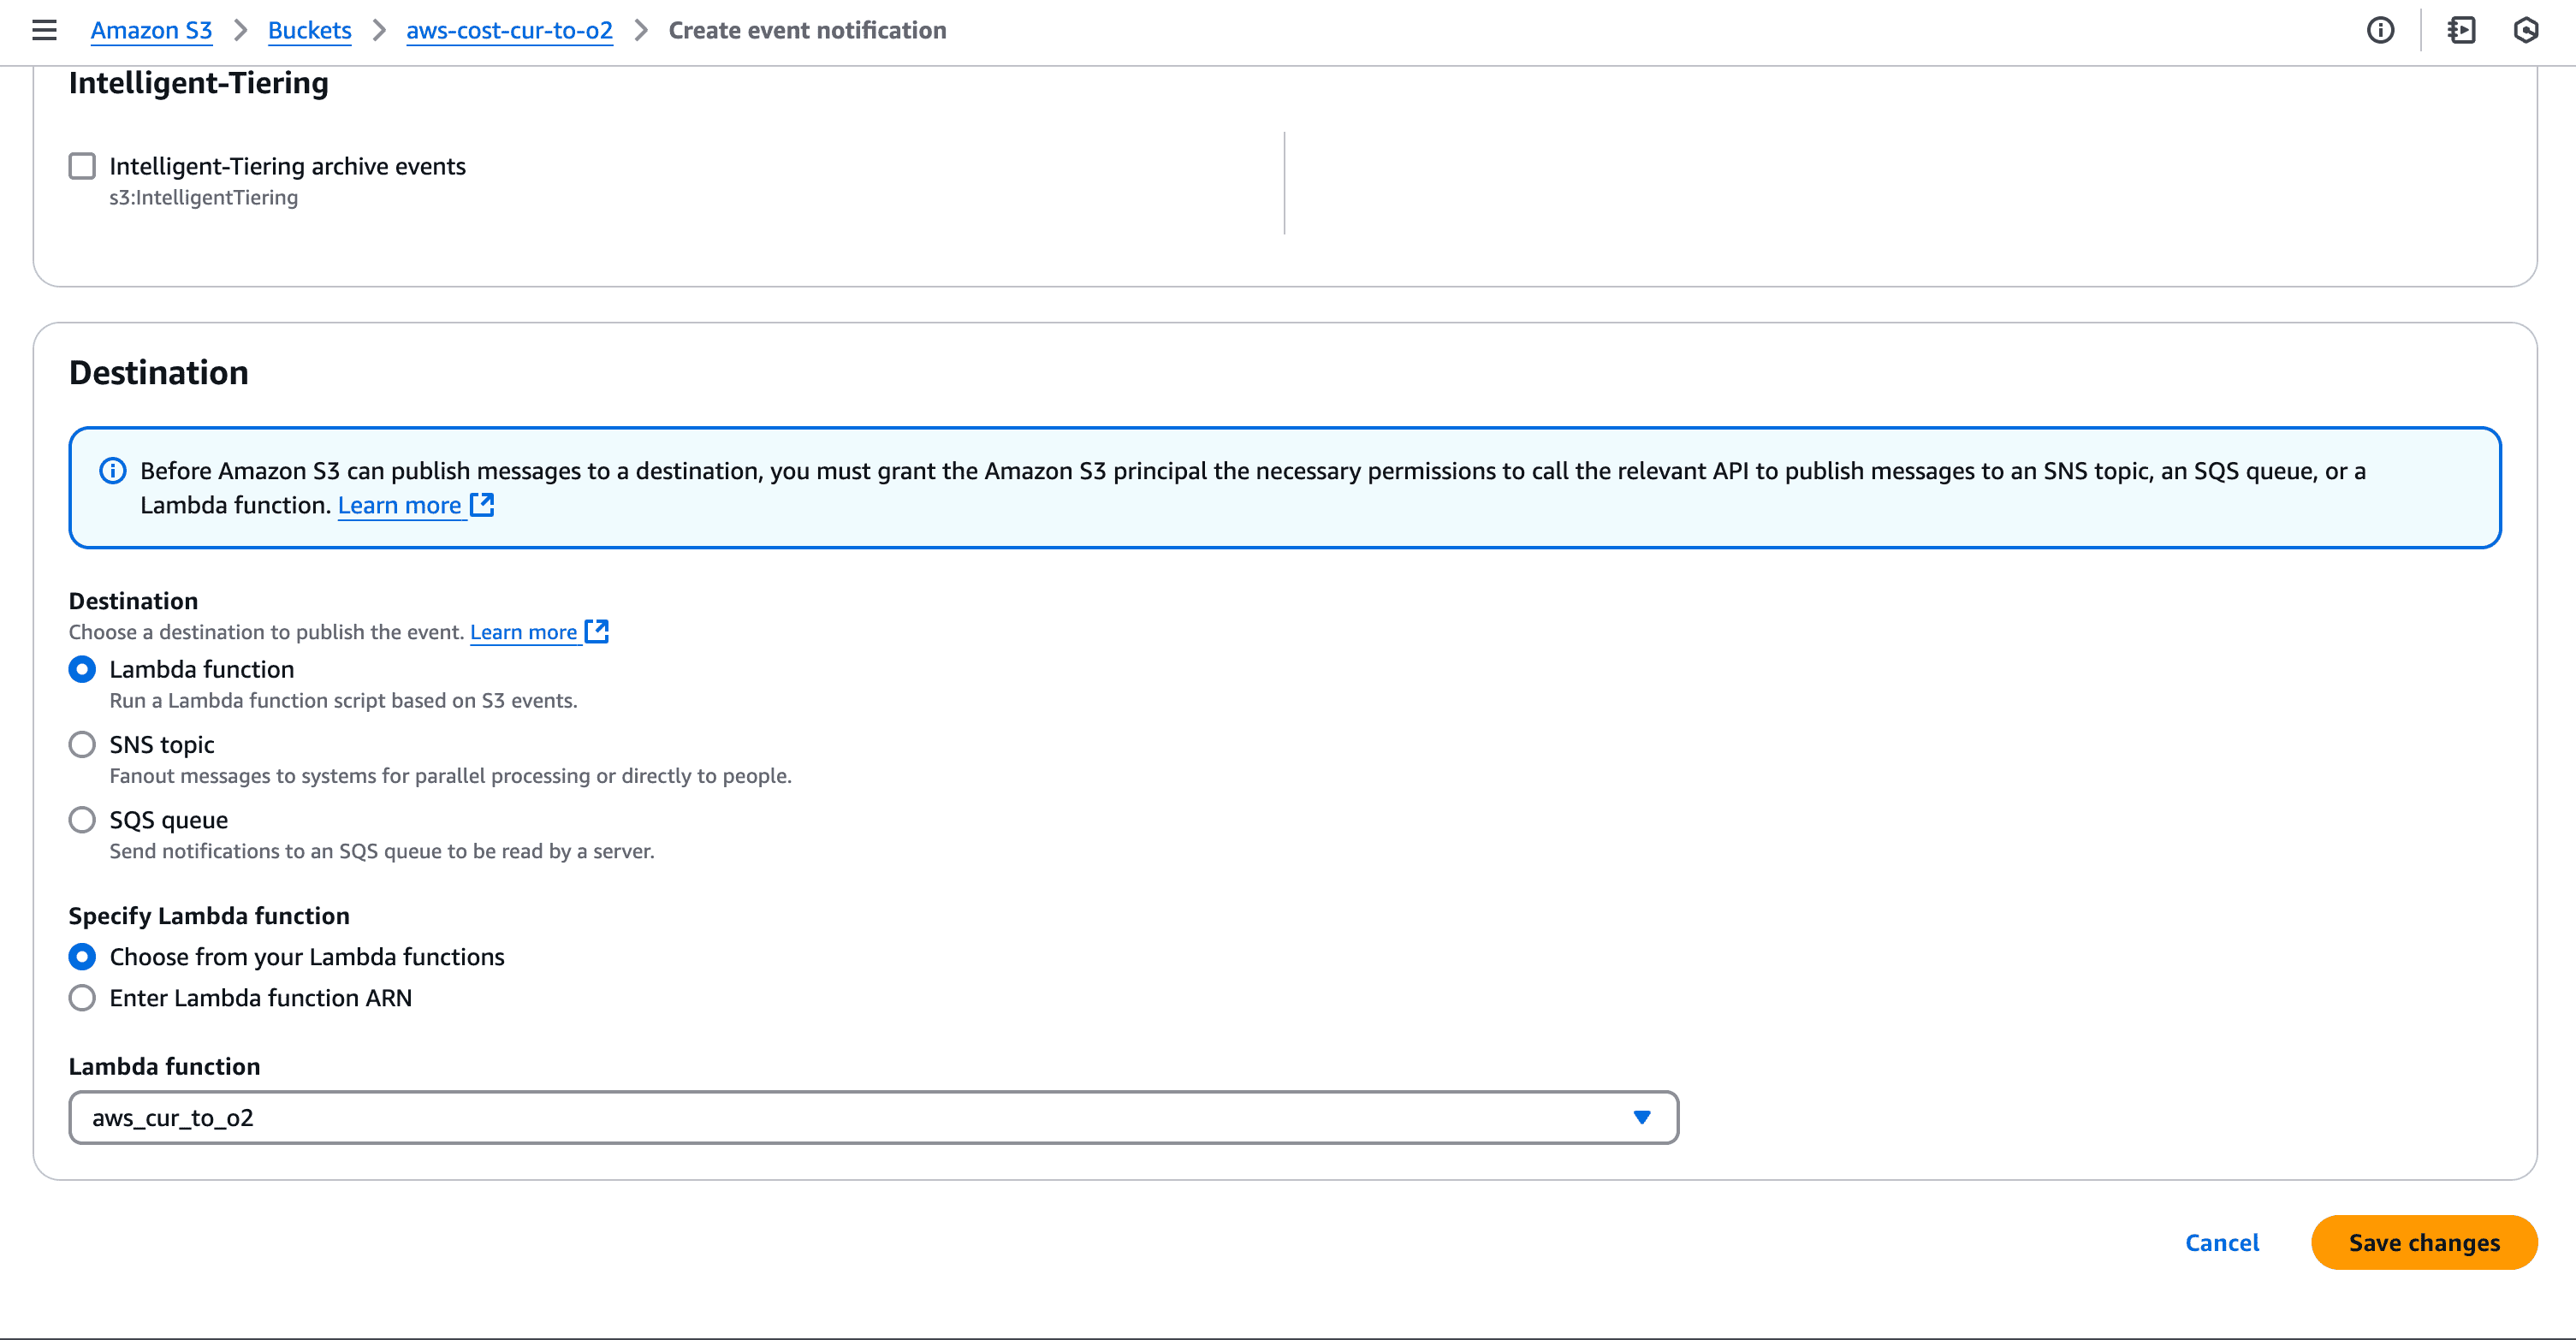
- Save changes.
Step 4: Configure IAM Policies
The Lambda function requires permissions to read from S3 and write to OpenObserve. Attach the following IAM policy:
{
    "Version": "2012-10-17",
    "Statement": [
        {
            "Effect": "Allow",
            "Action": "logs:CreateLogGroup",
            "Resource": "arn:aws:logs:<AWS_REGION>:<AWS_ACCOUNT_ID>:*"
        },
        {
            "Effect": "Allow",
            "Action": ["logs:CreateLogStream", "logs:PutLogEvents"],
            "Resource": ["arn:aws:logs:<AWS_REGION>1:<AWS_ACCOUNT_ID>:log-group:/aws/lambda/<LAMBDA_FUNCTION_NAME>:*"]
        },
        {
            "Effect": "Allow",
            "Action": ["s3:GetObject", "s3:ListBucket"],
            "Resource": ["arn:aws:s3:::<S3_BUCKET>", "arn:aws:s3:::<S3_BUCKET>/*"]
        }
    ]
}
Important Note on Data Ingestion Timing
By default, OpenObserve allows ingestion of data that is up to 5 hours old. If you need to ingest data older than this, set the ZO_INGEST_ALLOWED_UPTO environment variable with a value measured in days (e.g., ZO_INGEST_ALLOWED_UPTO=30 for 30 days). However, historical ingestion is not recommended as it may lead to inconsistencies in real-time analysis.
Step 5: Analyze Logs in OpenObserve
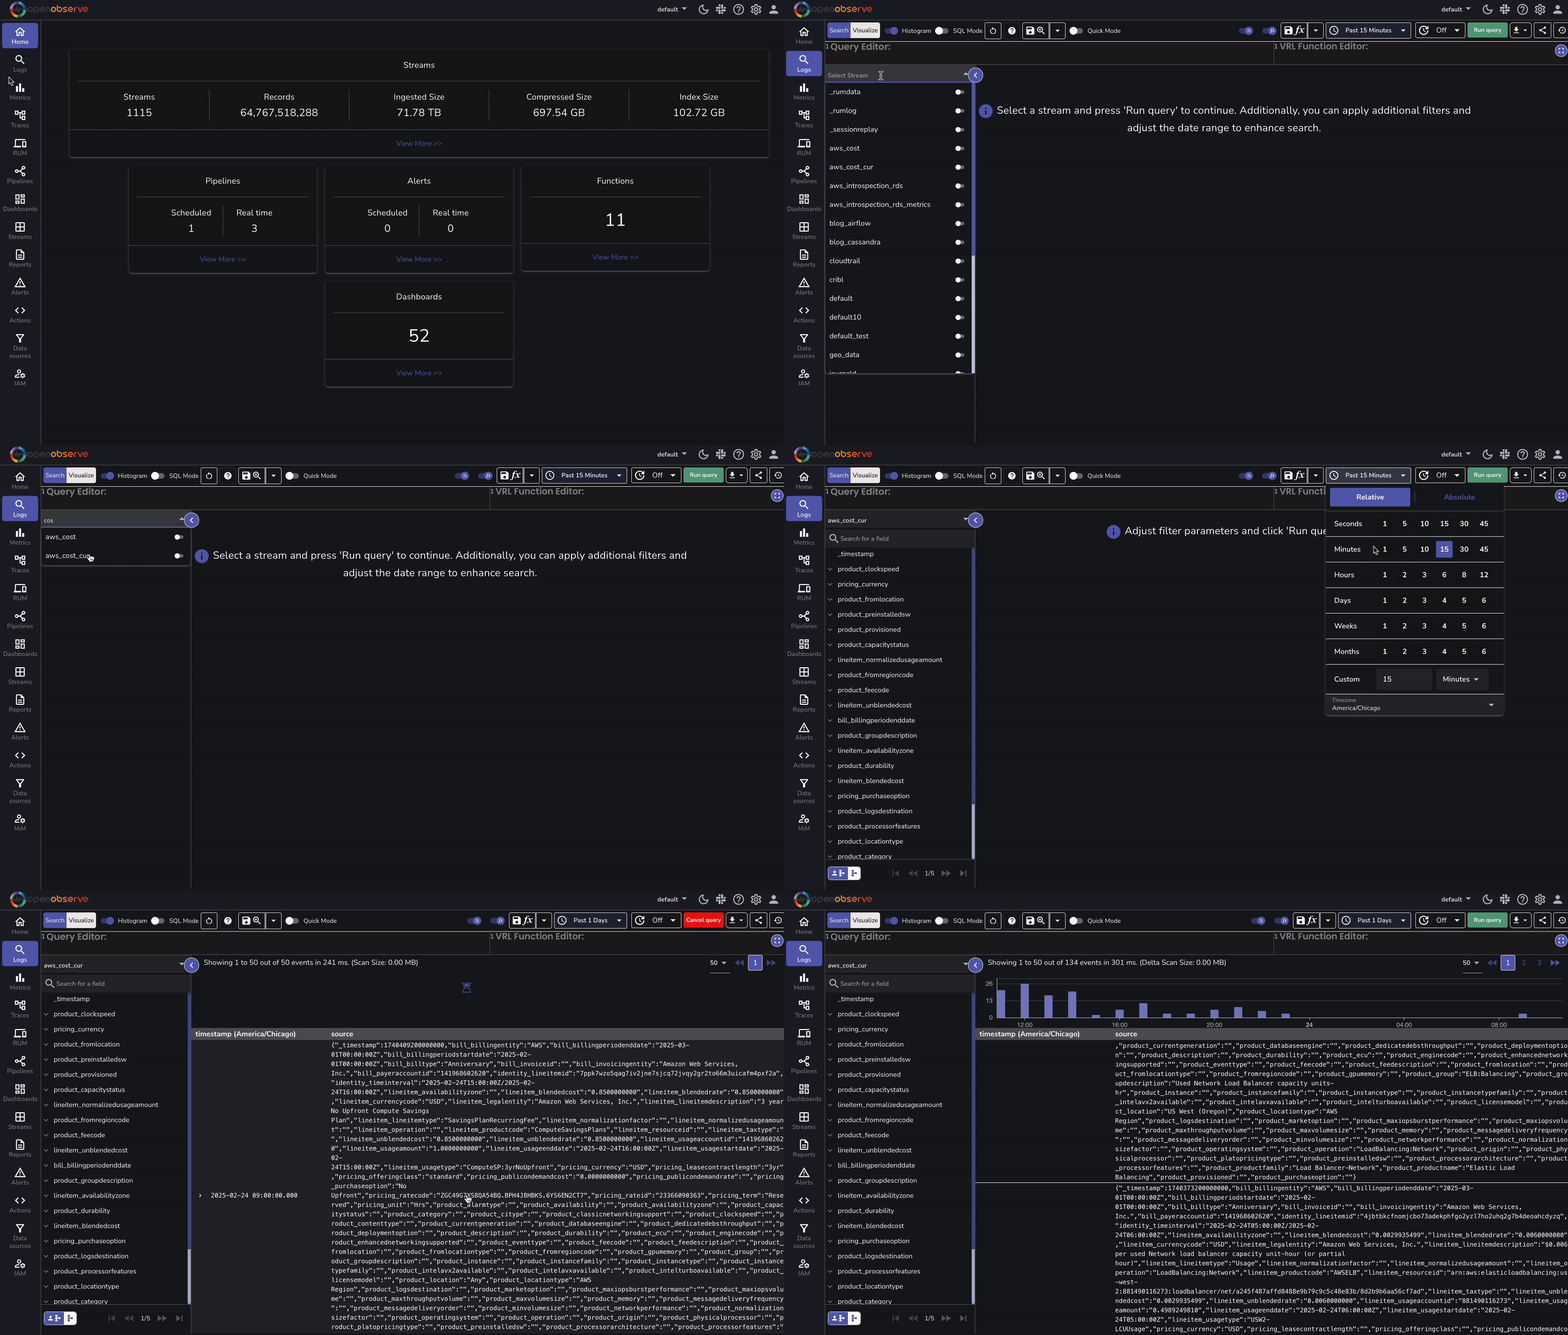
Once AWS CUR logs are ingested, use OpenObserve to analyze cost and utilization trends:
- Navigate to your OpenObserve Dashboard.
- Open the Logs Explorer.
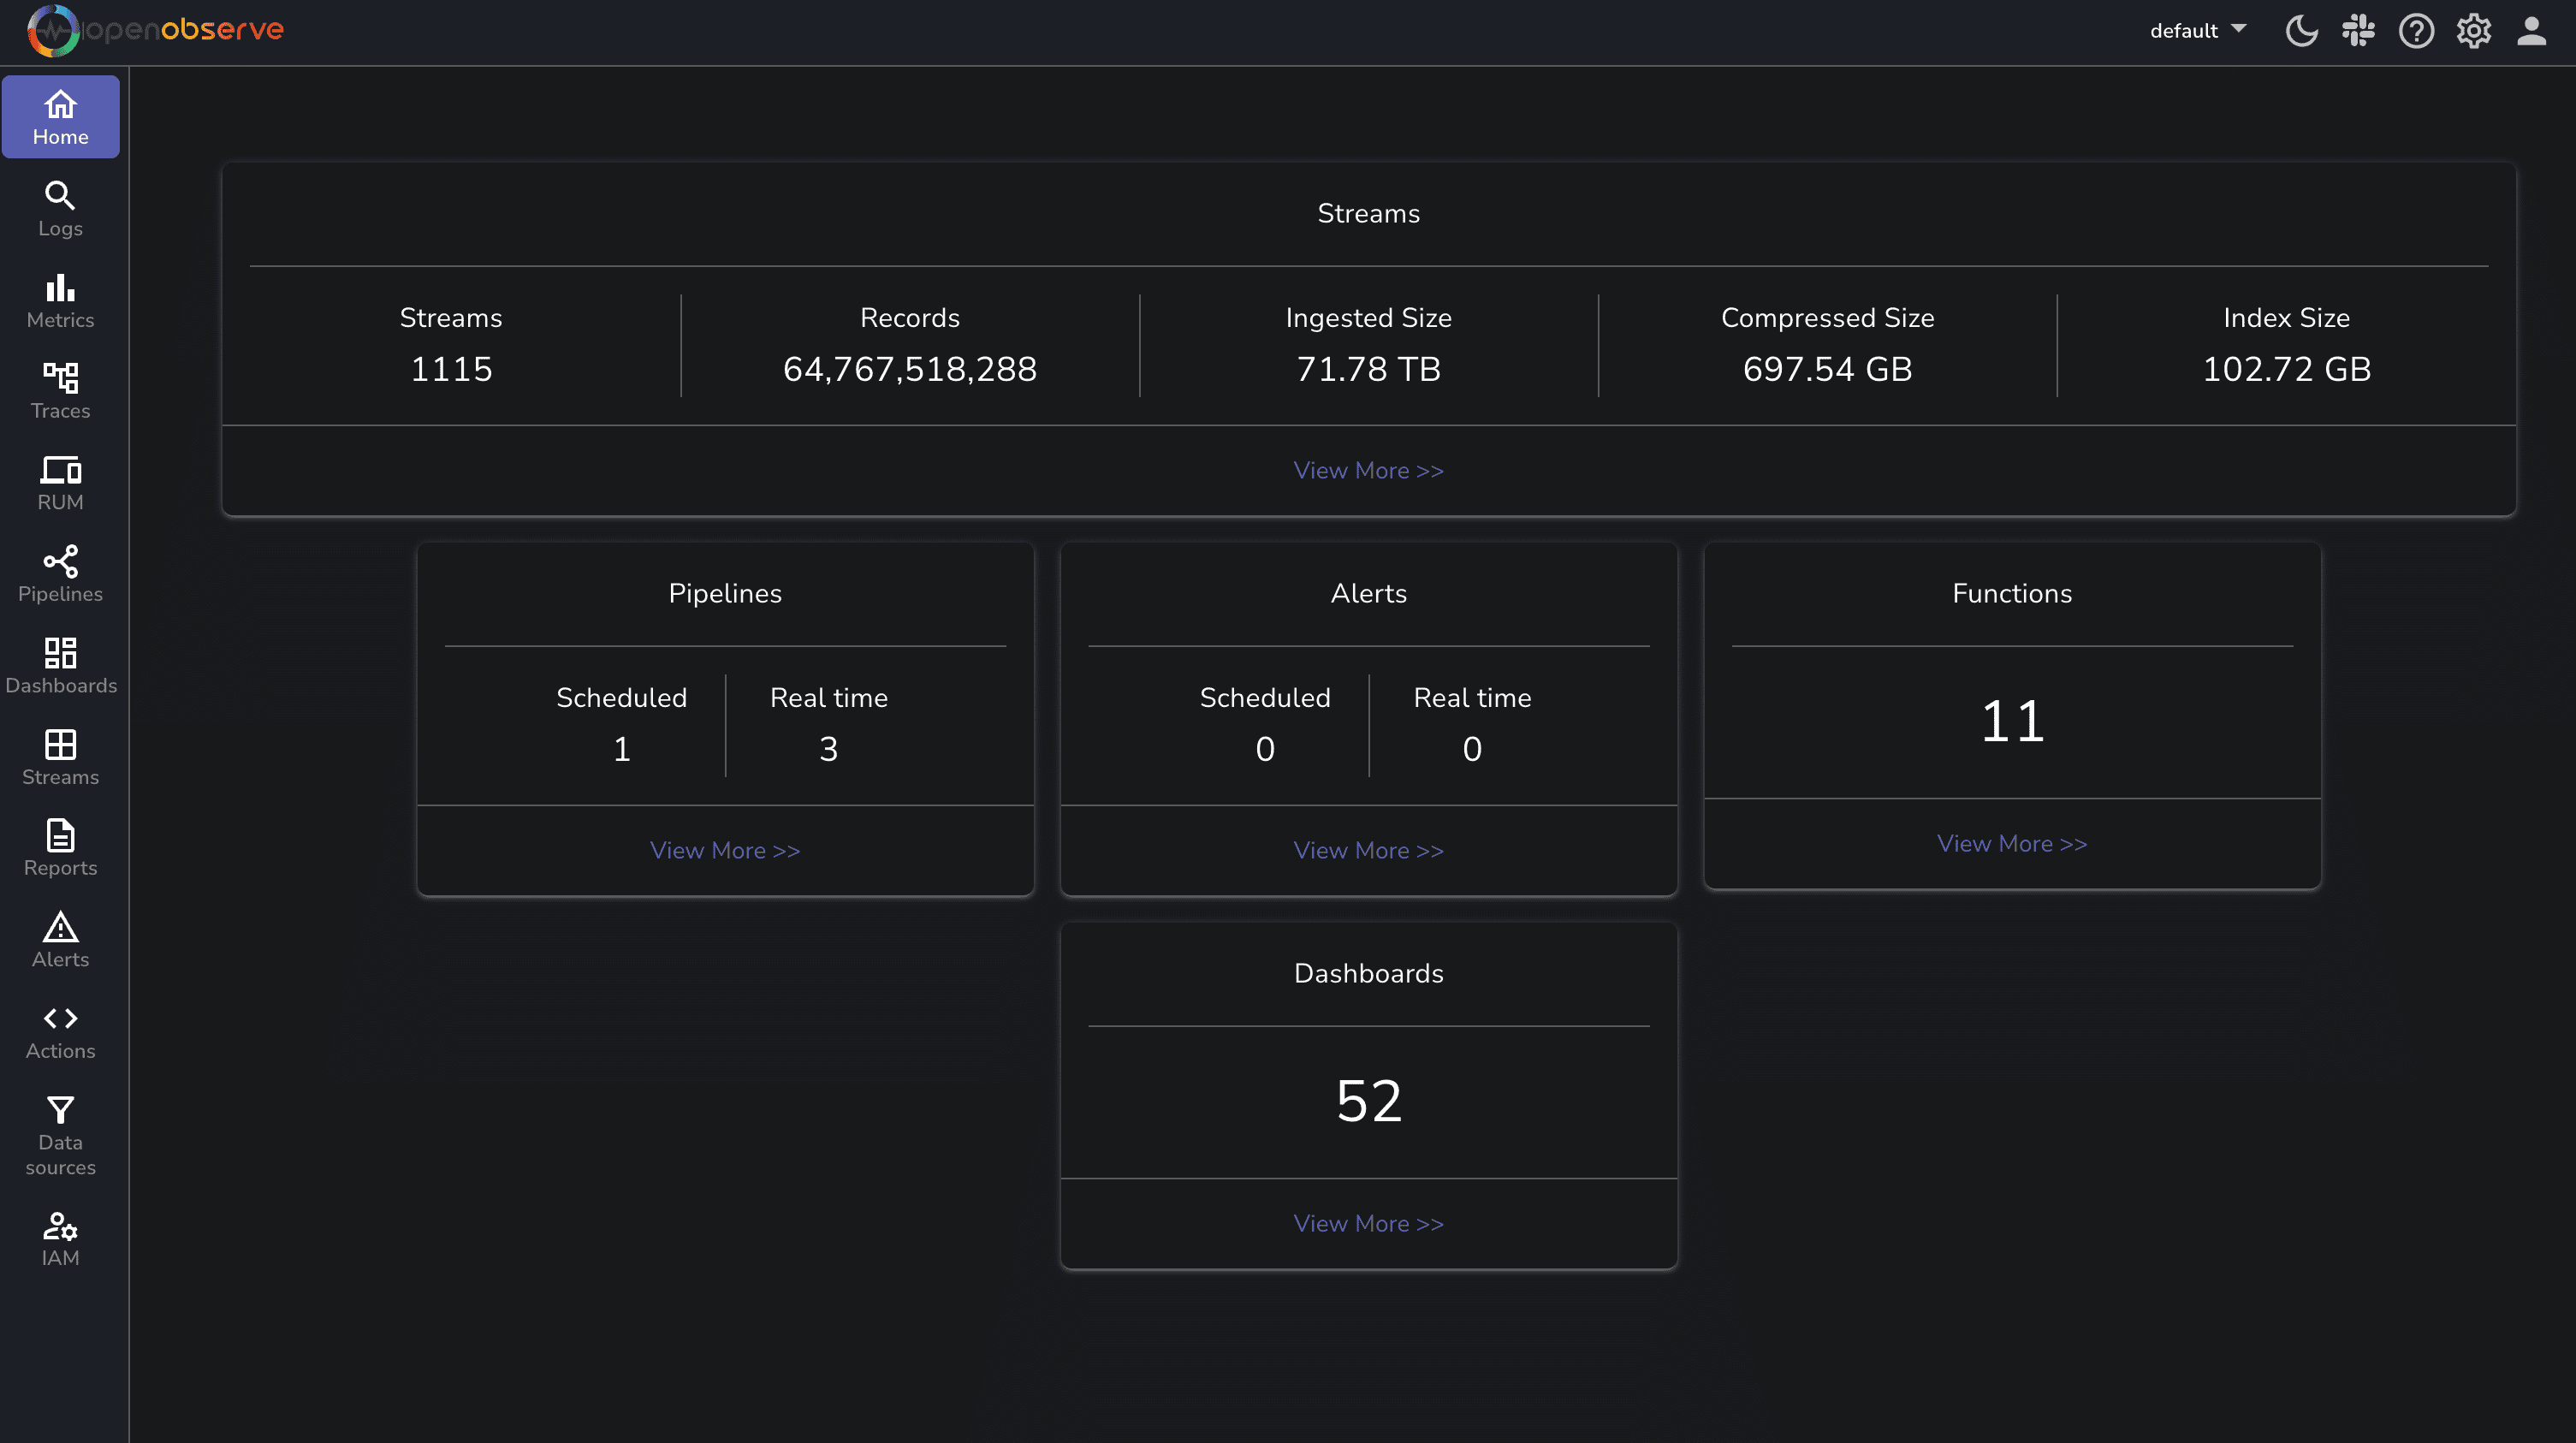
- Use queries to filter cost and usage data (e.g., lineitem_productcode = 'AmazonEC2').
- Visualize trends using time-series graphs.
Step 6: Import Predefined Dashboard
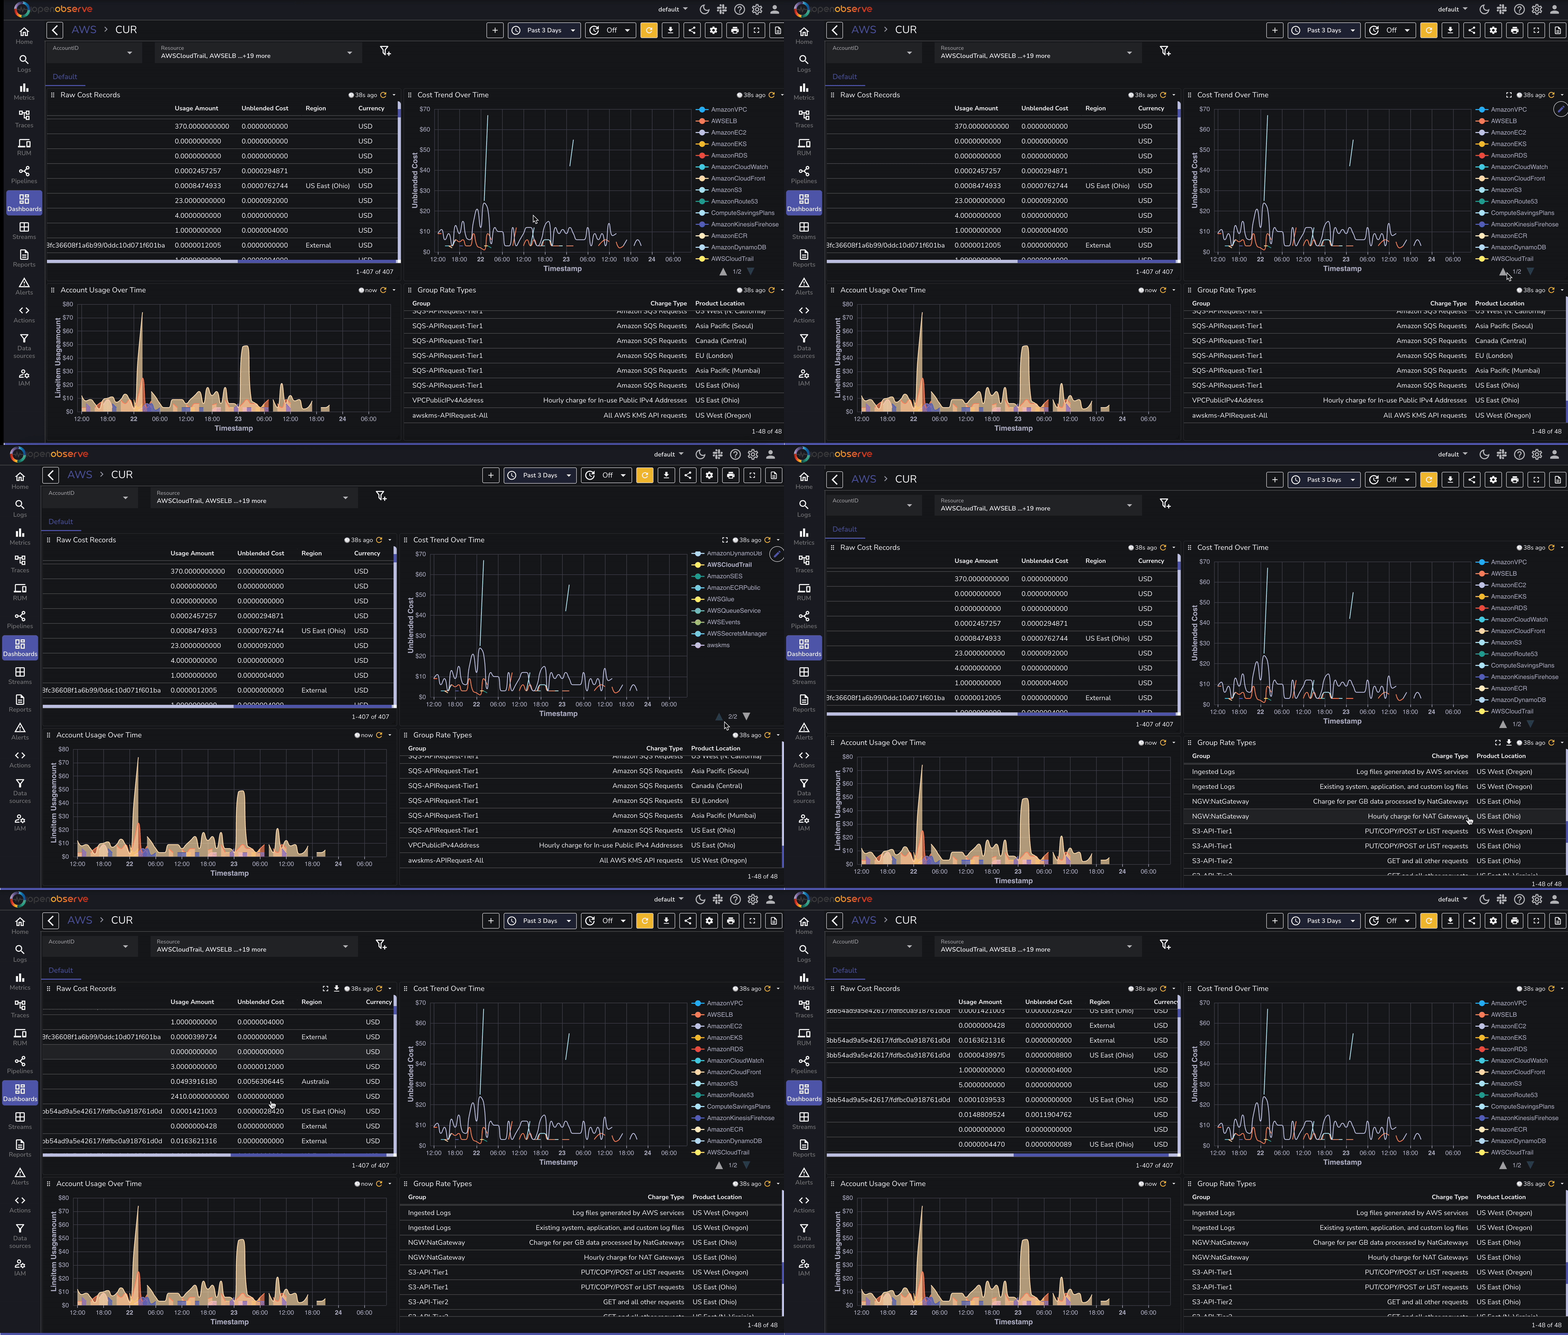
To speed up analysis, OpenObserve provides predefined dashboards for AWS cost analysis:
- Navigate to Dashboards in OpenObserve.
- Download the dashboard
- Replace aws_cost_cur with the stream name that you have created in OpenObserve as part of the lambda function.
- Click Import Dashboard.
- Analyze cost distribution, top services by cost, and trends.
Comparison: With vs. Without OpenObserve
| Feature | Without OpenObserve | With OpenObserve |
|---|---|---|
| Data Analysis | Manual S3 Querying | Real-time search & filters |
| Dashboards | Limited | Prebuilt & Customizable |
| Alerts on Cost Spikes | Limited | Yes, granular |
| Historical Cost Data Trends | Complex via Athena | Simple & visual |
| Multi-Account Cost Monitoring | Manual Consolidation | Automatic & Scalable |
Using OpenObserve significantly improves AWS cost analysis efficiency by providing real-time search, dashboards, and alerting capabilities. Implement this setup today to optimize your cloud spending!
Conclusion
By integrating AWS Cost and Usage Reports with OpenObserve, you can gain deeper insights into your AWS spending patterns. This setup enables automated log ingestion, efficient analysis, and cost-optimization strategies.
About the Author
Chaitanya Sistla

Chaitanya Sistla is a Principal Solutions Architect with 17X certifications across Cloud, Data, DevOps, and Cybersecurity. Leveraging extensive startup experience and a focus on MLOps, Chaitanya excels at designing scalable, innovative solutions that drive operational excellence and business transformation.
Follow OpenObserve on Google
Add OpenObserve as a preferred source to see more of our articles in Google Search and Top Stories.












