Docker Container Monitoring with OpenTelemetry and OpenObserve

Manas Sharma
April 03, 2025
9 min read
Don’t forget to share!
Try OpenObserve Cloud today for more efficient and performant observability.
Get Started For Free
Docker containers have revolutionized application deployment by providing consistent, isolated environments for running applications. However, as containerized applications grow in complexity, monitoring these containers becomes crucial for ensuring optimal performance, resource utilization, and troubleshooting issues.
In this comprehensive guide, we'll explore how to monitor Docker container metrics using OpenTelemetry and visualize them in OpenObserve. We'll leverage the Docker Stats Receiver from the OpenTelemetry Collector Contrib distribution to collect detailed metrics from your Docker containers without modifying your applications.
Docker containers share the host system's resources, making it essential to monitor their resource consumption. Key metrics to track include:
Monitoring these metrics helps identify resource bottlenecks, optimize container performance, and ensure efficient resource allocation across your containerized applications.
The Docker Stats Receiver is a component of the OpenTelemetry Collector Contrib distribution that queries the local Docker daemon's container stats API for all running containers at a configured interval. It collects comprehensive metrics about container resource usage.
Note: The Docker Stats Receiver requires Docker API version 1.25+ and is primarily supported on Linux systems. While it can work on macOS with Docker Desktop, you might need to adjust the Docker socket path.
The Docker Stats Receiver collects several metrics by default, including:
| Metric | Description | Metric Type | Value Type |
|---|---|---|---|
container.cpu.usage.total |
Total CPU time consumed | Sum | Int |
container.cpu.usage.kernelmode |
CPU time in kernel mode | Sum | Int |
container.cpu.usage.usermode |
CPU time in user mode | Sum | Int |
container.cpu.utilization |
Percentage of CPU used by the container | Gauge | Double |
container.memory.usage.total |
Memory usage of the container (excluding cache) | Sum | Int |
container.memory.usage.limit |
Memory limit of the container | Sum | Int |
container.memory.percent |
Percentage of memory used | Gauge | Double |
container.network.io.usage.rx_bytes |
Bytes received by the container | Sum | Int |
container.network.io.usage.tx_bytes |
Bytes sent by the container | Sum | Int |
container.network.io.usage.rx_dropped |
Incoming packets dropped | Sum | Int |
container.network.io.usage.tx_dropped |
Outgoing packets dropped | Sum | Int |
container.blockio.io_service_bytes_recursive |
Number of bytes transferred to/from disk | Sum | Int |
Additional metrics that can be enabled include:
| Metric | Description | Enabled by Default |
|---|---|---|
container.cpu.usage.percpu |
CPU usage per CPU core | No |
container.pids.count |
Number of processes running in the container | No |
container.uptime |
Container uptime in seconds | No |
container.restarts |
Number of container restarts | No |
container.network.io.usage.rx_errors |
Receive errors | No |
container.network.io.usage.tx_errors |
Transmit errors | No |
container.network.io.usage.rx_packets |
Packets received | No |
container.network.io.usage.tx_packets |
Packets transmitted | No |
Before we begin setting up Docker container monitoring, ensure you have:
Docker installed and running on your system
Access to an OpenObserve instance (cloud or self-hosted)
Basic understanding of OpenTelemetry concepts
First, let's verify that you have Docker containers running on your system that we can monitor:
docker ps
This command will list all running containers. If you don't have any containers running, you can start some with:
# Start an Nginx web server
docker run -d --name nginx-test -p 8080:80 nginx:latest

# Start a MySQL database
docker run -d --name mysql-test -e MYSQL_ROOT_PASSWORD=mysecretpassword -p 3306:3306 mysql:latest
We'll use the OpenTelemetry Collector Contrib distribution as it includes the Docker Stats Receiver.
Visit the OpenTelemetry Collector Contrib Releases page.
Download the latest release for your machine. For macOS with Apple Silicon, use:
curl --proto '=https' --tlsv1.2 -fOL https://github.com/open-telemetry/opentelemetry-collector-releases/releases/download/v0.116.0/otelcol-contrib_0.116.0_darwin_arm64.tar.gz
tar -xvf otelcol-contrib_0.116.0_darwin_arm64.tar.gz
sudo mv otelcol-contrib /usr/local/bin/
otelcol-contrib --version
The Docker Stats Receiver needs to connect to the Docker daemon through a socket. The socket path varies depending on your operating system:
For Linux:
ls -la /var/run/docker.sock
For macOS with Docker Desktop:
# Check the standard Linux path (sometimes works with Docker Desktop)
ls -la /var/run/docker.sock

# If that doesn't exist, check these common locations
ls -la ~/Library/Containers/com.docker.docker/Data/docker.sock
ls -la ~/.docker/run/docker.sock
Note: On macOS,
/var/run/docker.sockis often a symbolic link to the actual socket location. You can follow this link to find the actual path.
Create a configuration file named config.yaml with the following content:
receivers:
  otlp:
    protocols:
      grpc:
      http:
  docker_stats:
    endpoint: unix:///var/run/docker.sock  # Adjust this path based on your system
    collection_interval: 30s
    timeout: 10s
    api_version: "1.25"  # Note the quotes around the version number
    metrics:
      container.uptime:
        enabled: true
      container.restarts:
        enabled: true
      container.network.io.usage.rx_errors:
        enabled: true
      container.network.io.usage.tx_errors:
        enabled: true
      container.network.io.usage.rx_packets:
        enabled: true
      container.network.io.usage.tx_packets:
        enabled: true
      container.cpu.usage.percpu:
        enabled: true
      container.pids.count:
        enabled: true

processors:
  batch:
    send_batch_size: 1000
    timeout: 10s
  resourcedetection/system:
    detectors: ["system"]
    system:
      hostname_sources: ["dns", "os"]
  resourcedetection/docker:
    detectors: [env, docker]
    timeout: 2s
    override: false

exporters:
  otlphttp/openobserve:
    endpoint: http://localhost:5080/api/default  # Replace with your OpenObserve endpoint
    headers:
      Authorization: Basic YOUR_AUTH_TOKEN  # Replace with your OpenObserve auth token
      stream-name: default
  debug:
    verbosity: detailed

service:
  telemetry:
    logs:
      level: debug
  pipelines:
    metrics:
      receivers: [otlp, docker_stats]
      processors: [resourcedetection/docker, resourcedetection/system, batch]
      exporters: [otlphttp/openobserve, debug]
- Replace
unix:///var/run/docker.sockwith your actual Docker socket path.
- Replace
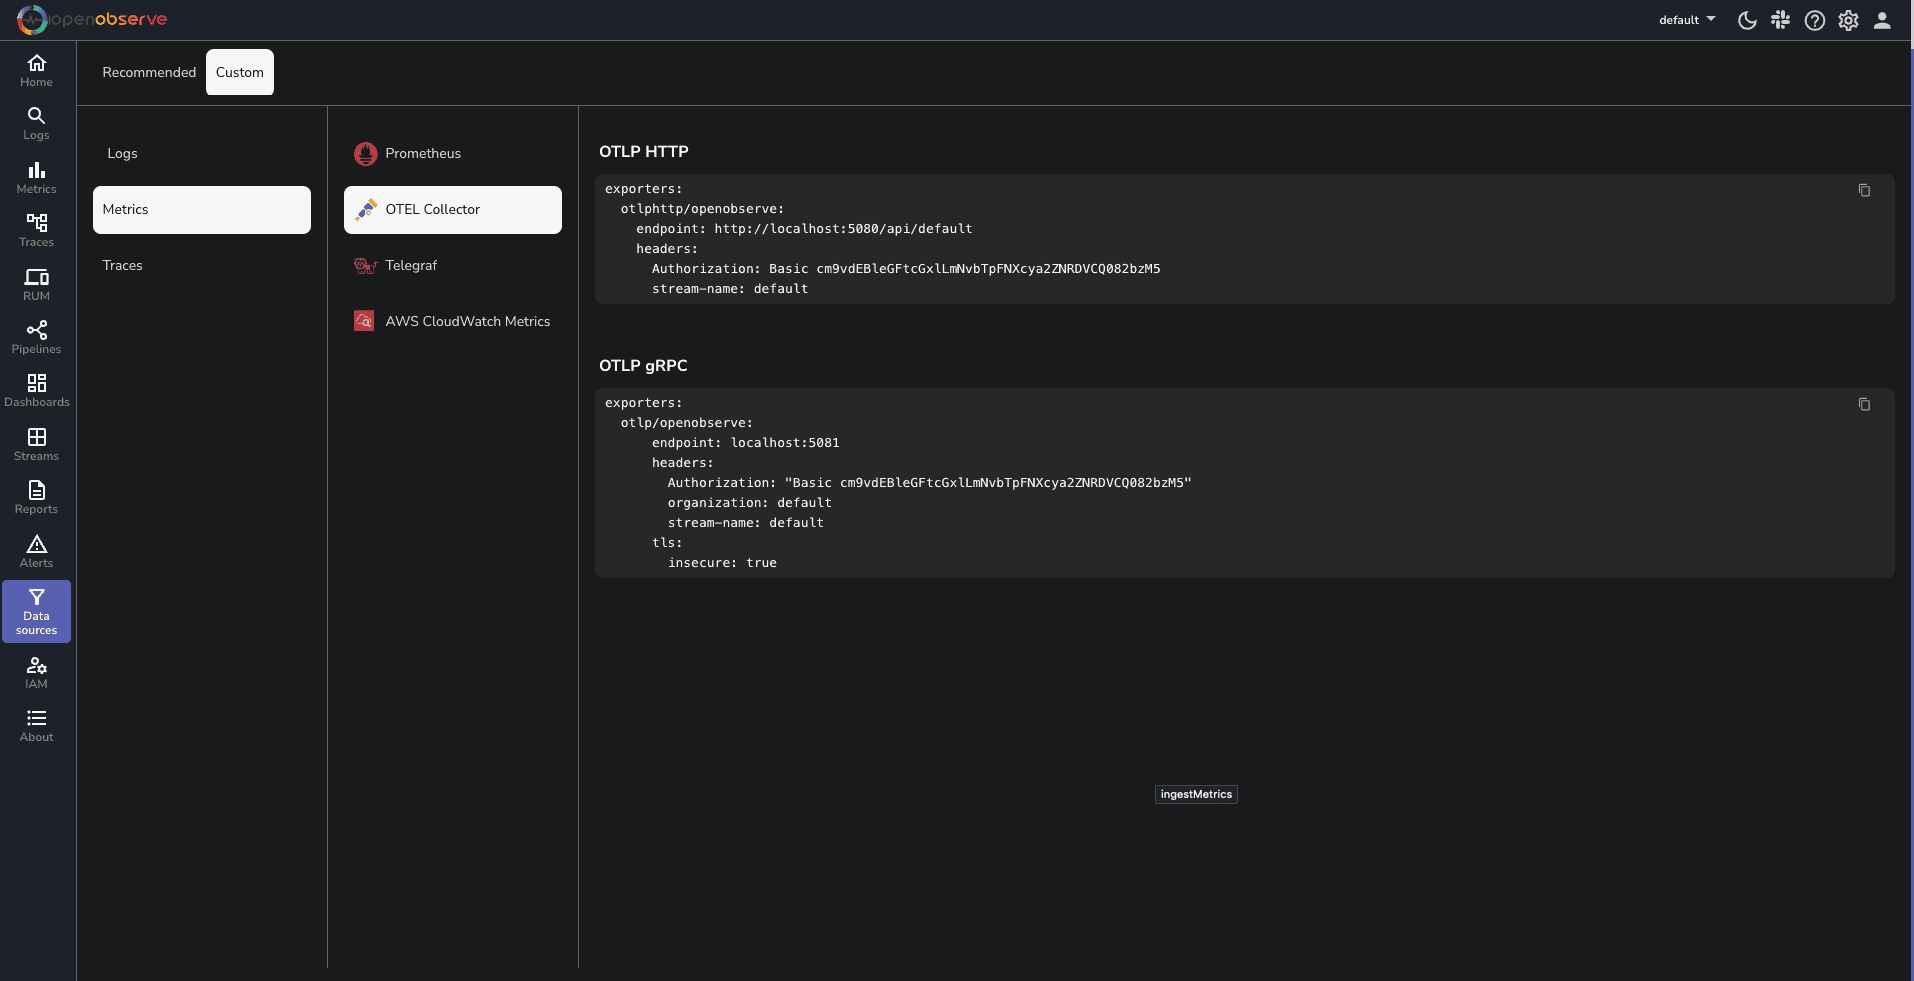
YOUR_API_ENDPOINTandYOUR_AUTH_TOKENwith your OpenObserve credentials, which you can find in your OpenObserve dashboard under Data Sources -> Custom -> Metrics -> Otel Collector.
To run the OpenTelemetry Collector with the specified configuration, execute the following command:
otelcol-contrib --config config.yaml
You should see logs indicating that the collector has started and is collecting metrics from Docker containers. The metrics will begin flowing into your OpenObserve instance within a few seconds.
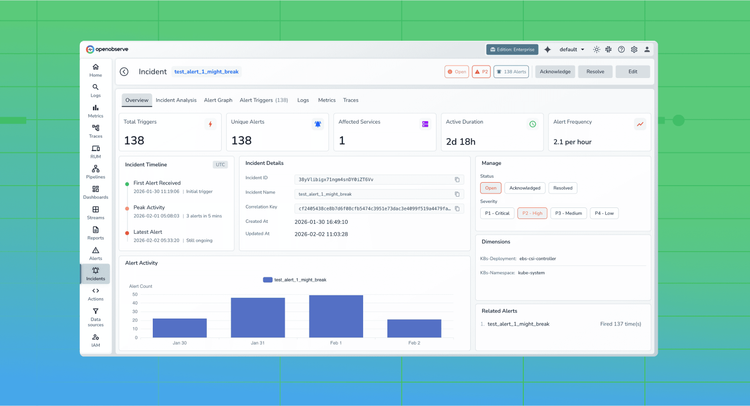
Navigate to the Metrics section in your OpenObserve dashboard to see the incoming Docker container metrics. You'll be able to see metrics like CPU utilization, memory usage, network I/O, and disk operations for all your monitored containers.
To make monitoring easier, we've created a comprehensive Docker Container Metrics dashboard that you can import directly into your OpenObserve instance. This dashboard provides visualizations for all the key Docker metrics.
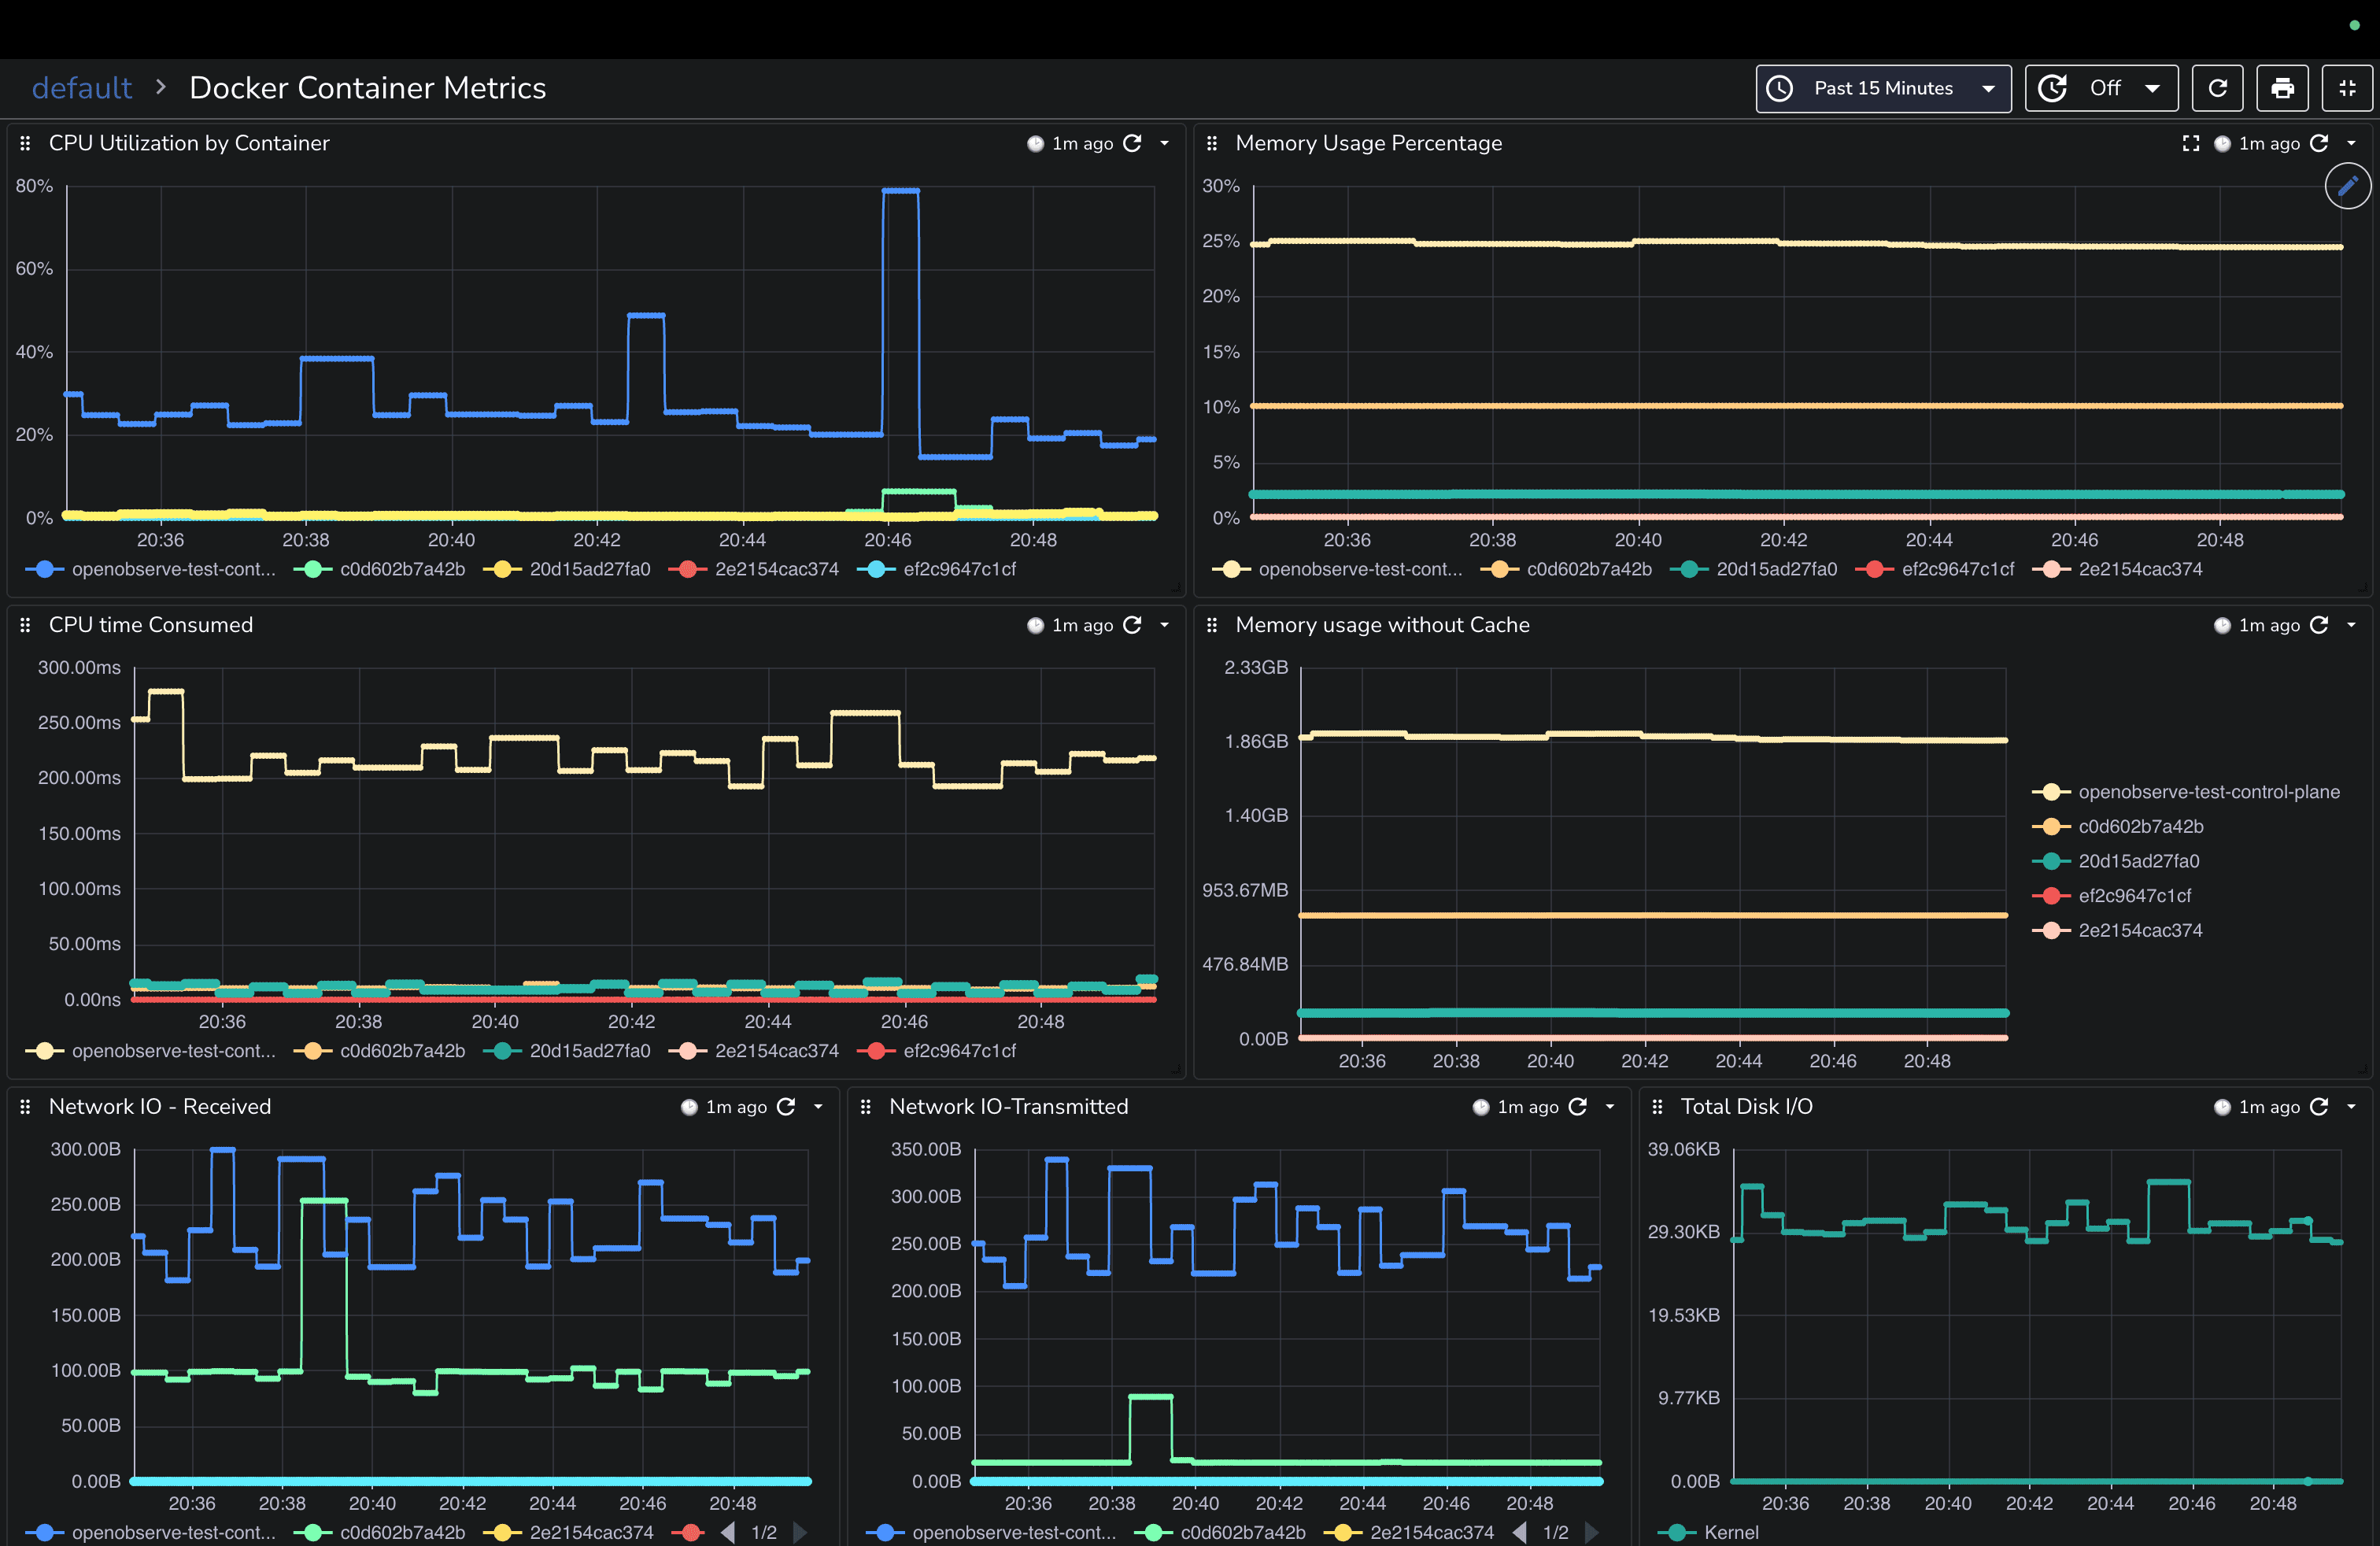
You can download this pre-built dashboard from our community dashboards repository and import it into your OpenObserve instance for instant visibility into your Docker container performance without having to build visualizations from scratch.
You might not want to monitor all containers. The Docker Stats Receiver allows you to exclude specific containers using the excluded_images configuration:
docker_stats:
  # ... other settings
  excluded_images:
    - undesired-container
    - /.*undesired.*/
    - another-*-container
This configuration:
You can map Docker container labels to metric labels for better organization:
docker_stats:
  # ... other settings
  container_labels_to_metric_labels:
    com.docker.compose.service: service_name
    com.docker.compose.project: project_name
  env_vars_to_metric_labels:
    APP_ENV: environment
This maps:
com.docker.compose.service to a metric label called service_namecom.docker.compose.project to a metric label called project_nameAPP_ENV to a metric label called environmentIf you encounter issues with your Docker metrics collection, here are some quick fixes:
Docker Socket Access: Ensure the user running the collector has read permissions for the Docker socket.
API Version Compatibility: Verify your Docker API version with docker version --format '{{.Server.APIVersion}}' and adjust your configuration accordingly.
macOS Socket Path: On macOS, check the actual socket path with ls -la /var/run/docker.sock and follow any symbolic links.
Collector Logs: Examine the collector logs for error messages that might indicate configuration issues.
Monitoring Docker containers with OpenTelemetry and OpenObserve provides essential visibility into your containerized applications. By collecting metrics on CPU usage, memory consumption, network activity, and disk operations, you can quickly identify performance bottlenecks and resource constraints.
This guide has shown you how to set up a comprehensive Docker monitoring solution without modifying your applications or adding instrumentation. The Docker Stats Receiver from the OpenTelemetry Collector makes it easy to gather detailed performance data from all your containers.
Now that you have your Docker metrics flowing into OpenObserve, consider these next steps to enhance your monitoring capabilities:
Set Up Real-Time Alerts: Configure alerts in OpenObserve to notify you when containers exceed resource thresholds or experience issues. For example, you can create alerts for high CPU utilization or memory consumption.
Correlate with Application Metrics: Combine container metrics with application-level telemetry for a complete view of your system's performance.
Implement Log Collection: Add log collection to your monitoring setup to correlate metrics with log events for better troubleshooting.
For more information on Docker monitoring best practices, check out the Docker Stats Receiver Documentation and the OpenObserve Documentation.
Happy monitoring! 🚀
Manas is a passionate Dev and Cloud Advocate with a strong focus on cloud-native technologies, including observability, cloud, kubernetes, and opensource. building bridges between tech and community.