Azure Monitoring with Otel Collector and OpenObserve: Collect Logs & Metrics from Any Resource




Ready to get started?
Try OpenObserve Cloud today for more efficient and performant observability.
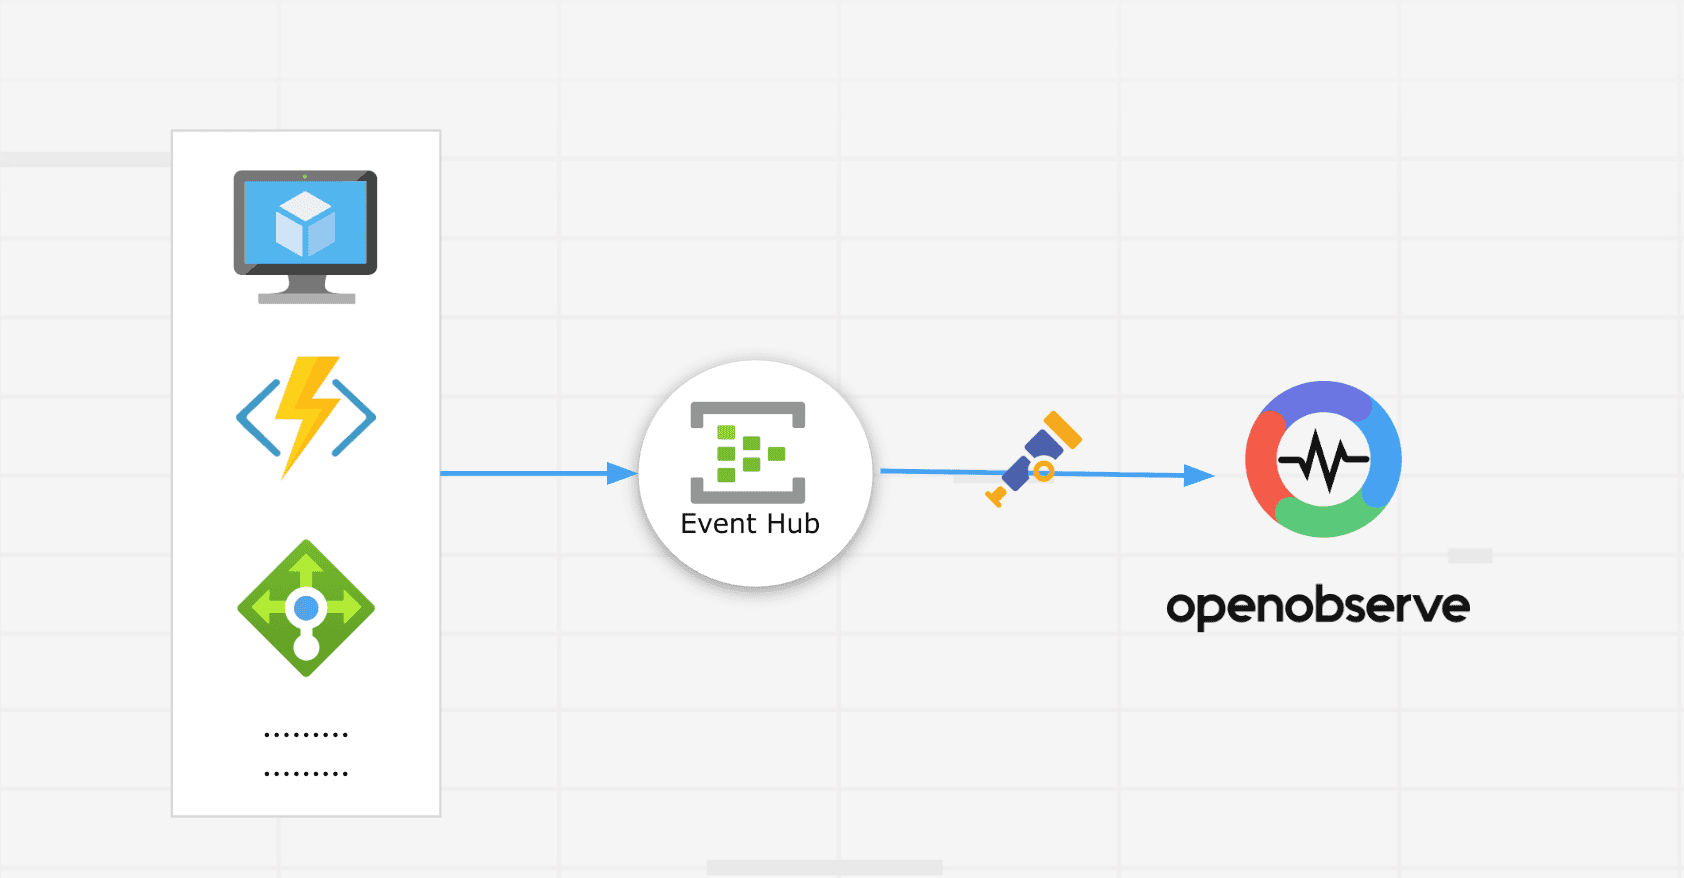
Cloud monitoring on Azure often feels fragmented. Every service exposes its own knobs- Activity Logs, Diagnostic Settings, Resource Logs, Metrics, Insights, Agent-based Logs, … and the moment you onboard 3-4 services, your pipeline becomes a mess.
But the truth is: All Azure resources can be monitored using one generic architecture.The only thing that changes is which logs/metrics each resource exposes.
This article breaks down that generic architecture, shows how Azure emits logs/metrics, and how you can collect all of them using Event Hub → OTel Azure EventHub Receiver → OpenObserve, without installing extra agents or writing glue code.
Why Azure Native Monitoring Isn’t Enough
Azure resources fail in ways the Portal doesn’t clearly show. A VM can look healthy while the disk is saturated, a database can throttle without any obvious warning, storage accounts quietly start returning 429s, and a single NSG rule change can break traffic with zero visibility.
Azure Monitor helps, but it’s split across multiple blades, varies by service, and gets expensive fast if you rely on Log Analytics for everything. What teams actually want is one place where all logs and metrics land in a consistent format.
The good news is that every Azure resource : VM, database, storage, load balancer, anything , already exposes its telemetry through the same Diagnostic Settings pipeline.
The Architecture (Works for Every Azure Resource)
You can configure the Diagnostic Setting to ensure Azure pushes required logs and metrics into an Event Hub, the OpenTelemetry Collector reads from that Event Hub using the azureeventhub receiver, and OpenObserve ingests everything through OTLP.
That’s it. No per-resource agents, no service-specific exporters, no custom hacks.
The pipeline looks like this:

Azure Resources & What Diagnostic Settings Expose
- VM: Platform Metrics (Host Metrics), Boot Diagnostics, Activity logs
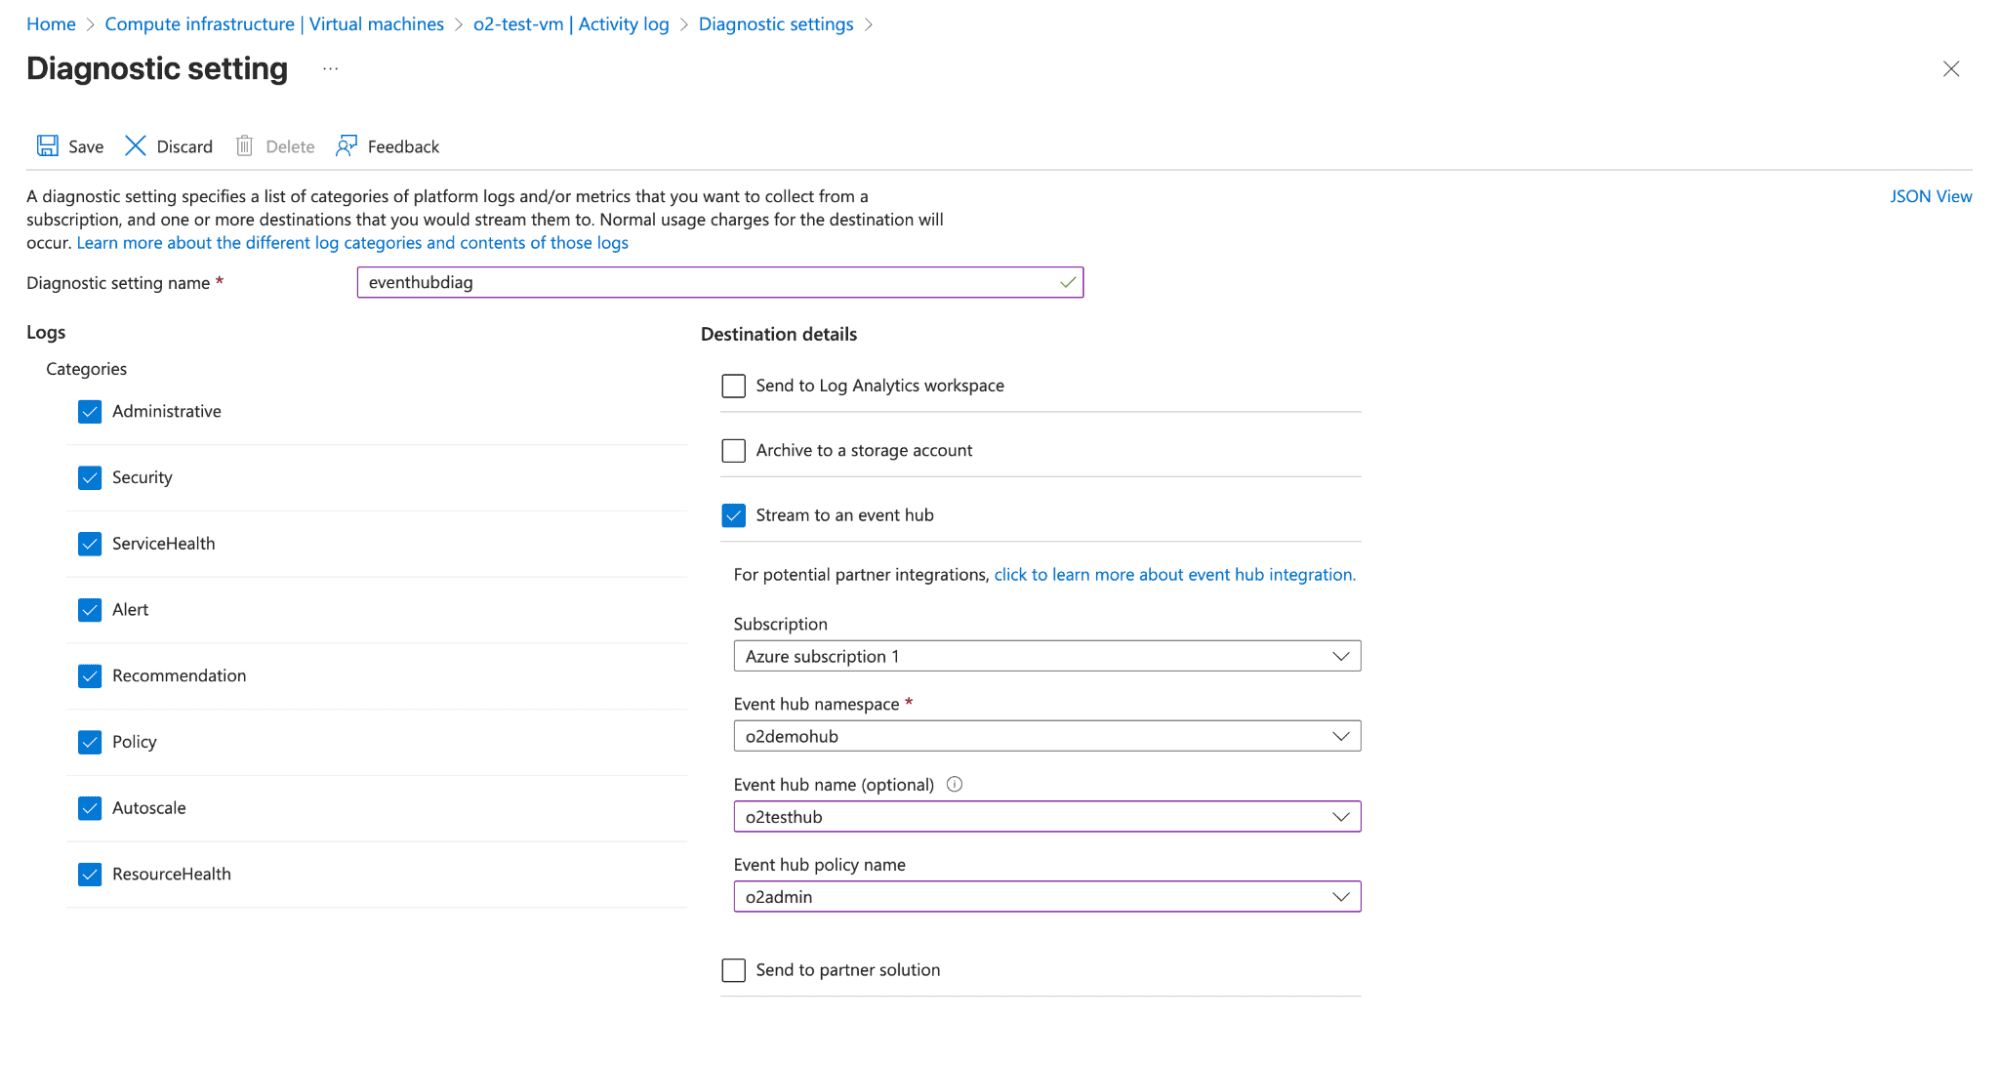
- PostgreSQL / MySQL / SQL DB: Query logs, error logs, connection stats, engine metrics.
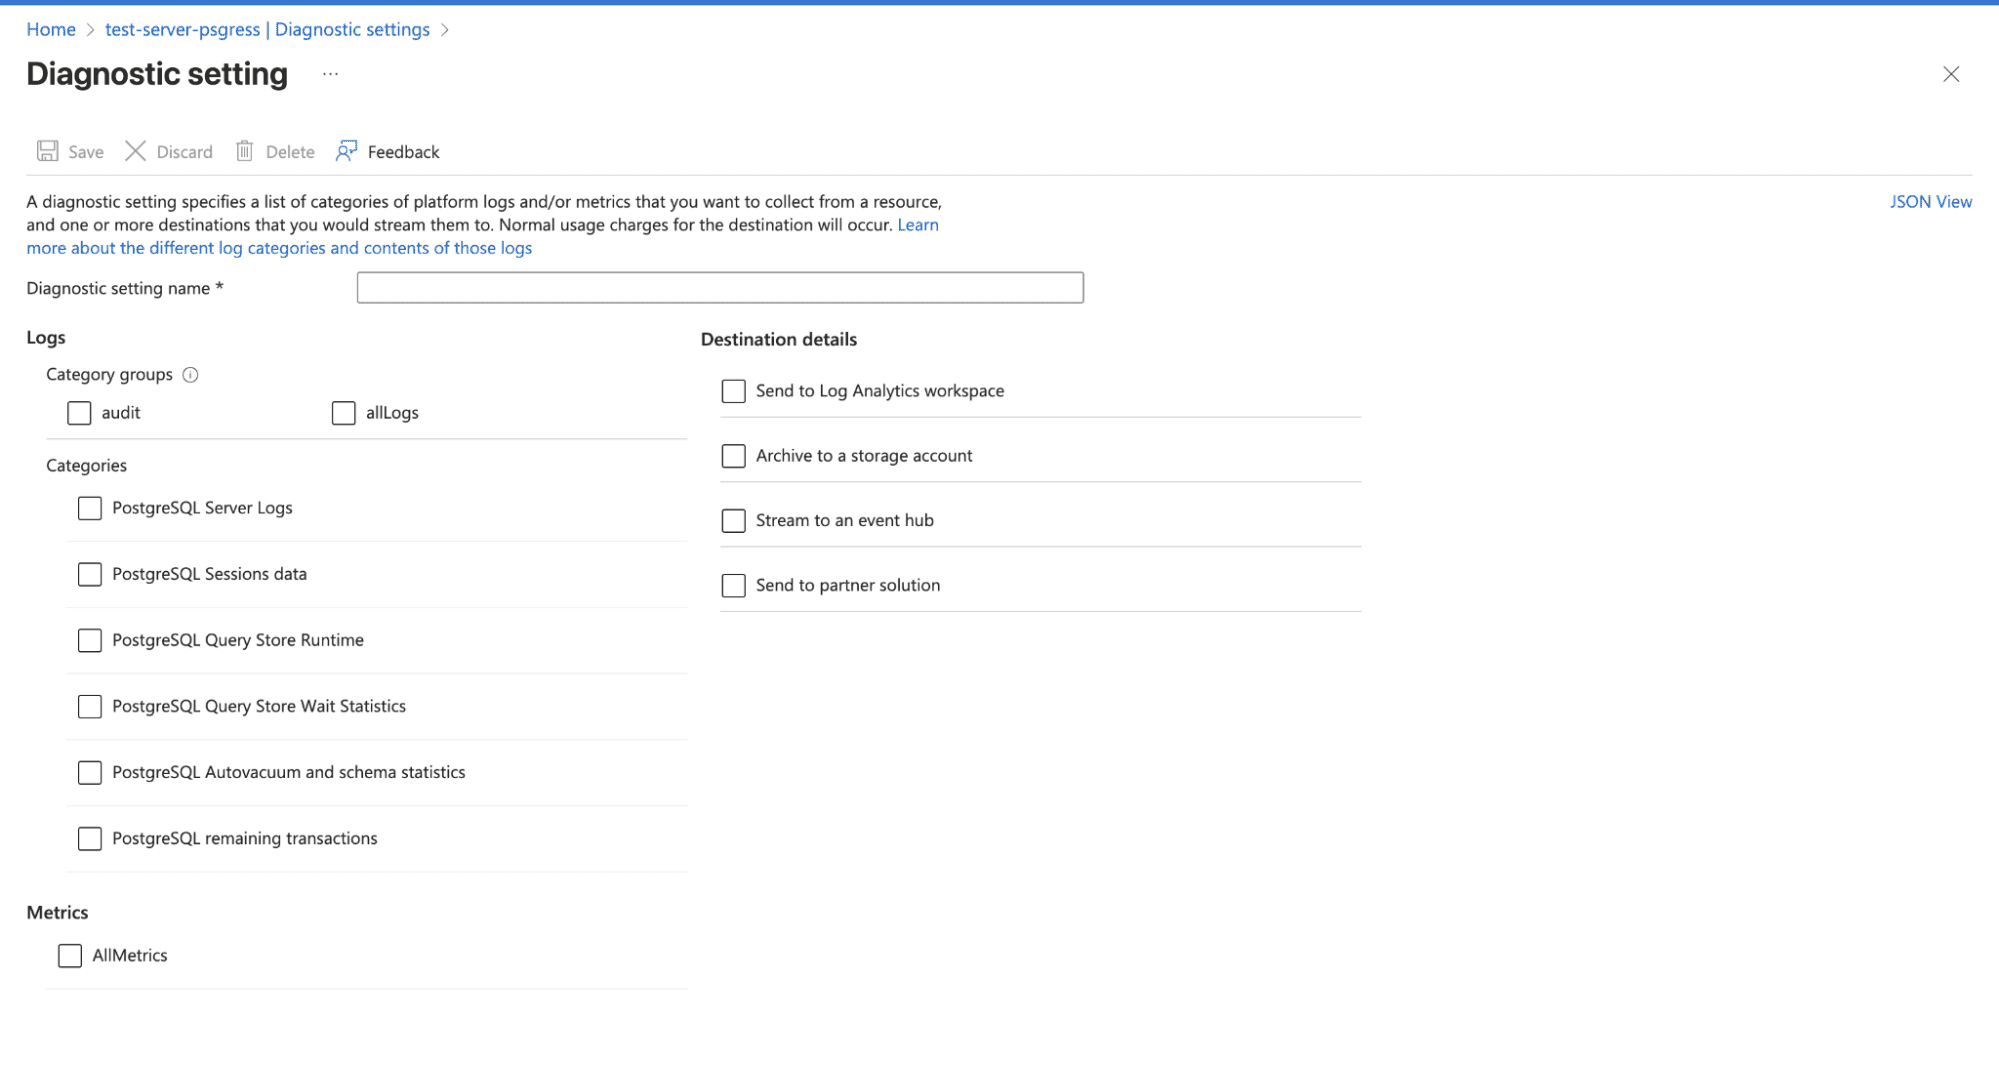
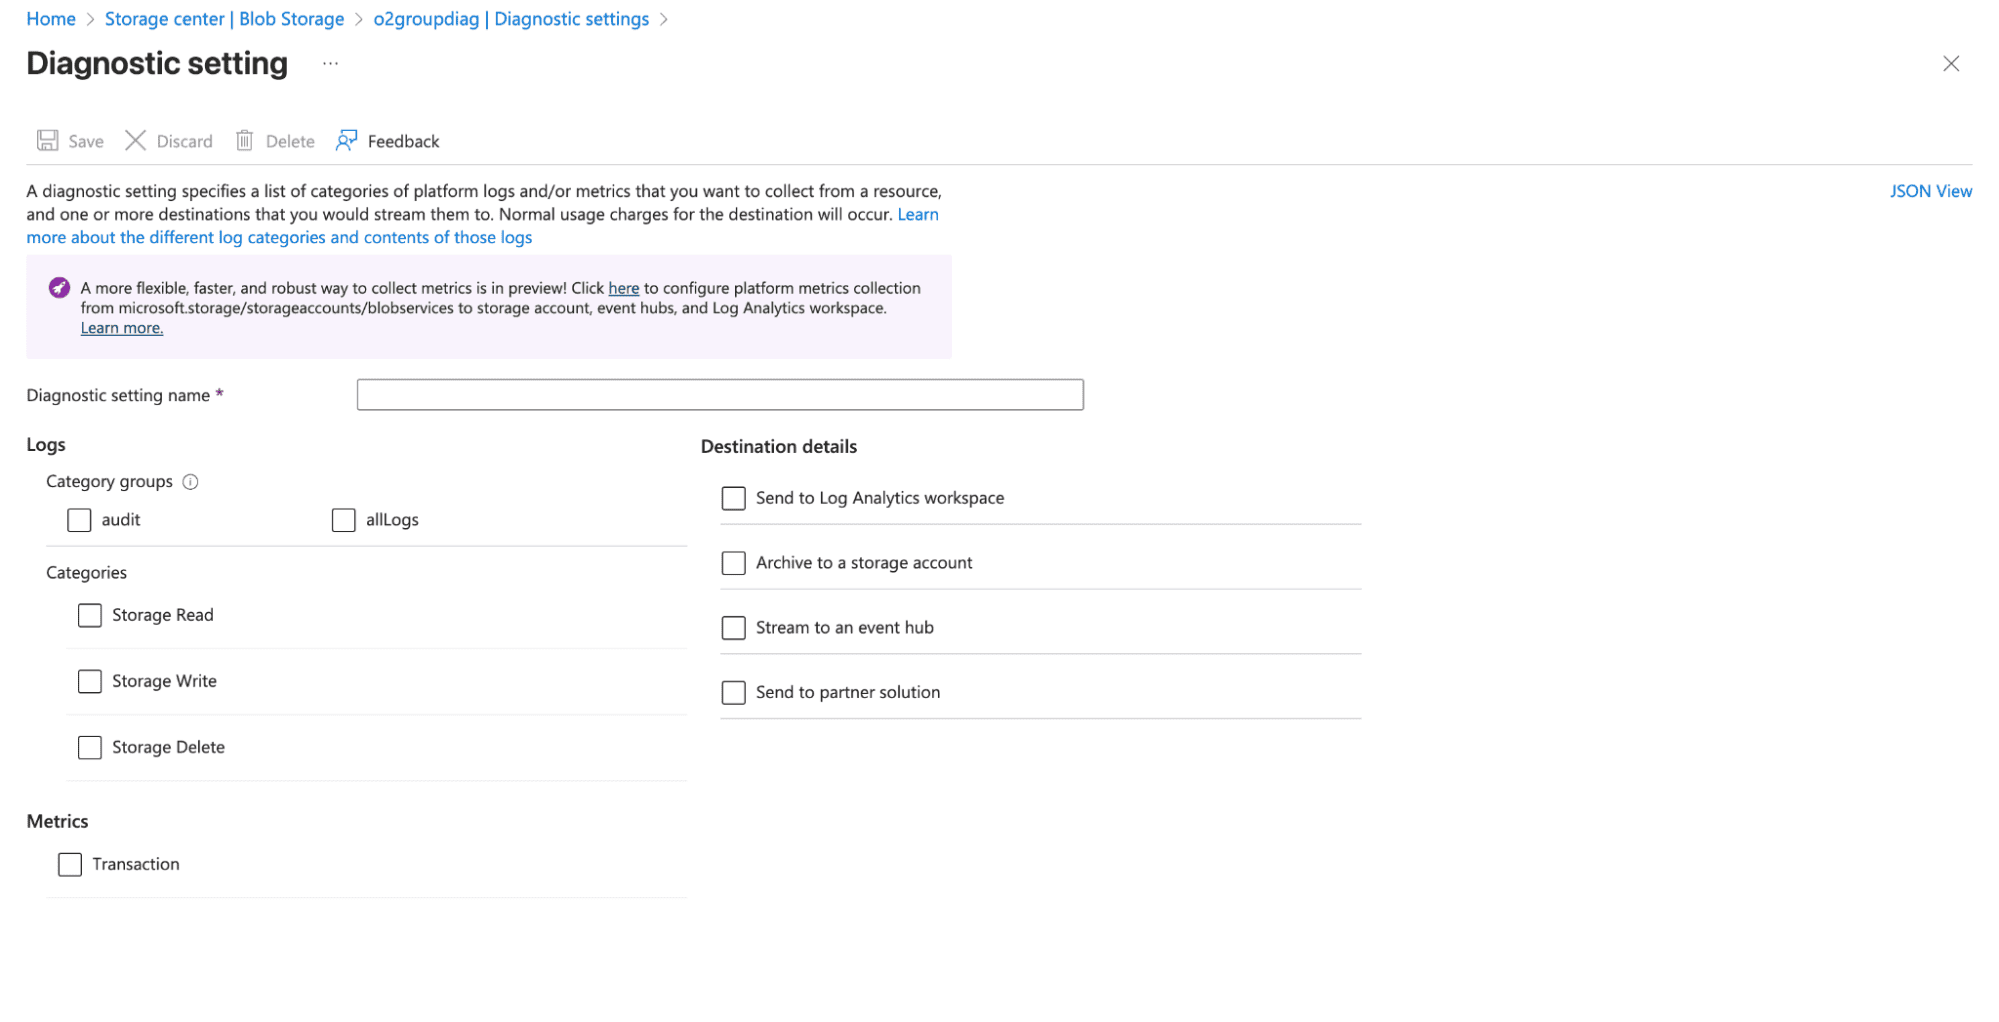
- Storage (Blob / Table / Queue): Read/write/delete logs, transaction metrics, capacity and throttling.
- Key Vault: Audit events, request/response logs, authentication and access policy events.
- Networking (NSG / VNet / Load Balancer): Flow logs, rule matches, probe health, gateway diagnostics.
- App Service / Function Apps: HTTP logs, console logs, audit logs, runtime metrics.
- AKS: Kube-audit, control-plane logs, node metrics, cluster events. AKS logs/metrics can be ingested more efficiently using the OpenObserve Collector.
- Event Hubs / Service Bus: Operational logs, errors, request/response metrics, throughput/latency.
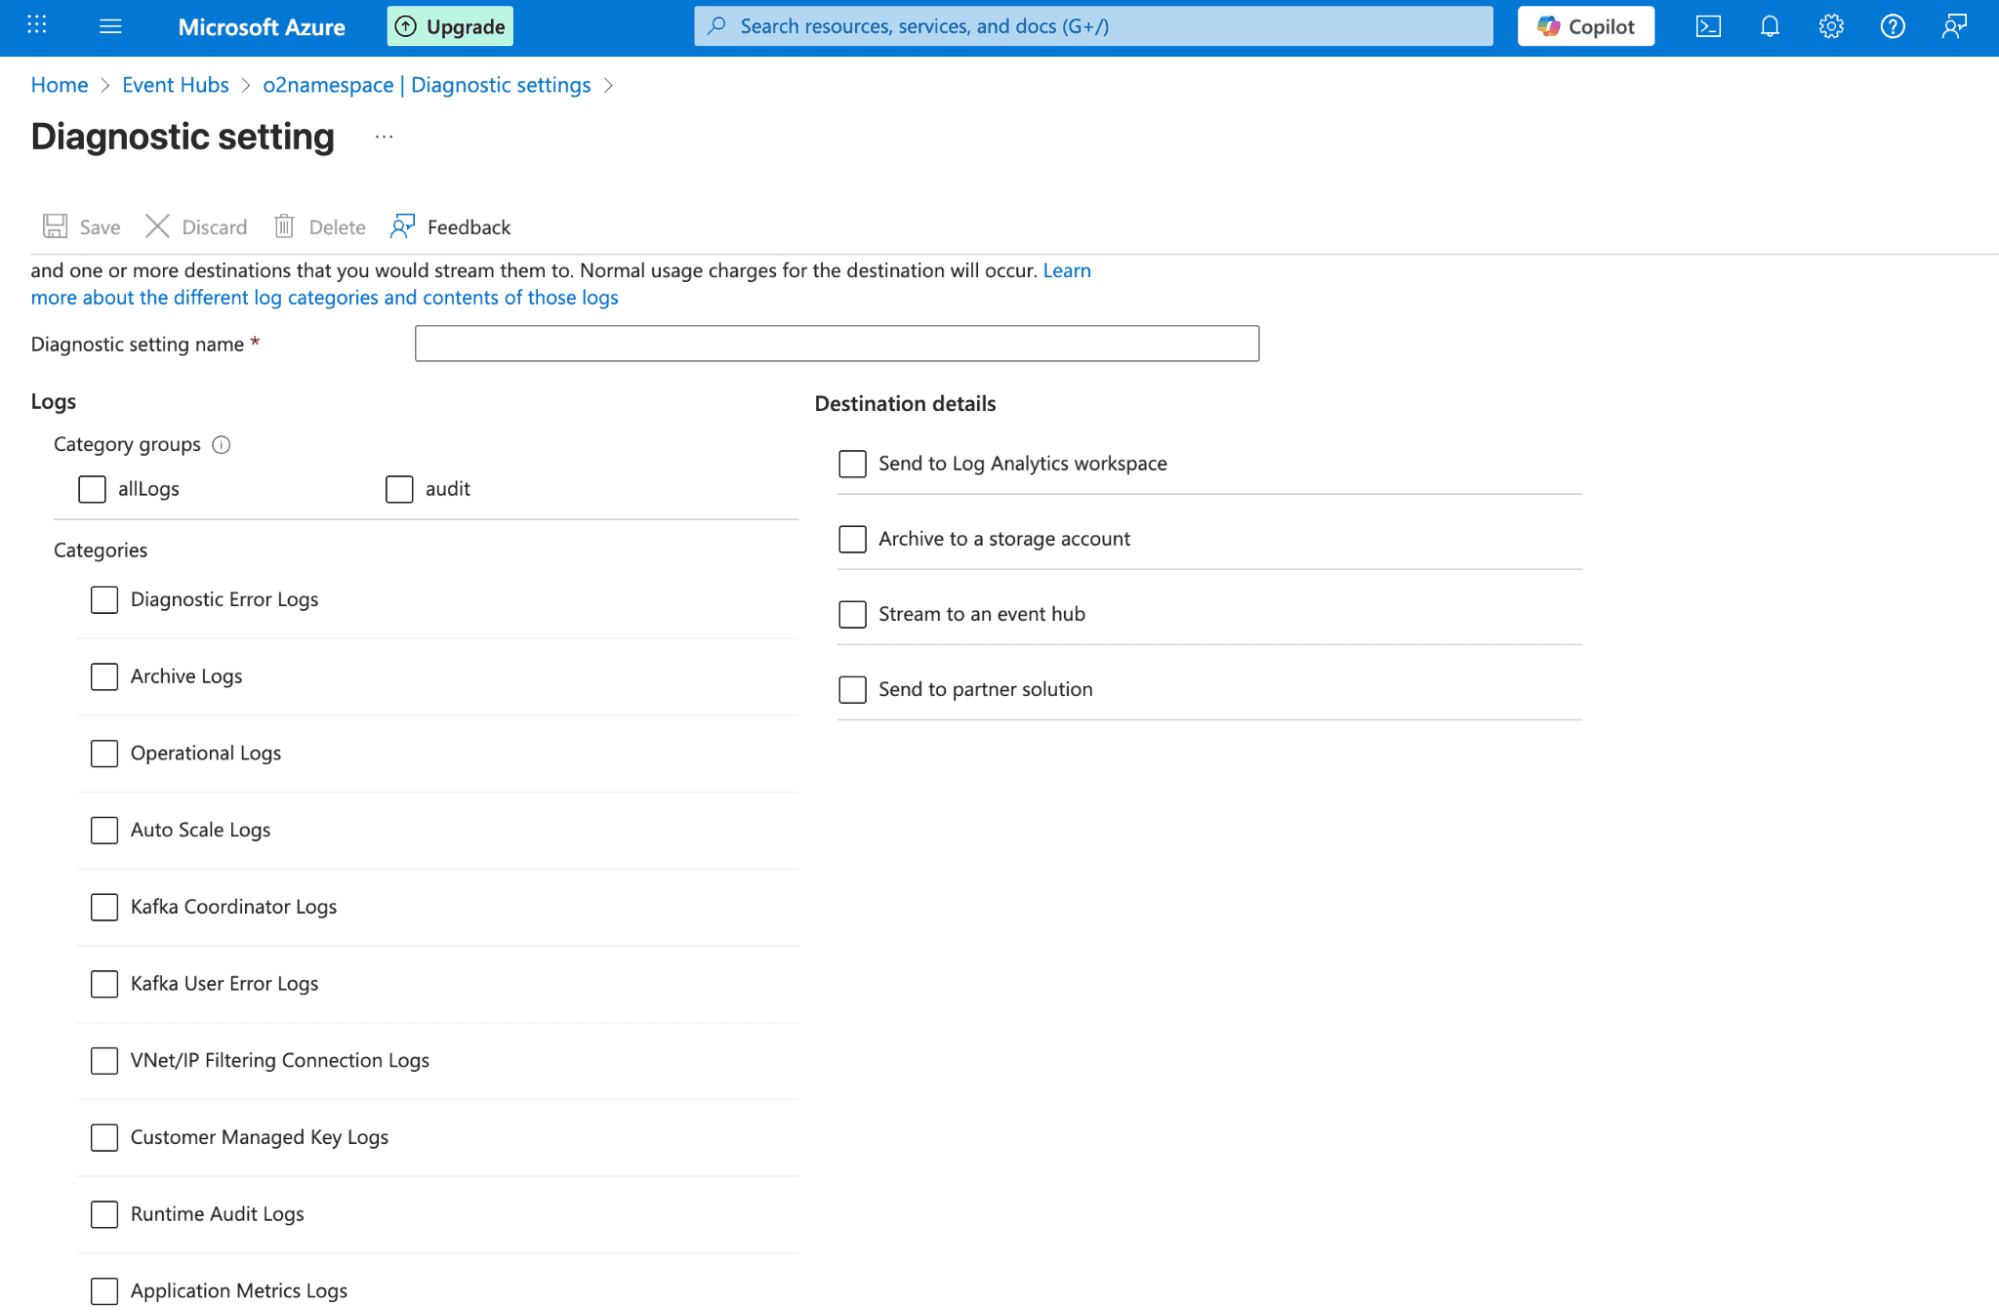
Note: Diagnostic Settings don’t capture everything. For example, VMs don’t stream in-guest OS logs by default, databases may only expose certain engine logs, and some metrics require additional agents or higher-tier monitoring. Always check the categories available in each resource’s Diagnostic Settings to know what you can actually collect.
Prerequisites
Before starting, ensure you have:
- An active Azure subscription.
- Azure Resource to be Monitored
- An OpenObserve cloud account or host an OpenSource version.
Step-by-Step Setup
1. Create an Azure Event Hub
Set up an Event Hub to receive telemetry from all your Azure resources.
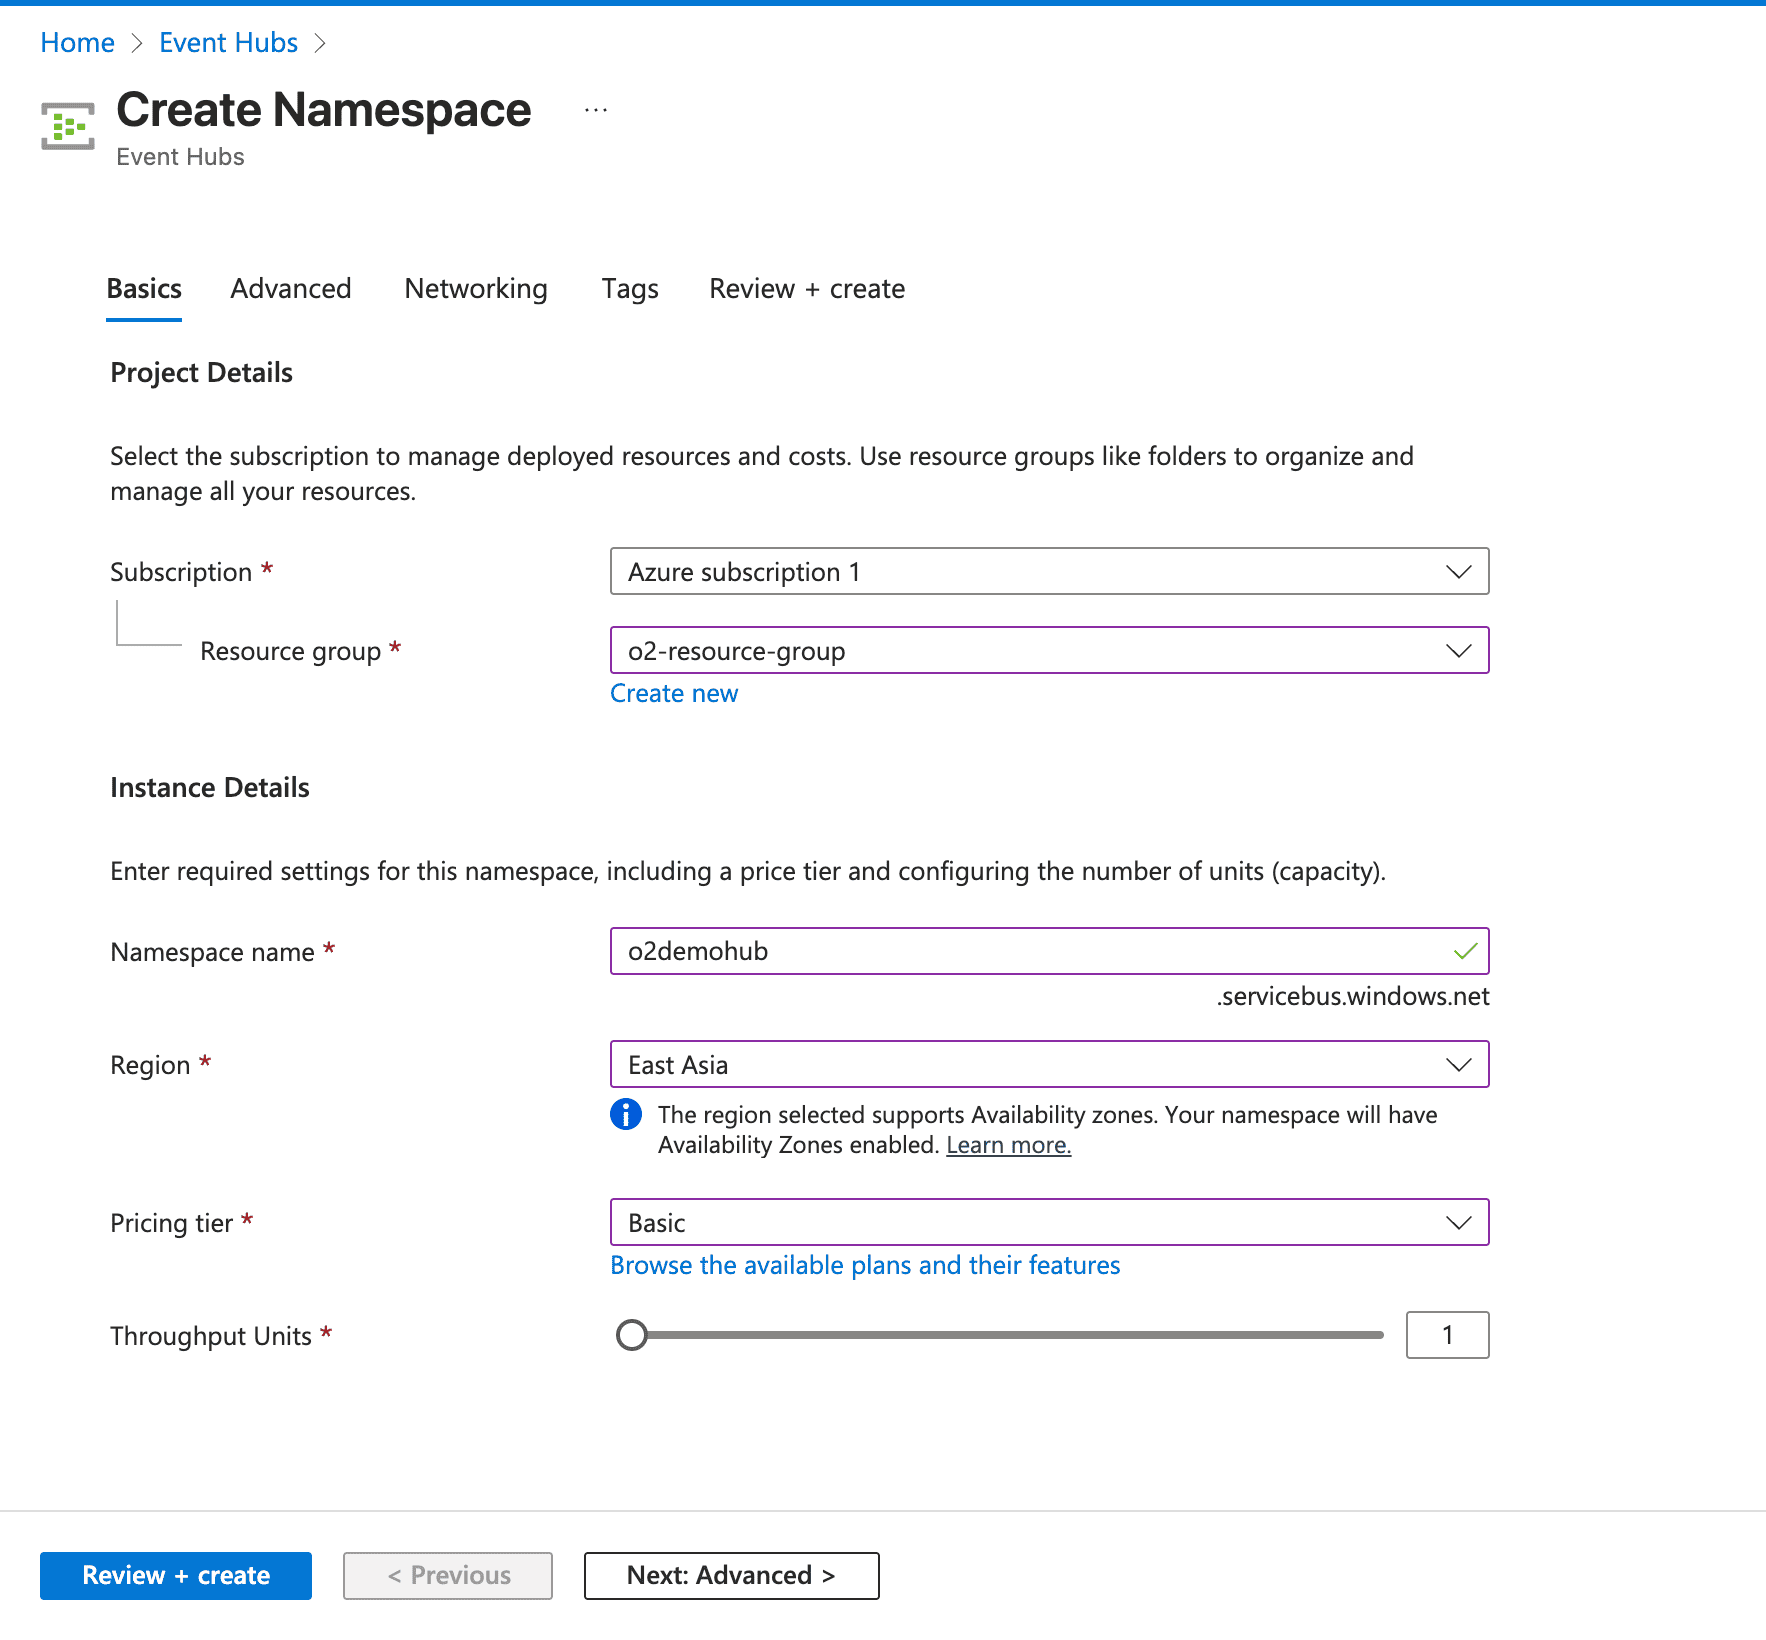
Create an Event Hub Namespace:
- Go to the Azure Portal and search for Event Hubs.
- Click + Add to create a new namespace.
- Provide details:
- Resource Group: Use an existing group or create a new one.
- Namespace Name: Choose a unique name.
- Pricing Tier: Select one based on your log volume.
- Click Review + Create and confirm to deploy.
Add an Event Hub:
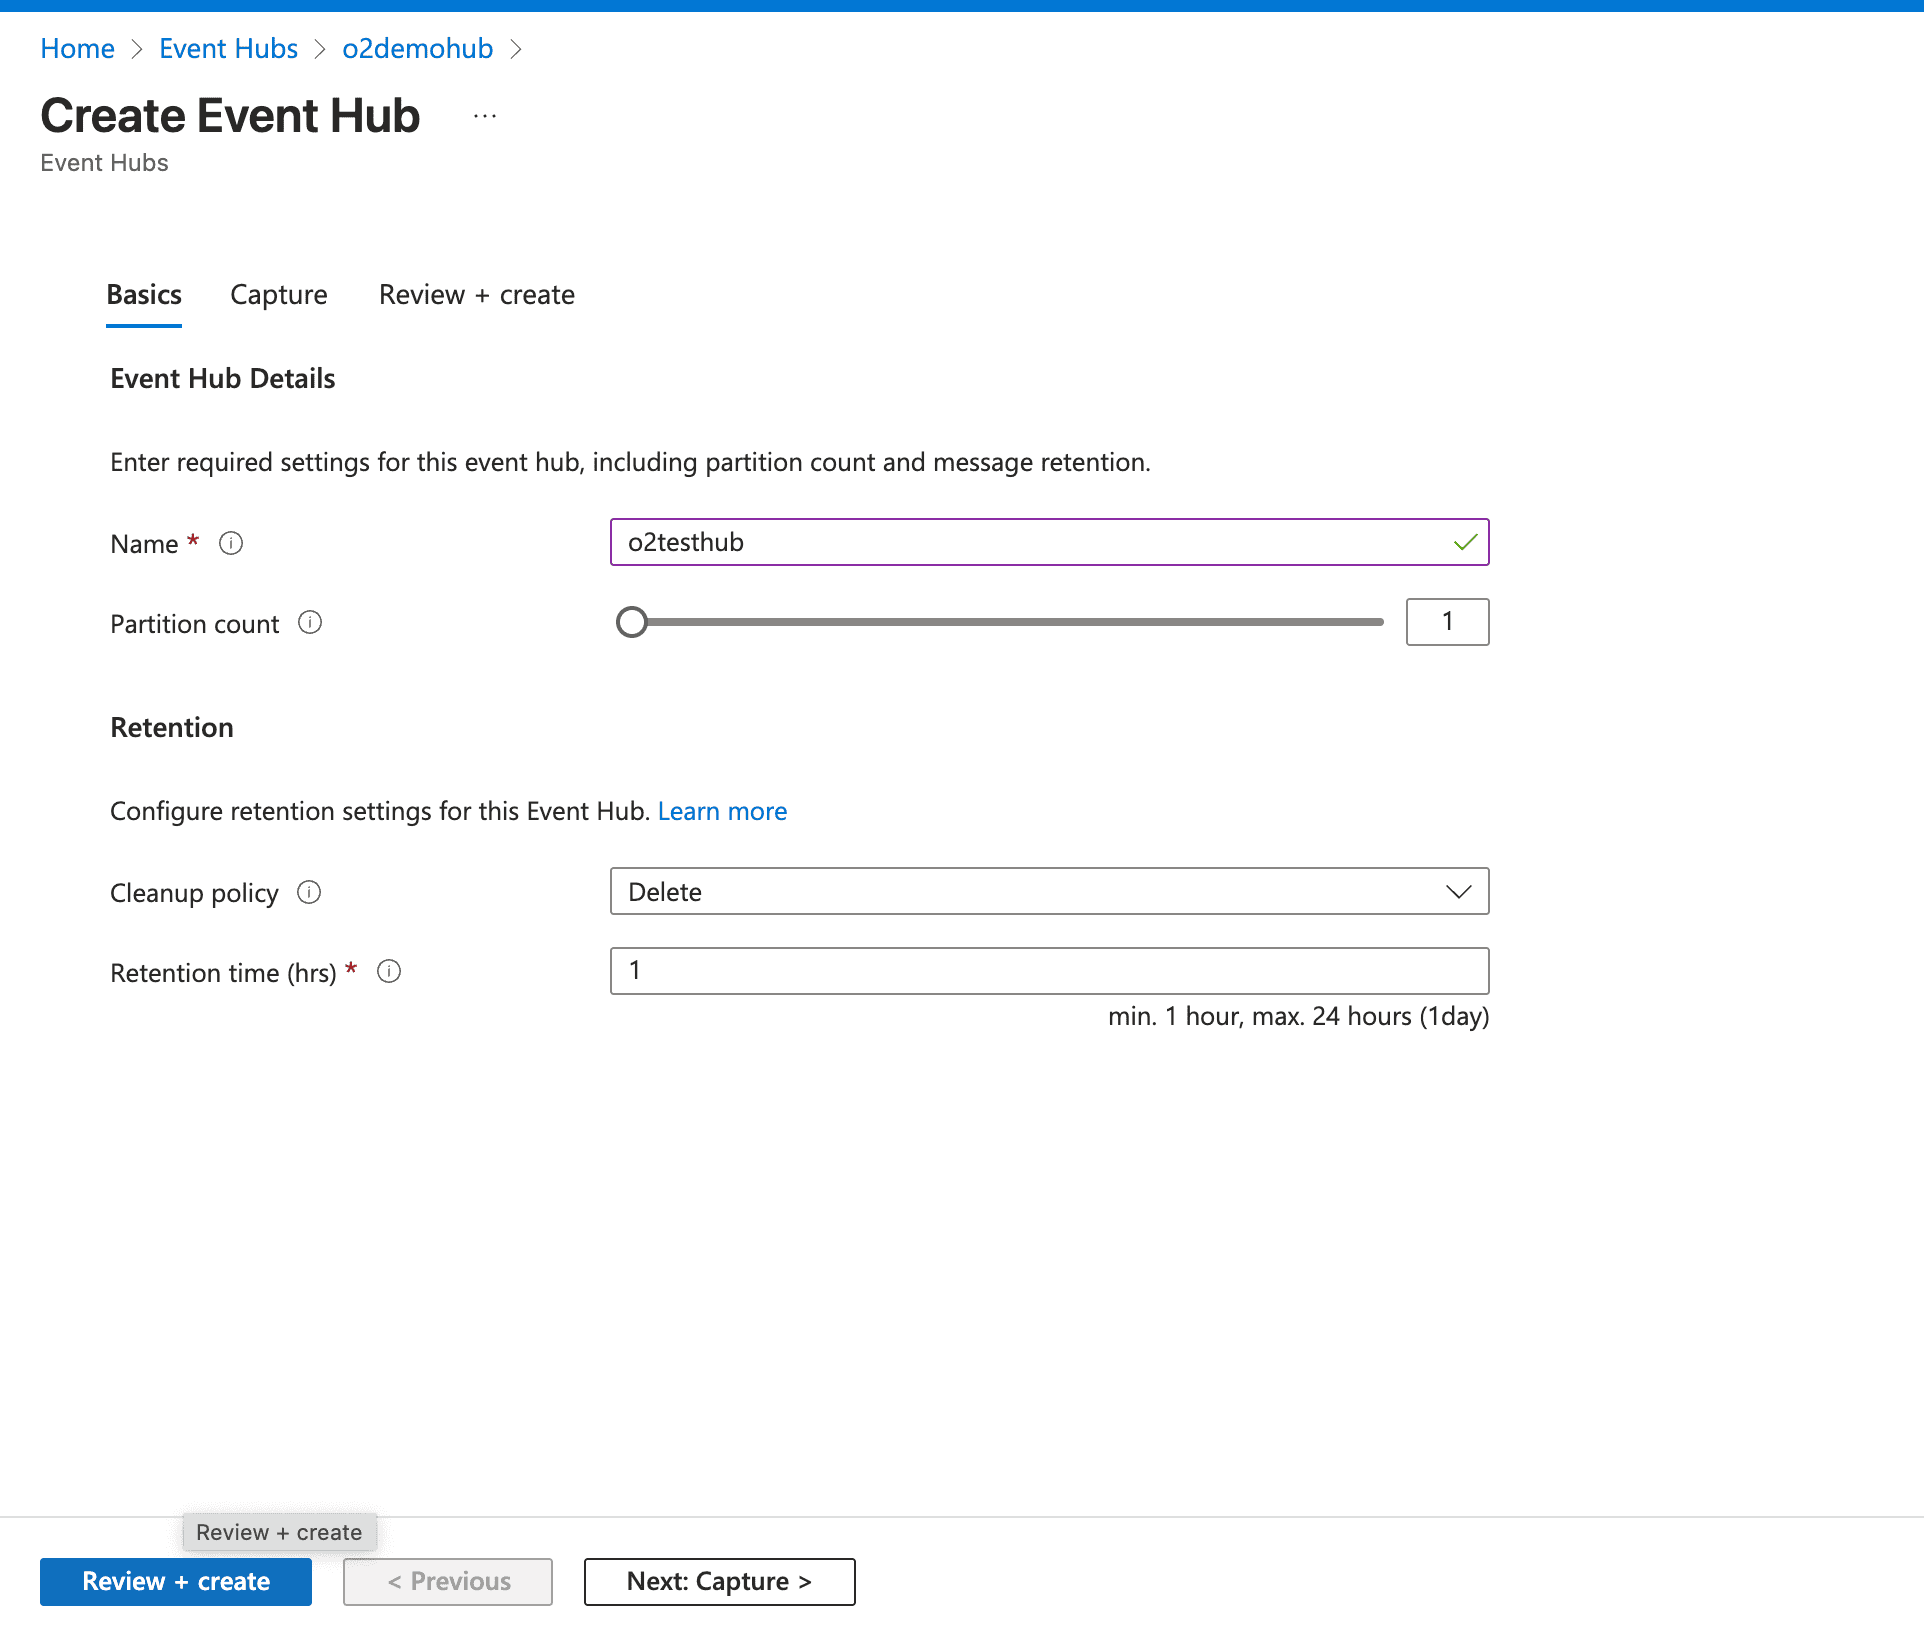
- After the namespace is created, navigate to it and click + Event Hub.
- Name the Event Hub (e.g.,
o2) and leave default settings for Partition Count and Message Retention. - Save the Event Hub configuration.
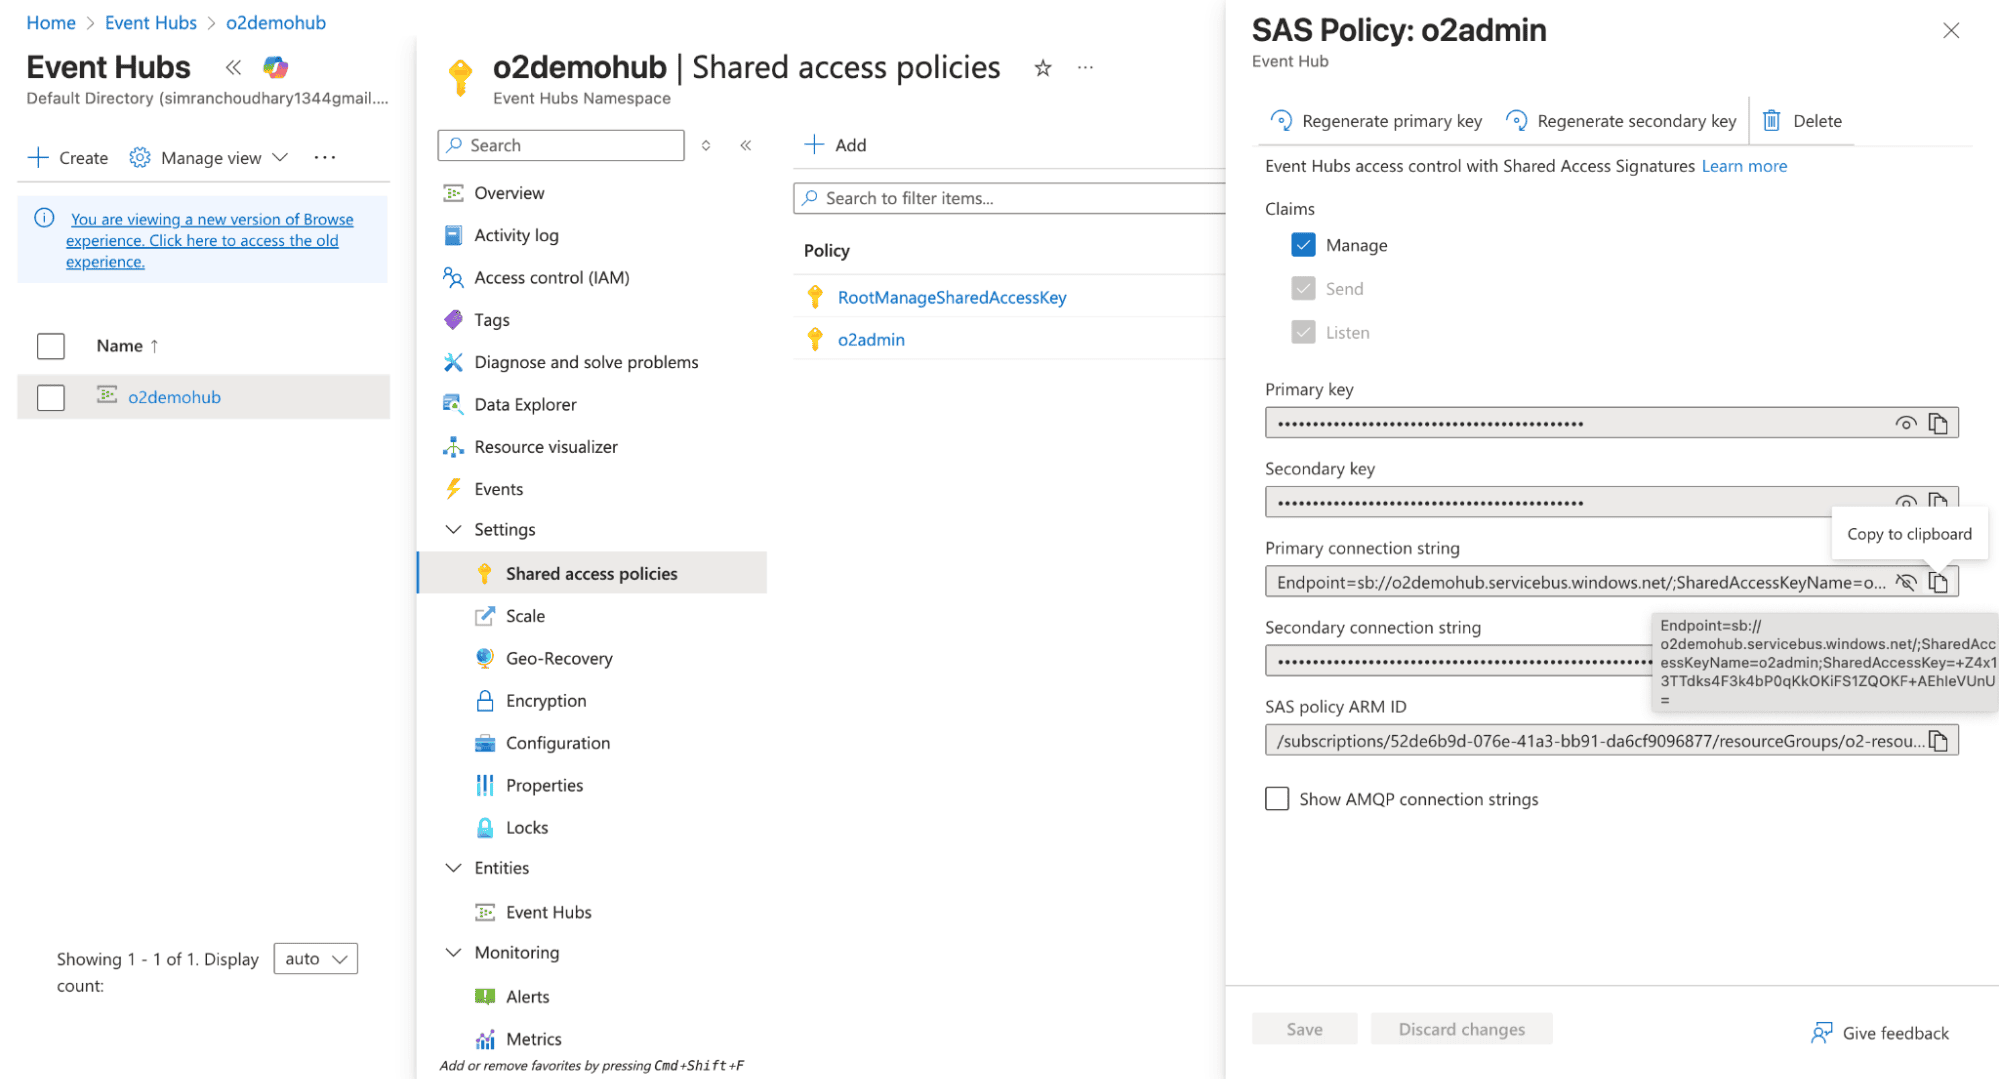
Create a Shared Access Policy:
- Under the namespace, go to Shared Access Policies.
- Add a policy with Manage permission.
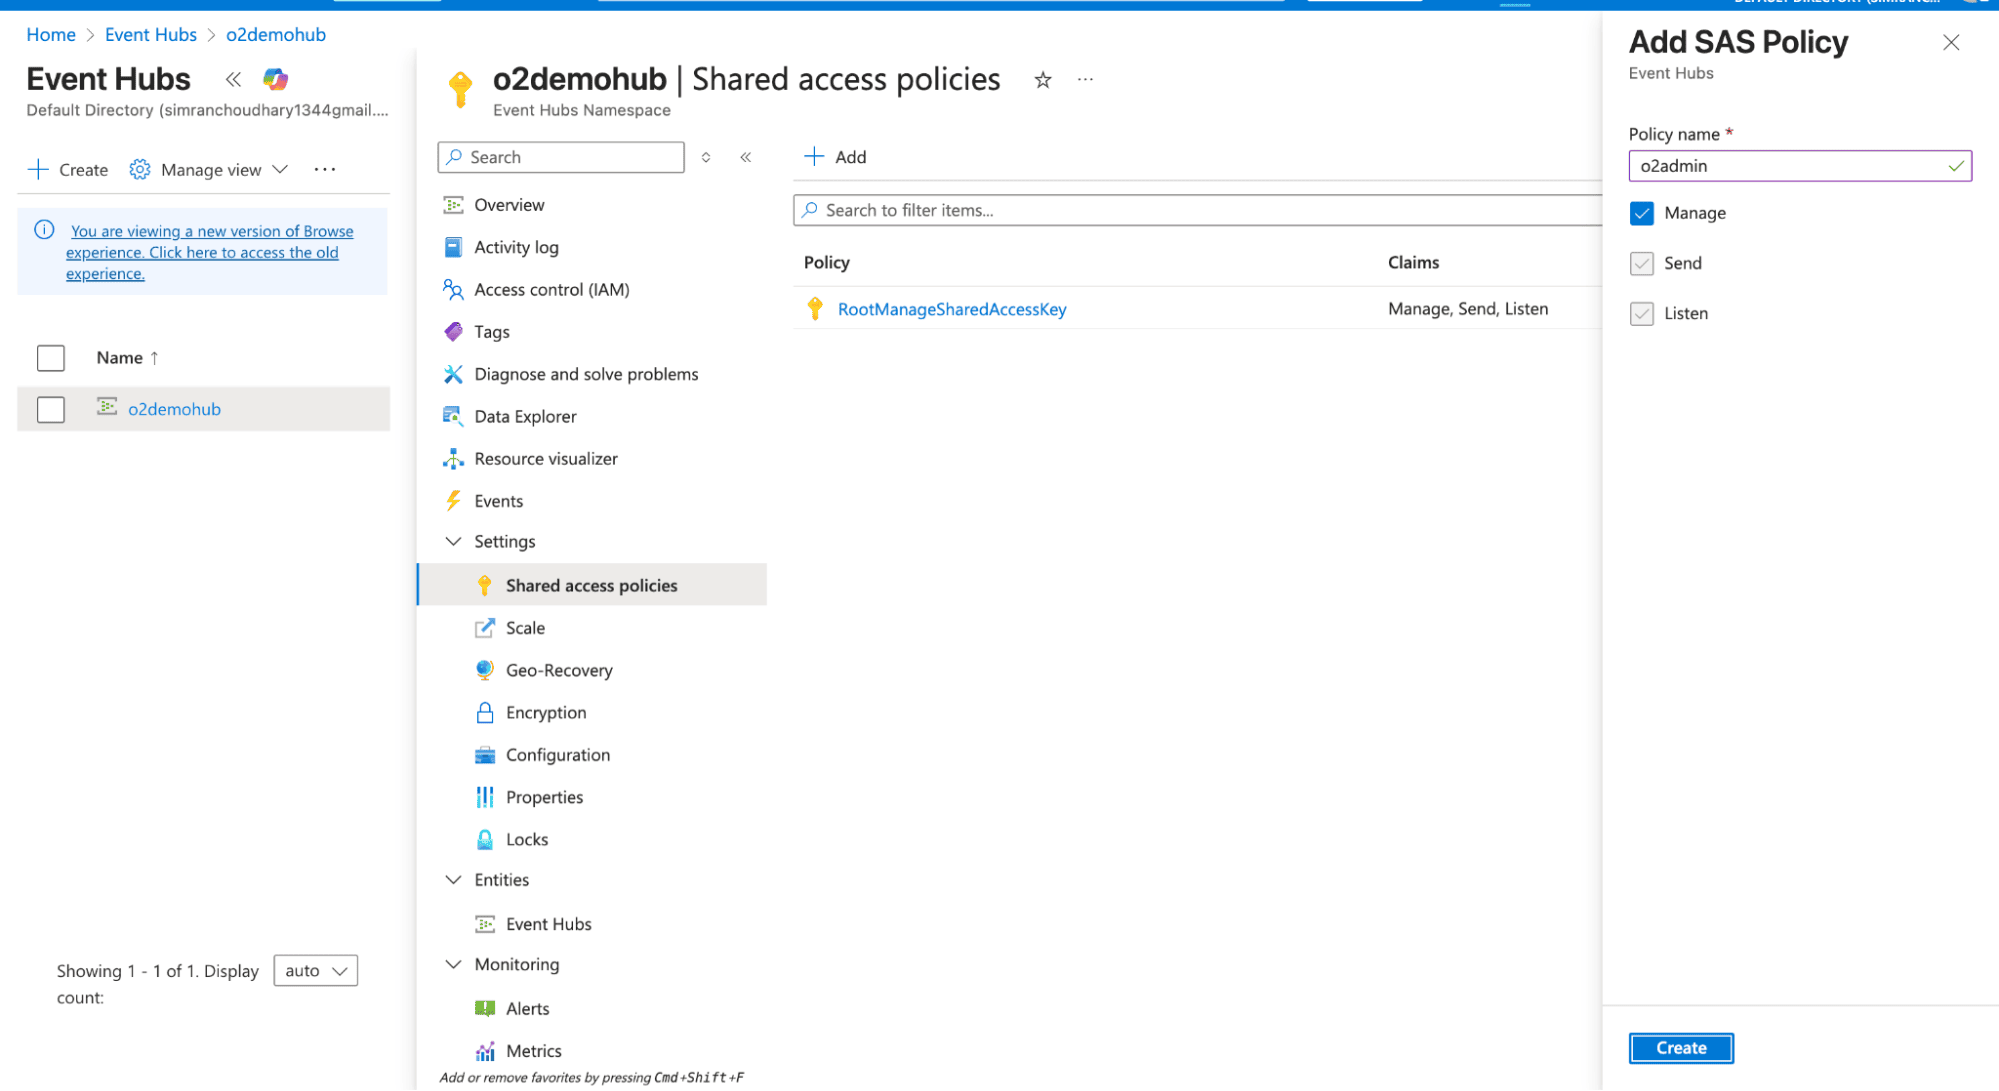
- Save the policy and note the Connection String.
2. Run Otel Collector
You need the OTel Collector to pull the data from EventHub and push it to OpenObserve. You can run the collector anywhere: locally, on an Azure VM, or inside a container, as long as it can reach the Event Hub.
Note: For running OpenTelemetry (OTel) Collector, it is recommended to deploy it within a container rather than directly on a VM. When ingesting data from Microsoft sources, the volume can be high, and running OTel on a VM requires more maintenance to handle the load efficiently.
Download the Collector (Binary)
# Download latest contrib build
wget https://github.com/open-telemetry/opentelemetry-collector-  releases/releases/latest/download/otelcol-contrib-linux-amd64.tar.gz

# Extract
tar -xvzf otelcol-contrib-linux-amd64.tar.gz
cd otelcol-contrib
This gives you the
otelcol-contribbinary you can run directly.Note: Use the contrib build, the regular OTel Collector doesn’t support these receivers.
2. Create a configuration file azure-to-o2.yaml:
receivers:
  azureeventhub:
    connection: "${AZURE_EVENTHUB_CONNECTION_STRING}"

exporters:
  otlphttp/openobserve:
    endpoint: "https://api.openobserve.ai/api/<orgid>"
    headers:
      Authorization: "Bearer <token>"
      stream-name: <log-stream-name>

service:
  pipelines:
    logs:
      receivers: [azureeventhub]
      exporters: [otlphttp/openobserve]
    metrics:
      receivers: [azureeventhub]
      exporters: [otlphttp/openobserve]
Sample connection string:
Endpoint=sb://o2namespace.servicebus.windows.net/;SharedAccessKeyName=o2reader;SharedAccessKey=1Tvmx0n39jahswkjeuy3VVc2S+AEhNXacWs=;EntityPath=o2eventhub
You can fetch the endpoint and openobserve credentials from OpenObserve Data Sources page:
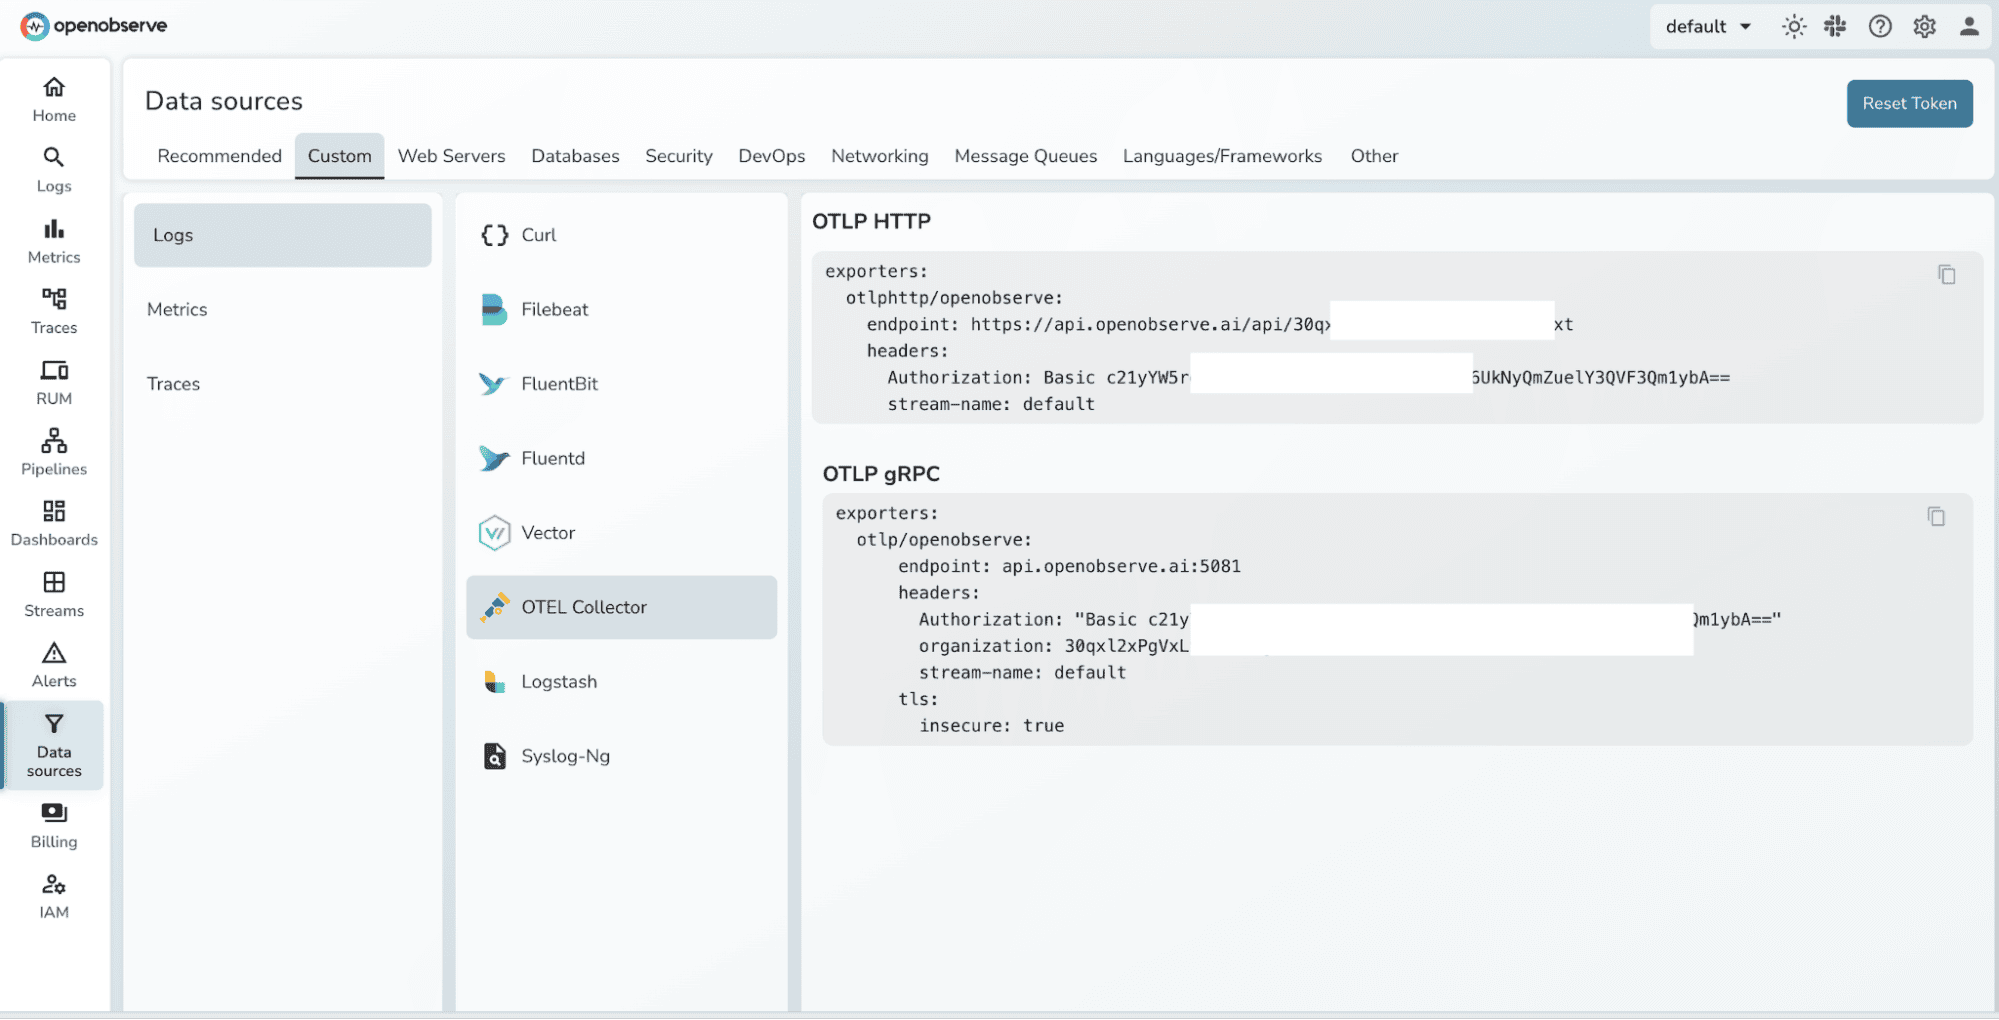
NOTE: For metric names, whatever Azure sends via Event Hub is what lands in OpenObserve, the Collector does not rename them by default unless you add a metric transform.
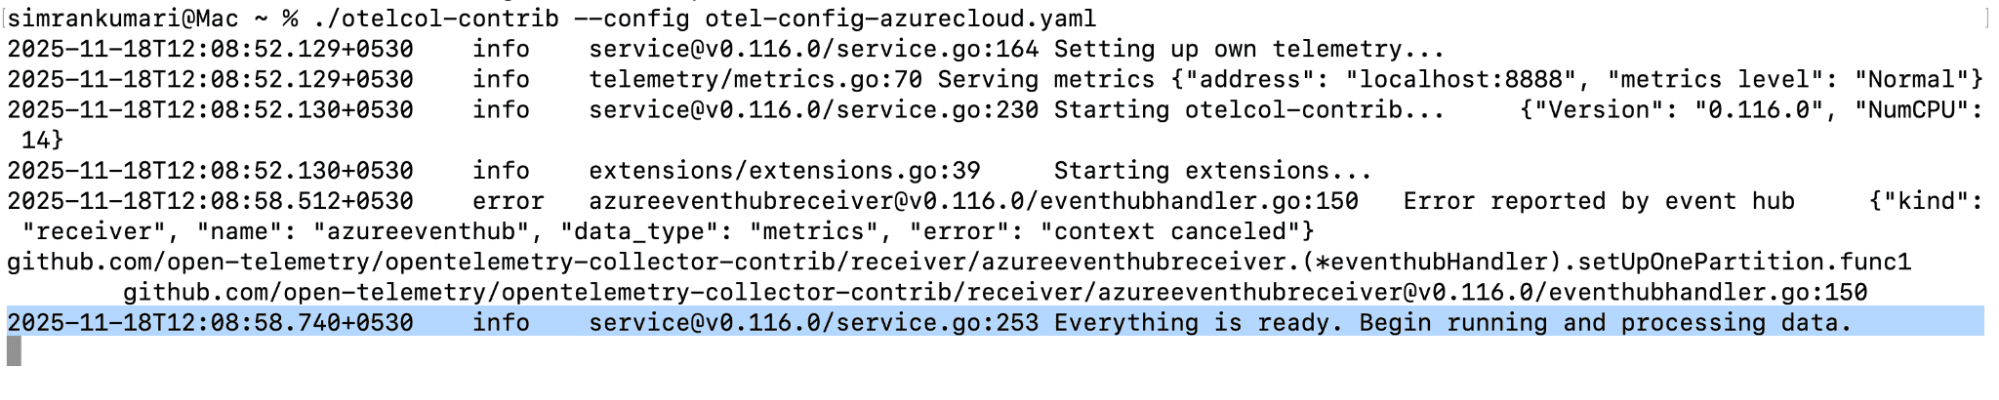
3. Run the otel-collector :
./otelcol-contrib --config azure-to-o2.yaml
3. Enable Diagnostics Logging
Enable the Azure resources to stream logs and metrics to the Event Hub.
- Navigate to the Azure Resource → Go to Monitoring → Diagnostic Settings.
- Configure a new diagnostic setting:
- Name the setting.
- Select categories of Logs and Metrics.
- Choose Stream to an Event Hub as the destination.
- Provide the Event Hub namespace and Eventhub name.
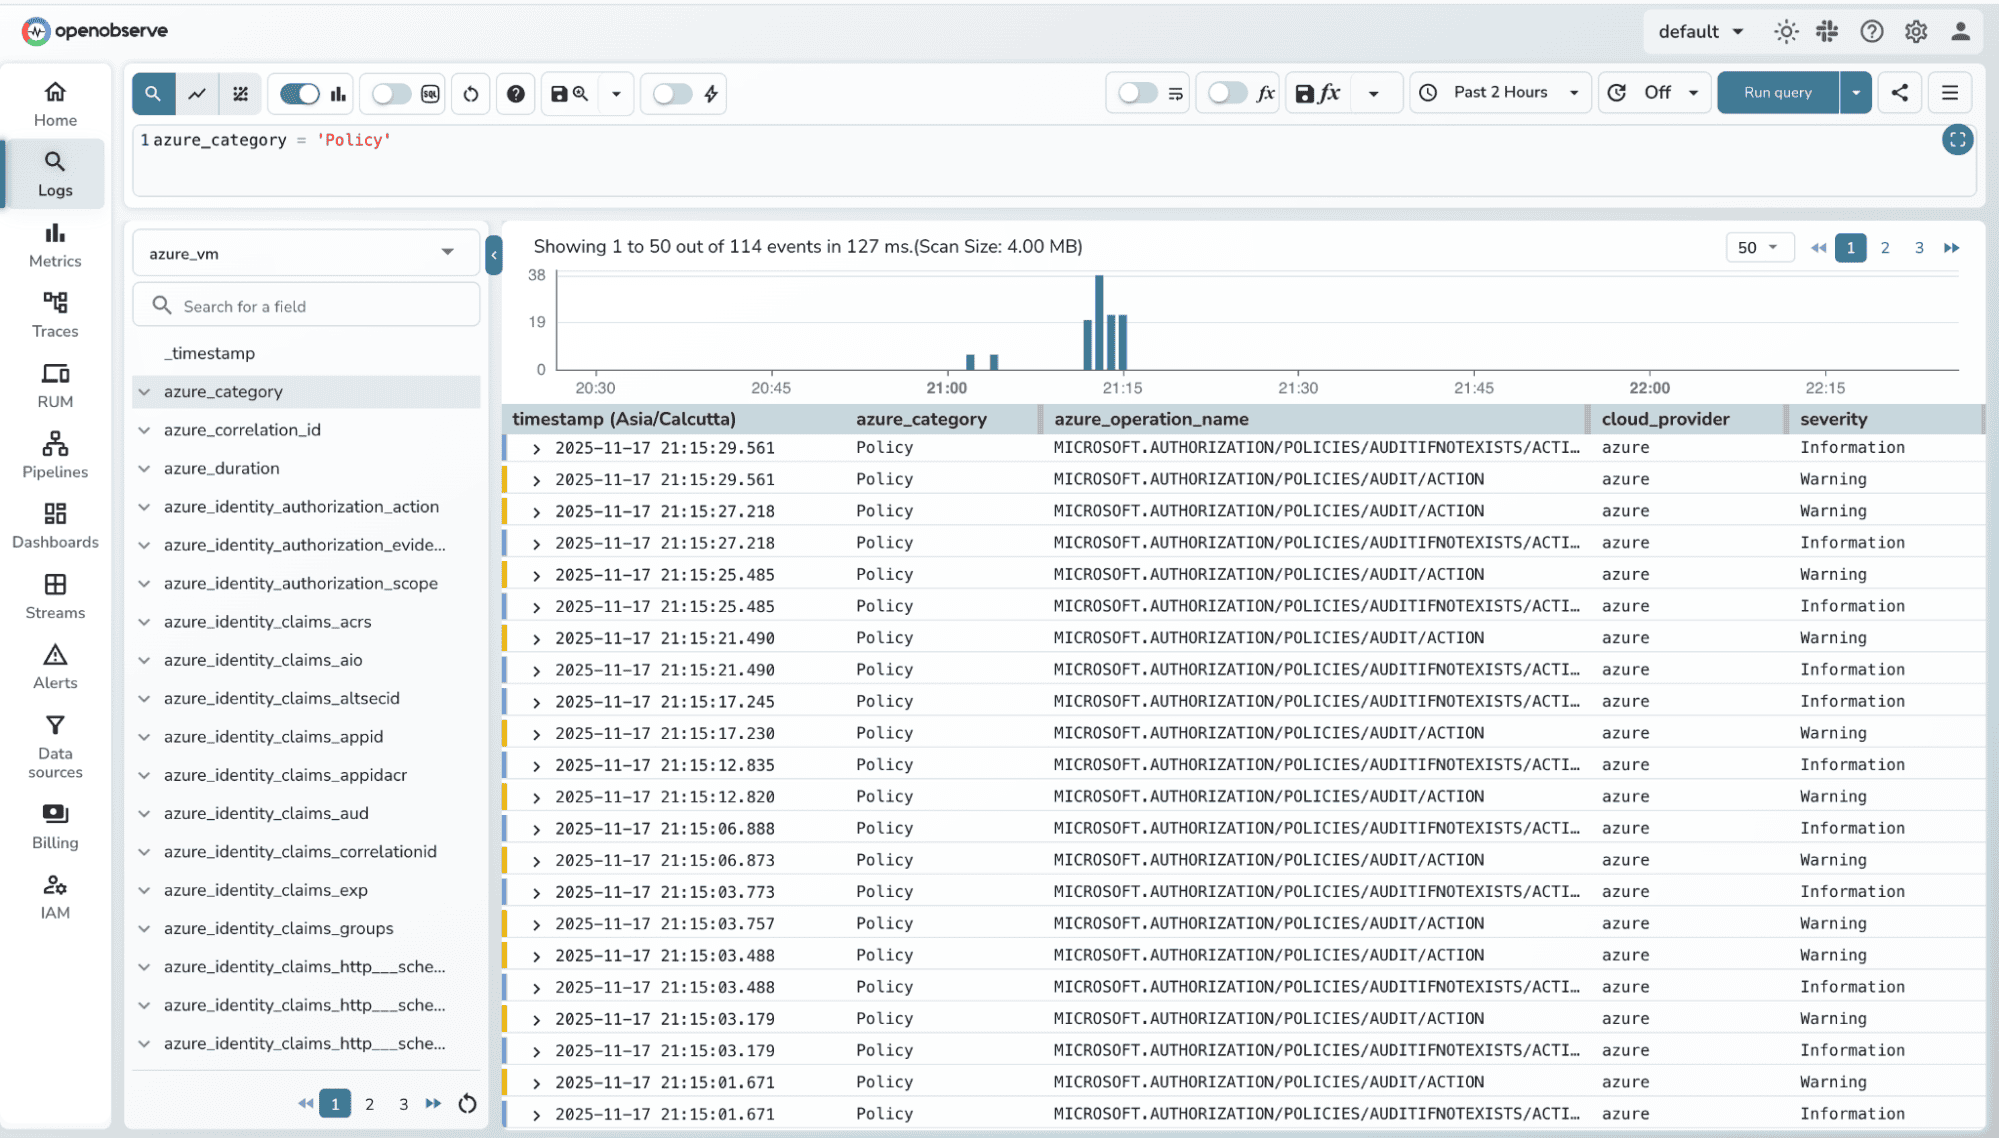
4. Verify Logs in OpenObserve Cloud
Confirm logs and metrics are arriving correctly in OpenObserve.
- Log in to OpenObserve.
- Go to your logs or metrics explorer.
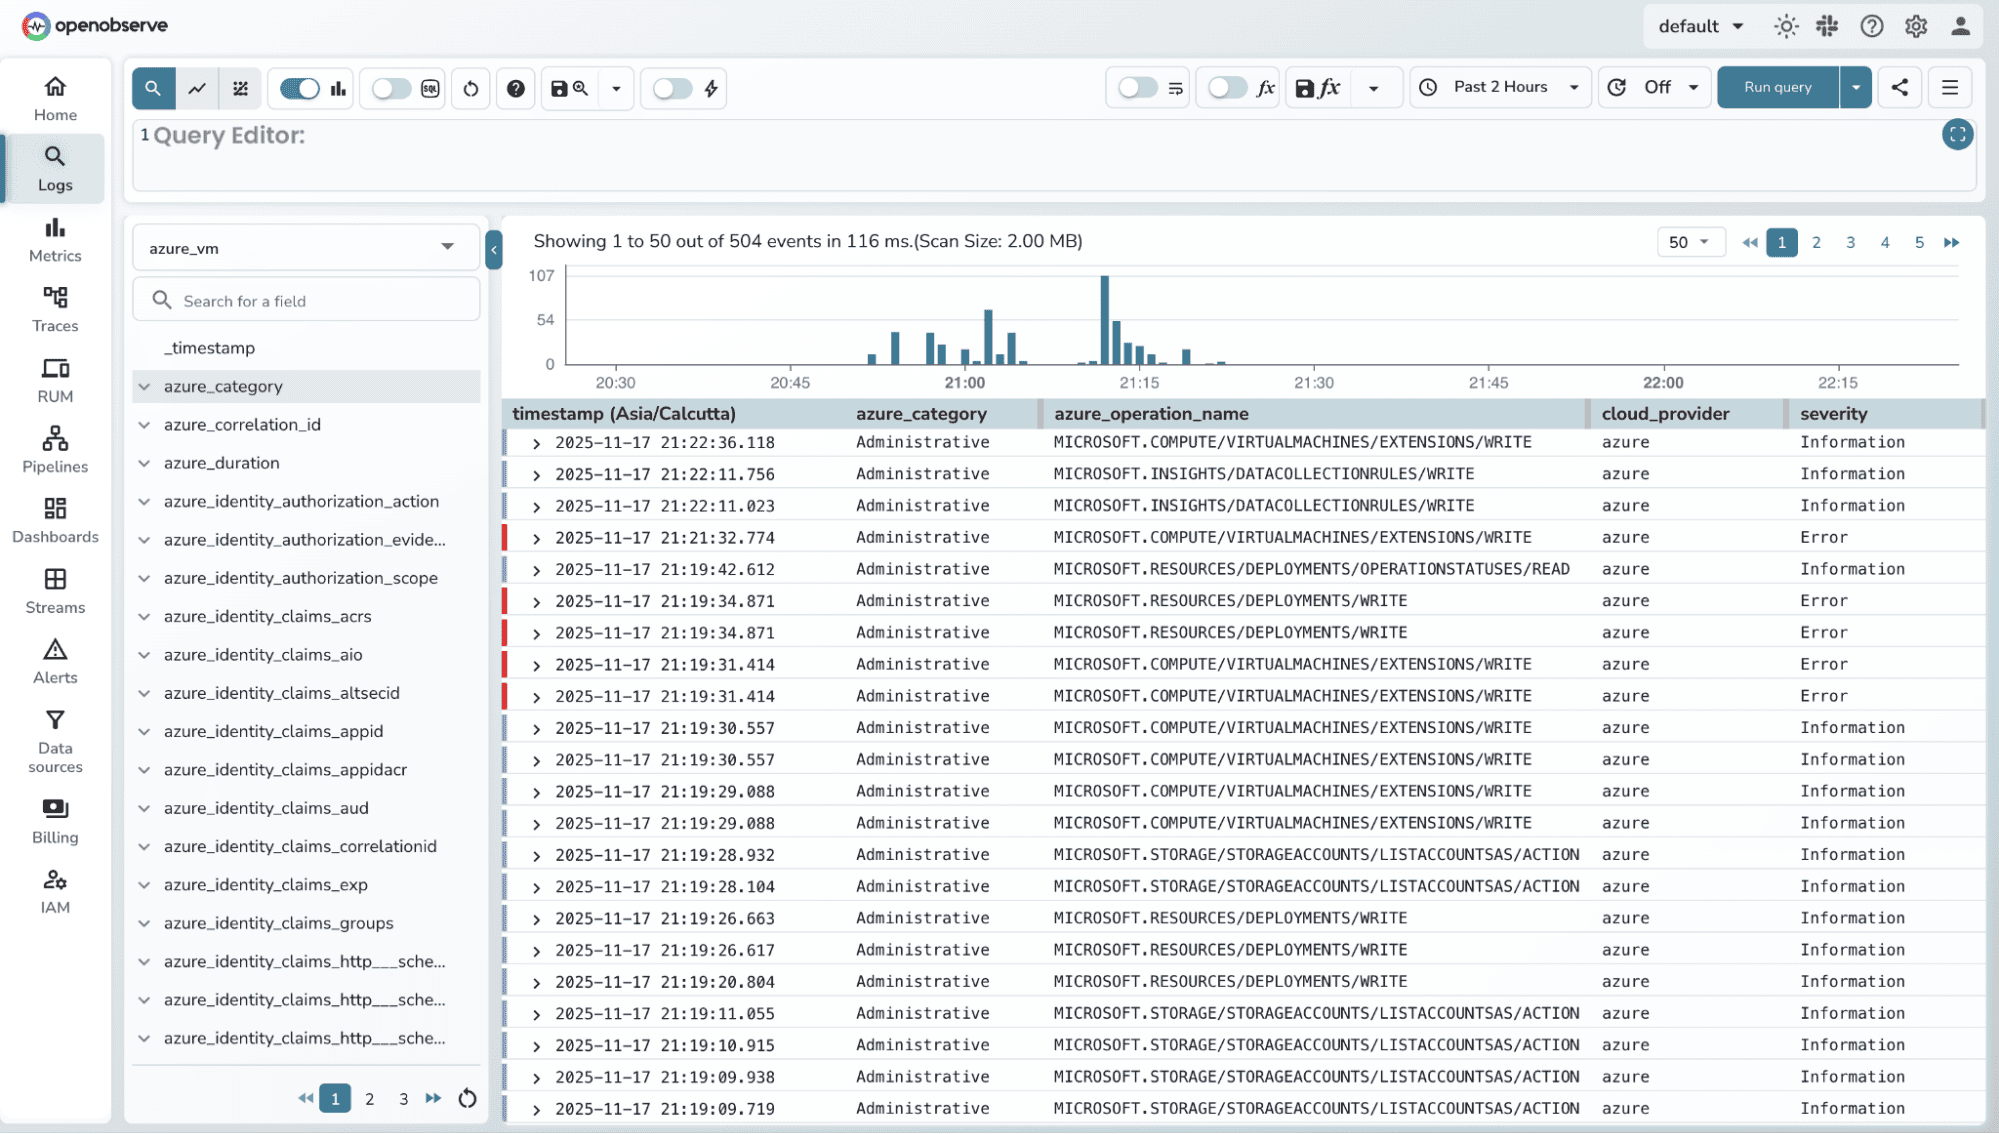
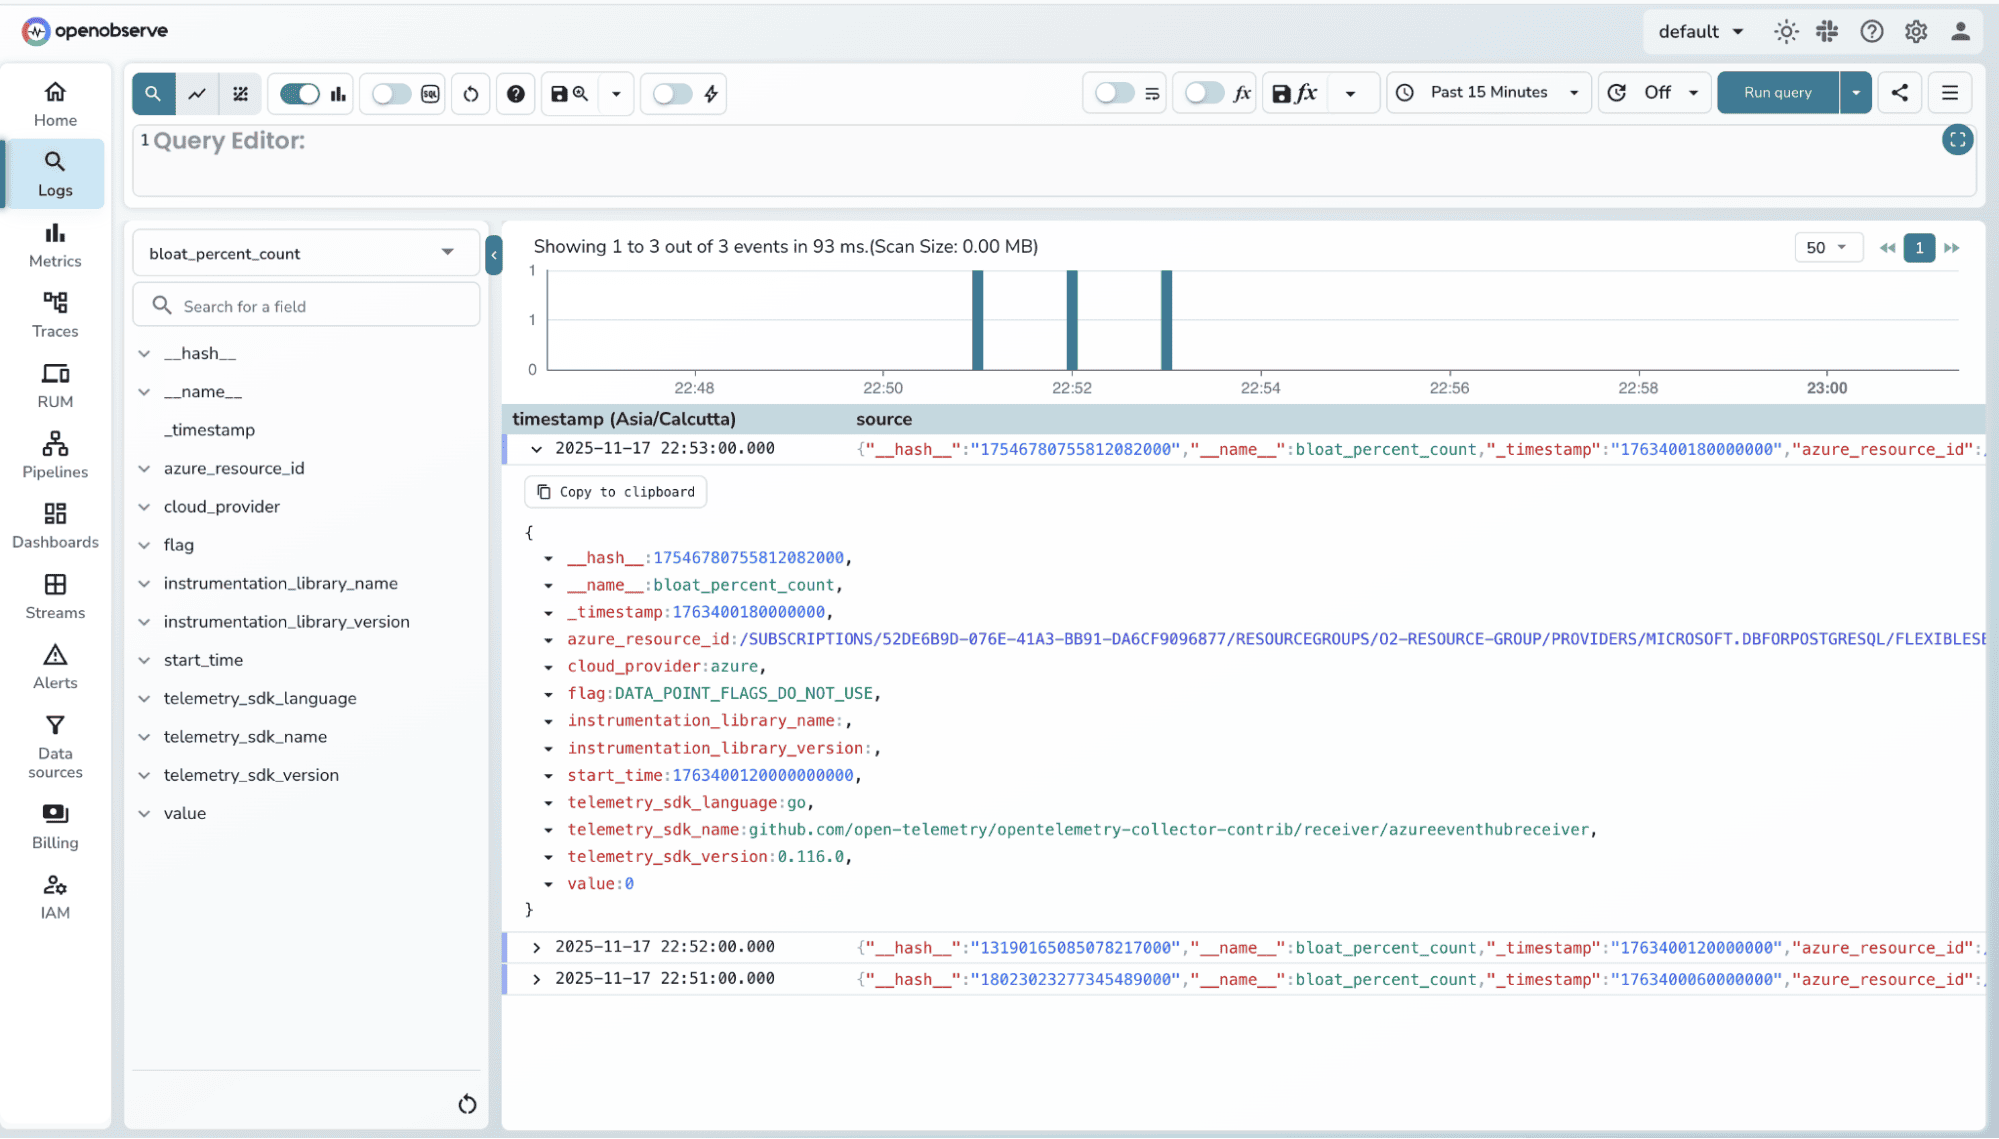
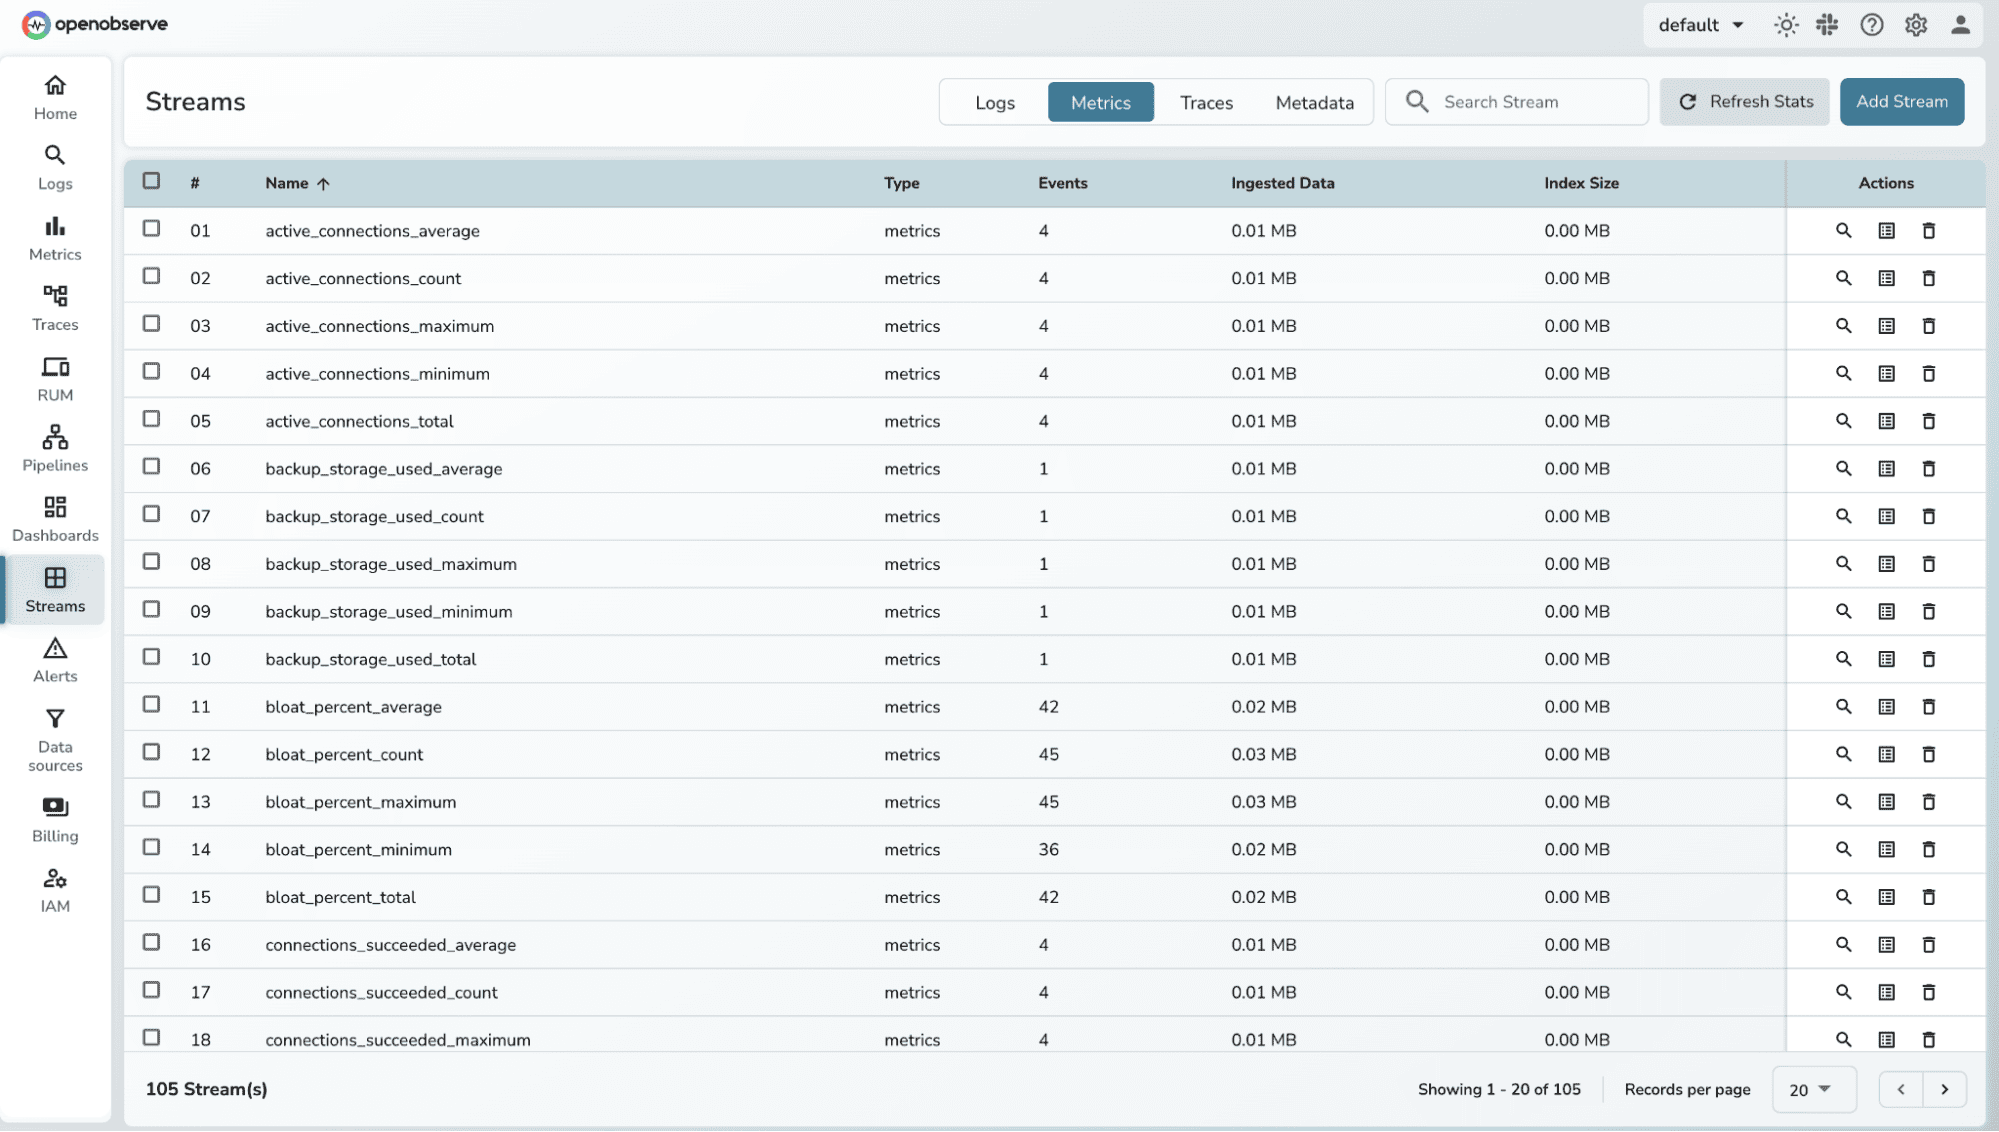 You can filter logs using SQL Queries. Refer to the Log searching and Filtering guide for more details.
Troubleshooting Common Issues
Even with a clean pipeline, a few things can go wrong. Here’s how to quickly identify and fix them:
1. No Logs or Metrics Appearing
- Check Diagnostic Settings: Ensure the resource has the correct categories selected and is streaming to the right Event Hub.
- Verify Event Hub Connection: Make sure the connection string and consumer group in
azure-to-o2.yamlmatch your Event Hub. - Collector Logs: Look for errors or retries common errors are authentication failures or throttling.
2. Metrics Missing or Sparse
- Some metrics require higher-tier SKUs or additional agents. For example, VM guest OS metrics may need the Azure Monitor agent for in-guest telemetry.
- Confirm your Diagnostic Settings include “AllMetrics” or the specific metric categories.
3. Collector Fails to Start
- Ensure the
otelcol-contribbinary has execute permissions (chmod +x otelcol-contrib). - Check for missing dependencies (e.g., on Linux,
glibcor network connectivity to Event Hub). - If running in Docker, make sure the config file is mounted correctly and environment variables are set.
4. Export Errors to OpenObserve
- Invalid configuration errors: Double-check YAML formatting and
logFormat/metricssections. Azure Event Hub receiver only supportsazureorrawfor logs; metrics require structured categories.
Tip: Always start small, verify one resource first, then scale to multiple resources. This helps isolate configuration issues quickly.
Conclusion
Monitoring Azure doesn’t have to be fragmented. With a generic pipeline : Diagnostic Settings → Event Hub → OTel Collector → OpenObserve , you can collect logs and metrics from any resource without extra agents or custom exporters.
Key points to remember:
- One pipeline fits all resources: VMs, databases, storage, networking, and more.
- Diagnostic Settings are your source of truth: Pick the right categories for logs and metrics; some telemetry may need additional agents.
- Collector is flexible: Run locally, on a VM, or in a container; ensure connectivity to Event Hub and OpenObserve.
- Verification is crucial: Always test with sample logs/metrics before scaling to multiple resources.
- Scale confidently: Once configured, adding new resources is simple , just enable Diagnostic Settings and they automatically flow into OpenObserve.
With this approach, you get a centralized, consistent, and reusable observability pipeline for all your Azure resources , making monitoring simpler, faster, and actionable.
Next Steps
Once your Azure resources are streaming into OpenObserve, you can level up your monitoring:
Build Dashboards Visualize logs and metrics across VMs, databases, storage, and networking in one place. Focus on high-value signals like CPU spikes, slow queries, errors, or dropped packets.
Set Up Alerts Use OpenObserve SQL-based alerts to catch anomalies, errors, or threshold breaches in real time. Example: alert when database connection count exceeds a limit or VM disk I/O is saturated.
Aggregate & Correlate Across Resources Combine logs and metrics from multiple resources to get a single-pane-of-glass view.
Automate Scaling & Response Use the metrics and alerts to automate autoscaling or trigger incident workflows in your tooling.
Expand to More Resources Once the pipeline works for VMs and databases, add storage accounts, AKS, Event Hubs, Key Vaults , the pipeline is generic, so onboarding is straightforward.
About the Author
Simran Kumari

Passionate about observability, AI systems, and cloud-native tools. All in on DevOps and improving the developer experience.
Follow OpenObserve on Google
Add OpenObserve as a preferred source to see more of our articles in Google Search and Top Stories.












